

MR 4D flow-based mean pulmonary arterial pressure tracking in pulmonary hypertension
- PMID: 32974687
- PMCID: PMC7979582
- DOI: 10.1007/s00330-020-07287-6
MR 4D flow-based mean pulmonary arterial pressure tracking in pulmonary hypertension
Abstract
Objectives: Longitudinal hemodynamic follow-up is important in the management of pulmonary hypertension (PH). This study aimed to evaluate the potential of MR 4-dimensional (4D) flow imaging to predict changes in the mean pulmonary arterial pressure (mPAP) during serial investigations.
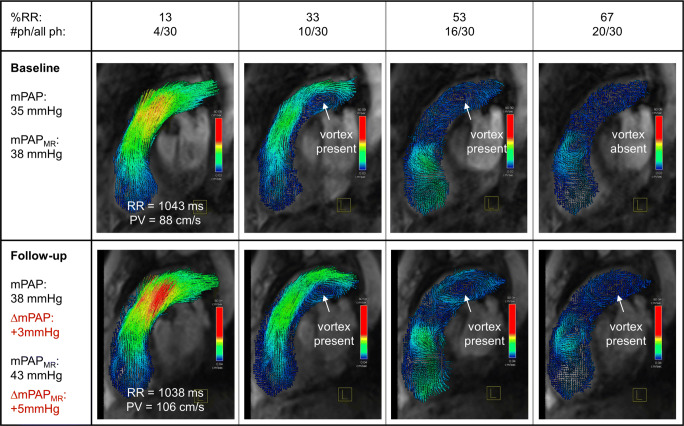
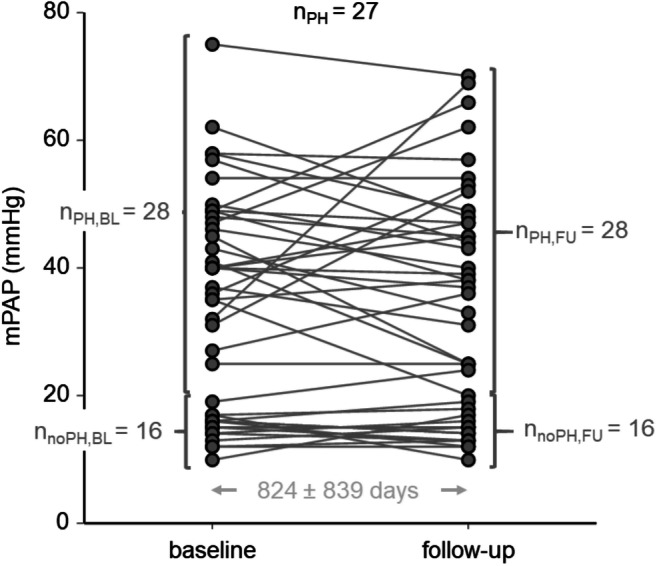
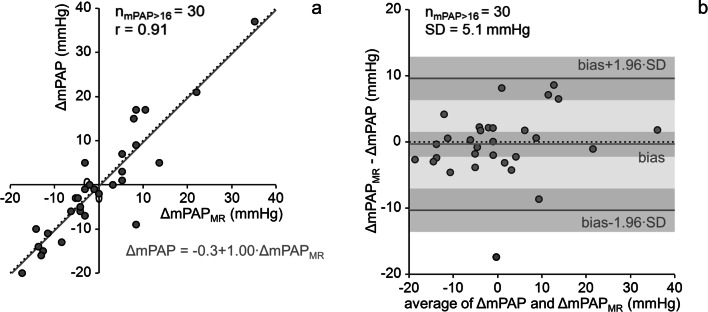
Methods: Forty-four adult patients with PH or at risk of developing PH repeatedly underwent routine right heart catheterization (RHC) and near-term MR 4D flow imaging of the main pulmonary artery. The duration of vortical blood flow along the main pulmonary artery was evaluated from MR 4D velocity fields using prototype software and converted to an MR 4D flow imaging-based mPAP estimate (mPAPMR) by a previously established model. The relationship of differences between RHC-derived baseline and follow-up mPAP values (ΔmPAP) to corresponding differences in mPAPMR (ΔmPAPMR) was analyzed by means of regression and Bland-Altman analysis; the diagnostic performance of ΔmPAPMR in predicting mPAP increases or decreases was investigated by ROC analysis.
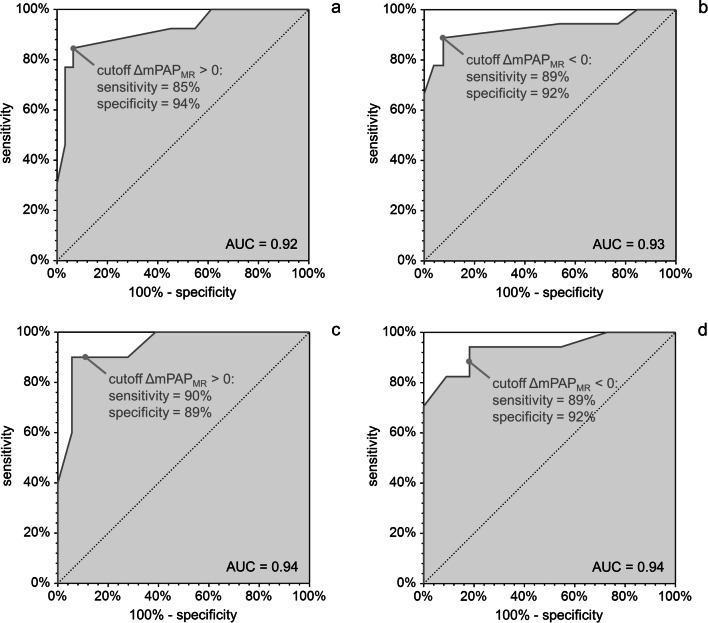
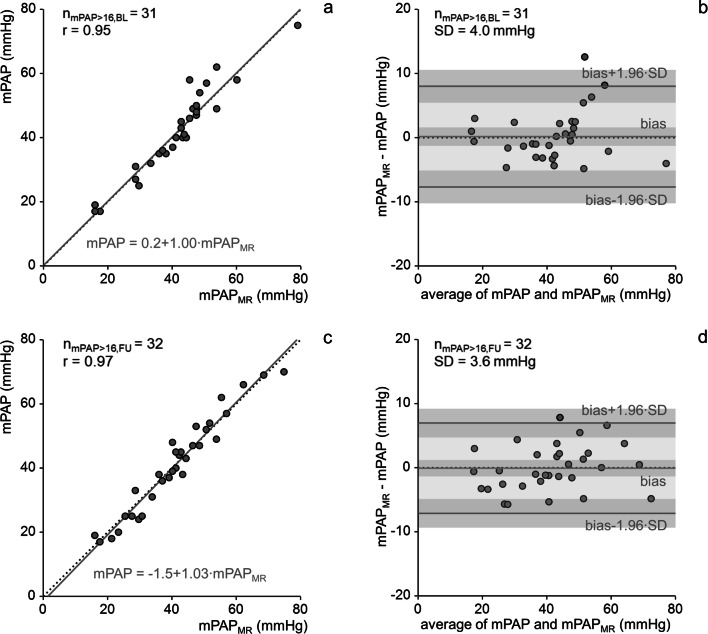
Results: Areas under the curve for the prediction of mPAP increases and decreases were 0.92 and 0.93, respectively. With the natural cutoff ΔmPAPMR = 0 mmHg, mPAP increases (decreases) were predicted with an accuracy, sensitivity, and specificity of 91% (91%), 85% (89%), and 94% (92%), respectively. For patients in whom 4D flow allowed a point estimate of mPAP (mPAP > 16 mmHg), ΔmPAPMR correlated strongly with ΔmPAP (r = 0.91) and estimated ΔmPAP bias-free with a standard deviation of 5.1 mmHg.
Conclusions: MR 4D flow imaging allows accurate non-invasive prediction and quantification of mPAP changes in adult patients with PH or at risk of developing PH.
Trial registration: ClinicalTrials.gov identifier: NCT00575692 and NCT01725763 KEY POINTS: • MR 4D flow imaging allows accurate non-invasive prediction of mean pulmonary arterial pressure increases and decreases in adult patients with or at risk of developing pulmonary hypertension. • In adult patients with mean pulmonary arterial pressure > 16 mmHg, MR 4D flow imaging allows estimation of longitudinal mean pulmonary arterial pressure changes without bias with a standard deviation of 5.1 mmHg.
Keywords: Follow-up studies; Hemodynamics; Magnetic resonance imaging; Pulmonary hypertension.
Conflict of interest statement
The authors of this manuscript declare relationships with the following companies: Gert Reiter is an employee of Siemens Healthcare Diagnostics GmbH, Austria. The study was performed under a Master Research Agreement between the Medical University of Graz, Graz University of Technology, and Siemens Healthcare Diagnostics GmbH.
The other authors of this manuscript declare no relationships with any companies whose products or services may be related to the subject matter of the article.
Figures
References
-
- Galiè N, Humbert M, Vachiery J-L, et al. 2015 ESC/ERS Guidelines for the diagnosis and treatment of pulmonary hypertension: The Joint Task Force for the Diagnosis and Treatment of Pulmonary Hypertension of the European Society of Cardiology (ESC) and the European Respiratory Society (ERS) Endorsed by: Association for European Paediatric and Congenital Cardiology (AEPC), International Society for Heart and Lung Transplantation (ISHLT) Eur Heart J. 2016;37:67–119. doi: 10.1093/eurheartj/ehv317. - DOI - PubMed
-
- Wright LM, Dwyer N, Celermajer D, Kritharides L, Marwick TH (2016) Follow-Up of Pulmonary Hypertension With Echocardiography. JACC Cardiovasc Imaging 9:733–746. 10.1016/j.jcmg.2016.02.022 - PubMed
MeSH terms
Associated data
Grants and funding
LinkOut - more resources
Full Text Sources
Medical
