

Trends in Cardiovascular Disease Prevalence by Income Level in the United States
- PMID: 32975572
- PMCID: PMC7519418
- DOI: 10.1001/jamanetworkopen.2020.18150
Trends in Cardiovascular Disease Prevalence by Income Level in the United States
Abstract
Importance: Income disparity between persons with the most resources (the top 20% of earners) and the remainder of the population in the United States has dramatically widened over the past few decades. Given the well-established association between income and health, this increasing income gap may provide insights into the dynamics of cardiovascular disease (CVD) burden among adults in the US.
Objective: To quantify the contribution of people in the highest-resources group and the remainder of the population to the burden of CVD, and to estimate the trends in the prevalence of CVD for the 2 groups in the United States from 1999 to 2016.
Design, setting, and participants: This serial cross-sectional analysis used nationally representative data from 9 cycles of the National Health and Nutrition Examination Survey (NHANES) between 1999 and 2016. Survey participants were adults 20 years or older. Statistical analysis of the data was conducted in December 2019.
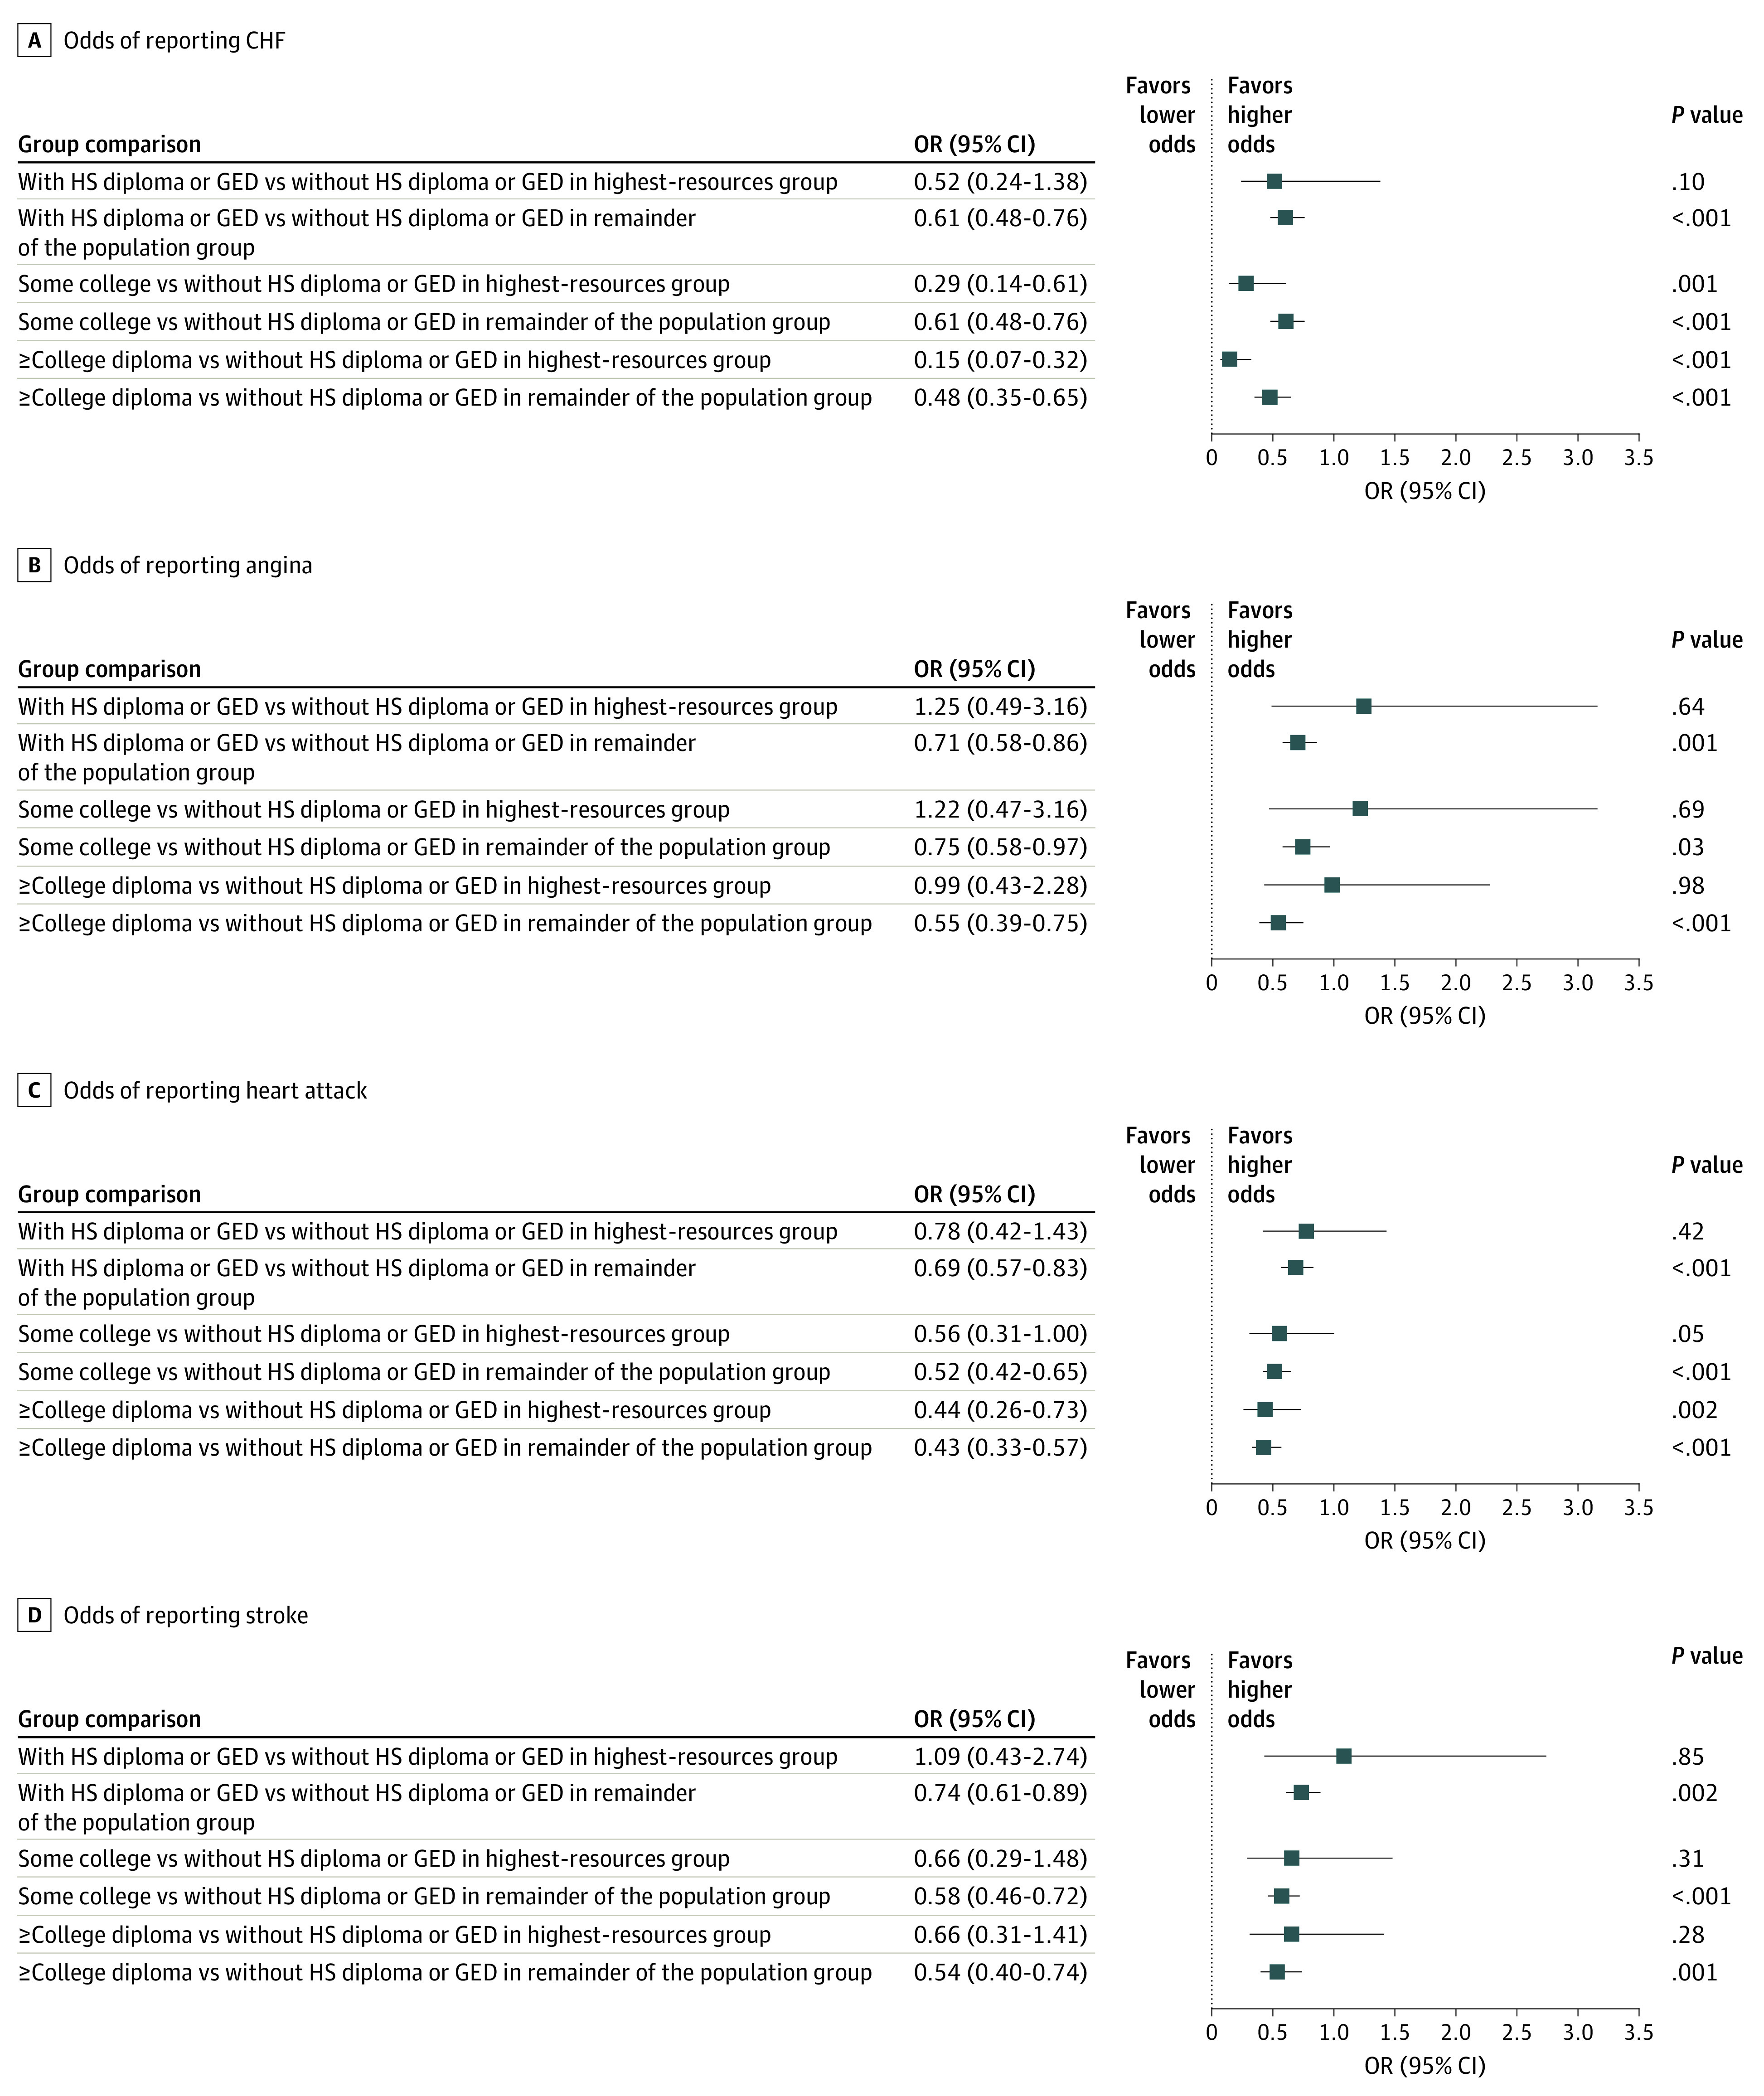
Main outcomes and measures: Age-standardized prevalence of CVD was calculated using the 2010 census estimates. Participants were stratified by income group using the NHANES income to poverty ratio, which was converted into a binary variable: a ratio of 5 or greater for the highest-resources group and a ratio of less than 5 for the remainder of the population.
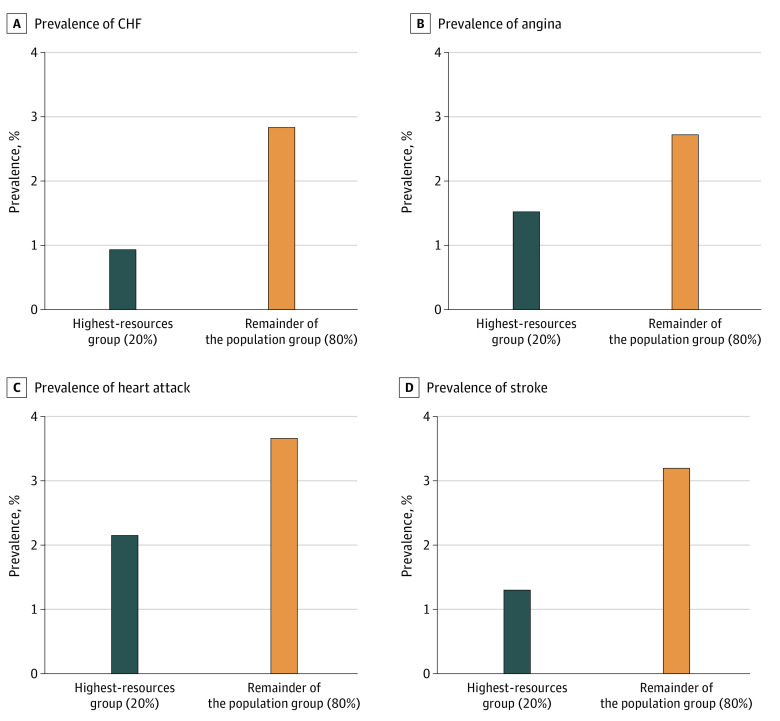
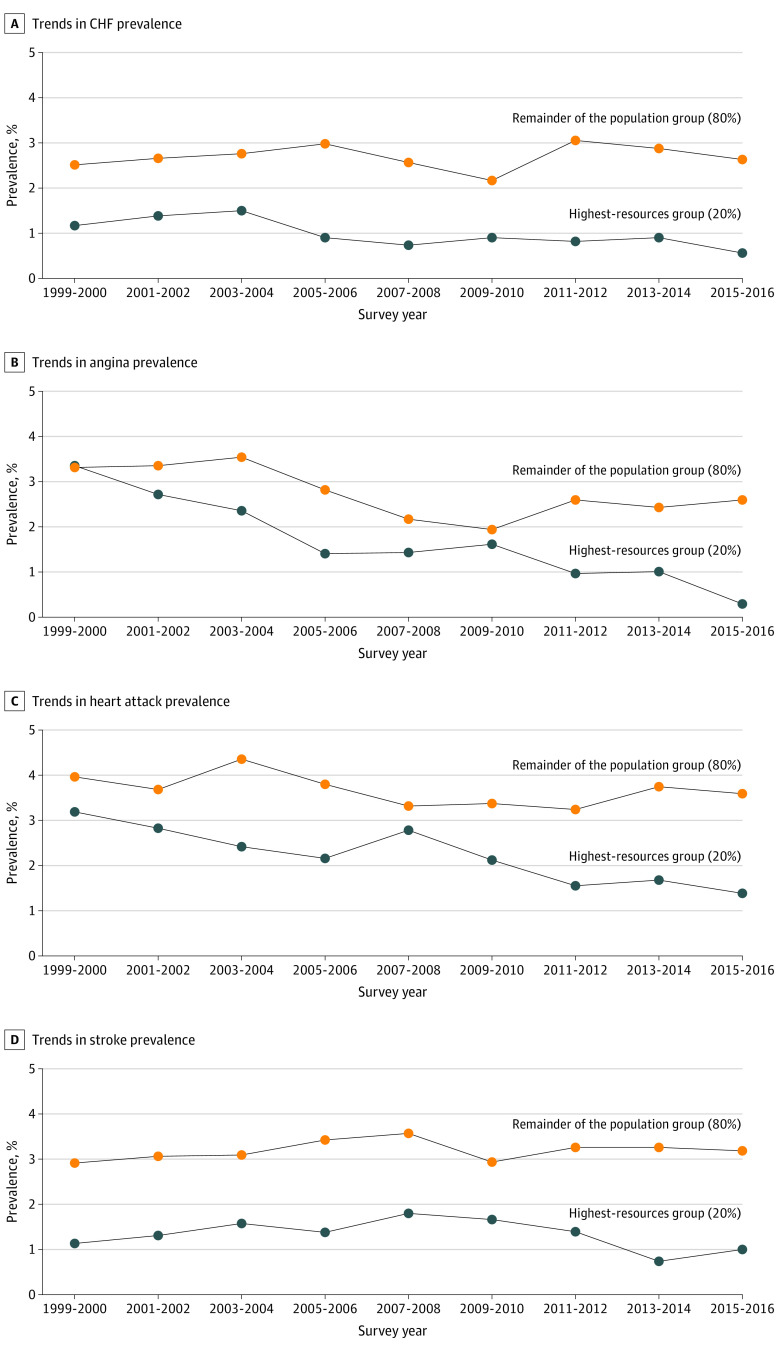
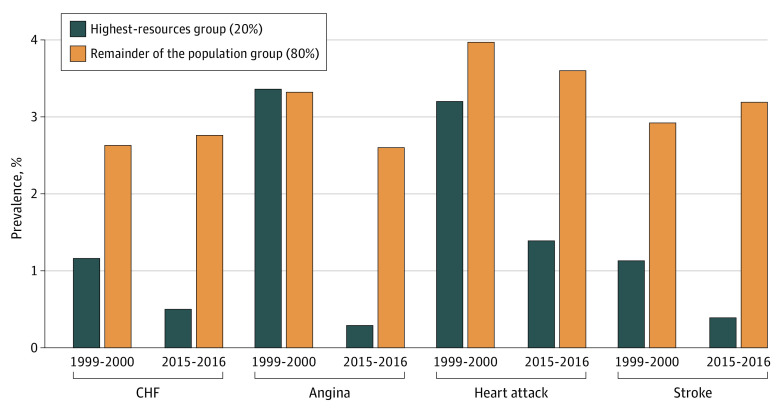
Results: This analysis included 44 986 participants. Among the 7926 participants in the highest-resources group, 3290 (50.3%) were in the 40- to 59-year age group and 4094 (51.9%) were men. Among the 37 060 participants in the remainder of the population, 10 840 (34.1%) were in the 40- to 59-year age group and 19 470 (53.2%) were women. The age-standardized prevalence of CVD decreased in the highest-resources group during the study period (1999-2016): angina from 3.4% (n = 24) to 0.3% (n = 5), heart attack from 3.2% (n = 24) to 1.4% (n = 19), congestive heart failure (CHF) from 1.2% (n = 11) to 0.5% (n = 7), and stroke from 1.1% to 1.0% (n = 8). In the remainder of the population, the prevalence of angina decreased from 3.3% (n = 131) in 1999 to 2.6% (n = 118) in 2016 and heart attack from 4.0% (n = 160) in 1999 to 3.6% (n = 201) in 2016. Conversely, an increase was observed in the prevalence of CHF from 2.6% (n = 123) in 1999 to 2.8% (n = 176) in 2016 and stroke from 2.9% (n = 152) in 1999 to 3.2% (n = 178) in 2016. Over time, the odds of reporting angina (odds ratio [OR], 0.80; 95% CI, 0.73-0.87; P < .001), heart attack (OR, 0.91; 95% CI, 0.86-0.97; P = .003), and CHF (OR, 0.90; 95% CI, 0.82-0.99; P = .03) decreased among those in the highest-resources group, while there was no significant change in the odds of reporting stroke (OR, 0.97; 95% CI, 0.90-1.05; P = .43). Among the remainder of the population, the odds of reporting angina (OR, 0.95; 95% CI, 0.92-0.99; P < .05) and heart attack (OR, 0.99; 95% CI, 0.97-1.02; P = .06) decreased over time. Conversely, there was no statistically significant change in the odds of reporting CHF (OR, 1.02; 95% CI, 1.00-1.05; P = .08) and stroke (OR, 1.02; 95% CI, 0.99-1.04; P = .21).
Conclusions and relevance: This study found substantial and increasing disparities in CVD prevalence between the richest and poorest participants in the NHANES from 1999 to 2016, with lower CVD rate reported among the highest-resources group. Additional research into the dynamics of income inequality and health outcomes as well as policy and public health efforts to mitigate this inequality are needed.
Conflict of interest statement
Figures
References
-
- Saez E. Striking it richer: the evolution of top incomes in the United States (updated with 2017 final estimates). Published March 2, 2019. Accessed January 8, 2020. https://eml.berkeley.edu/~saez/saez-UStopincomes-2017.pdf
-
- Proctor BD, Semega JL, Kollar MA US Census Bureau. Income and poverty in the United States: 2015. Published September 13, 2016. Accessed January 8, 2020. https://www.census.gov/library/publications/2016/demo/p60-256.html
-
- Perry MJ. Explaining US income inequality by household demographics, 2018. update. Published September 11, 2019. Accessed January 15, 2020. https://www.aei.org/carpe-diem/explaining-us-income-inequality-by-househ...
-
- Cristia JP. The empirical relationship between lifetime earnings and mortality: working paper 2007-11. Published August 1, 2007. Accessed January 8, 2020. https://www.cbo.gov/publication/19096
MeSH terms
LinkOut - more resources
Full Text Sources
Medical
Miscellaneous
