

EHMT1 regulates Parvalbumin-positive interneuron development and GABAergic input in sensory cortical areas
- PMID: 32975655
- PMCID: PMC7674571
- DOI: 10.1007/s00429-020-02149-9
EHMT1 regulates Parvalbumin-positive interneuron development and GABAergic input in sensory cortical areas
Abstract
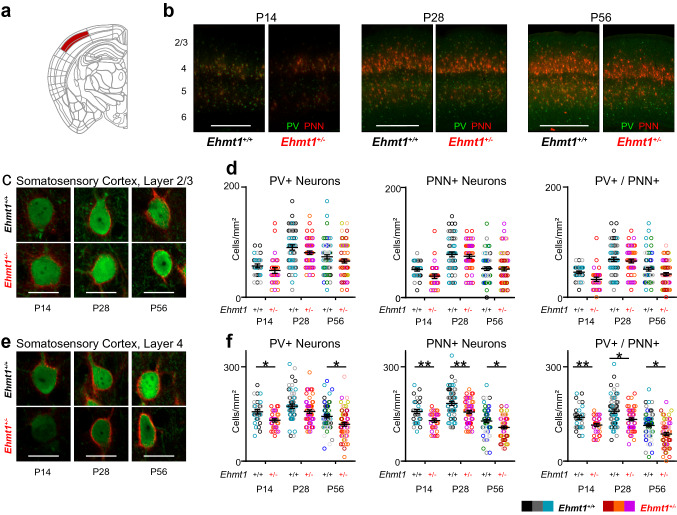
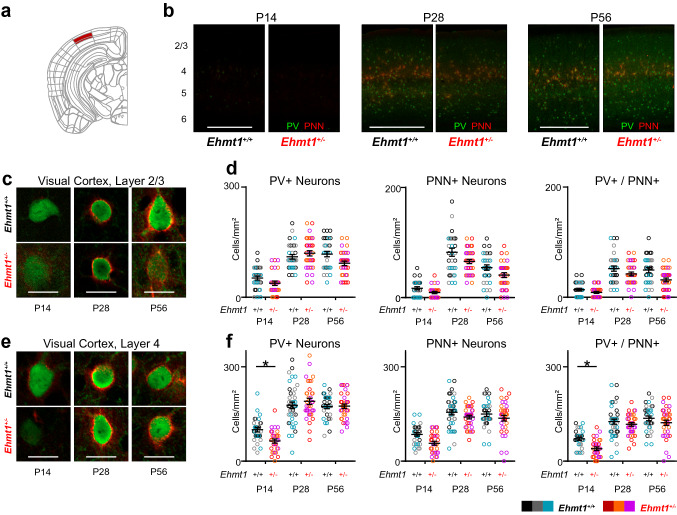
Mutations in the Euchromatic Histone Methyltransferase 1 (EHMT1) gene cause Kleefstra syndrome, a rare form of intellectual disability (ID) with strong autistic traits and sensory processing deficits. Proper development of inhibitory interneurons is crucial for sensory function. Here we report a timeline of Parvalbumin-positive (PV+) interneuron development in the three most important sensory cortical areas in the Ehmt1+/- mouse. We find a hitherto unreported delay of PV+ neuron maturation early in sensory development, with layer- and region-specific variability later in development. The delayed PV+ maturation is also reflected in a delayed maturation of GABAergic transmission in Ehmt1+/- auditory cortex, where we find a reduced GABA release probability specifically in putative PV+ synapses. Together with earlier reports of excitatory impairments in Ehmt1+/- neurons, we propose a shift in excitatory-inhibitory balance towards overexcitability in Ehmt1+/- sensory cortices as a consequence of early deficits in inhibitory maturation.
Keywords: Autism spectrum disorder; Cortical development; Critical period; EHMT1; Gabaergic synapse; Kleefstra syndrome; Parvalbumin-positive interneurons.
Conflict of interest statement
The authors declare no competing financial interests.
Figures


Similar articles
-
p75 Neurotrophin Receptor Activation Regulates the Timing of the Maturation of Cortical Parvalbumin Interneuron Connectivity and Promotes Juvenile-like Plasticity in Adult Visual Cortex.J Neurosci. 2019 Jun 5;39(23):4489-4510. doi: 10.1523/JNEUROSCI.2881-18.2019. Epub 2019 Apr 1. J Neurosci. 2019. PMID: 30936240 Free PMC article.
-
Delayed Maturation of Fast-Spiking Interneurons Is Rectified by Activation of the TrkB Receptor in the Mouse Model of Fragile X Syndrome.J Neurosci. 2017 Nov 22;37(47):11298-11310. doi: 10.1523/JNEUROSCI.2893-16.2017. Epub 2017 Oct 16. J Neurosci. 2017. PMID: 29038238 Free PMC article.
-
Developmental Syngap1 Haploinsufficiency in Medial Ganglionic Eminence-Derived Interneurons Impairs Auditory Cortex Activity, Social Behavior, and Extinction of Fear Memory.J Neurosci. 2024 Dec 4;44(49):e0946242024. doi: 10.1523/JNEUROSCI.0946-24.2024. J Neurosci. 2024. PMID: 39406516 Free PMC article.
-
The Role of Parvalbumin Interneurons in Autism Spectrum Disorder.J Neurosci Res. 2024 Oct;102(10):e25391. doi: 10.1002/jnr.25391. J Neurosci Res. 2024. PMID: 39400385 Review.
-
Interneuron epigenomes during the critical period of cortical plasticity: Implications for schizophrenia.Neurobiol Learn Mem. 2015 Oct;124:104-10. doi: 10.1016/j.nlm.2015.03.005. Epub 2015 Apr 4. Neurobiol Learn Mem. 2015. PMID: 25849095 Free PMC article. Review.
Cited by
-
Auditory processing in rodent models of autism: a systematic review.J Neurodev Disord. 2022 Aug 30;14(1):48. doi: 10.1186/s11689-022-09458-6. J Neurodev Disord. 2022. PMID: 36042393 Free PMC article.
-
Defensive and offensive behaviours in a Kleefstra syndrome mouse model.Anim Cogn. 2023 Jul;26(4):1131-1140. doi: 10.1007/s10071-023-01757-2. Epub 2023 Mar 6. Anim Cogn. 2023. PMID: 36877418 Free PMC article.
-
The emerging role of chromatin remodelers in neurodevelopmental disorders: a developmental perspective.Cell Mol Life Sci. 2021 Mar;78(6):2517-2563. doi: 10.1007/s00018-020-03714-5. Epub 2020 Dec 2. Cell Mol Life Sci. 2021. PMID: 33263776 Free PMC article. Review.
-
Following Excitation/Inhibition Ratio Homeostasis from Synapse to EEG in Monogenetic Neurodevelopmental Disorders.Genes (Basel). 2022 Feb 21;13(2):390. doi: 10.3390/genes13020390. Genes (Basel). 2022. PMID: 35205434 Free PMC article.
-
Early postnatal dysfunction of ACC PV interneurons in Shank3B-/- mice.Mol Psychiatry. 2025 Jul 19. doi: 10.1038/s41380-025-03114-w. Online ahead of print. Mol Psychiatry. 2025. PMID: 40684006
References
-
- Balemans MCM, Ansar M, Oudakker AR, van Caam APM, Bakker B, Vitters EL, et al. Reduced Euchromatin histone methyltransferase 1 causes developmental delay, hypotonia, and cranial abnormalities associated with increased bone gene expression in Kleefstra syndrome mice. Dev Biol. 2014;386:395–407. doi: 10.1016/j.ydbio.2013.12.016. - DOI - PubMed
-
- Balemans MCM, Huibers MMH, Eikelenboom NWD, Kuipers AJ, van Summeren RCJ, Pijpers MMCA, et al. Reduced exploration, increased anxiety, and altered social behavior: Autistic-like features of euchromatin histone methyltransferase 1 heterozygous knockout mice. Behav Brain Res. 2010;208:47–55. doi: 10.1016/j.bbr.2009.11.008. - DOI - PubMed
MeSH terms
Substances
Grants and funding
LinkOut - more resources
Full Text Sources
