. 2020 Sep 25;115(6):62.
doi: 10.1007/s00395-020-00821-z.

Neuraminidase-1 promotes heart failure after ischemia/reperfusion injury by affecting cardiomyocytes and invading monocytes/macrophages

Affiliations

Neuraminidase-1 promotes heart failure after ischemia/reperfusion injury by affecting cardiomyocytes and invading monocytes/macrophages

Maren Heimerl et al. Basic Res Cardiol. .

Abstract

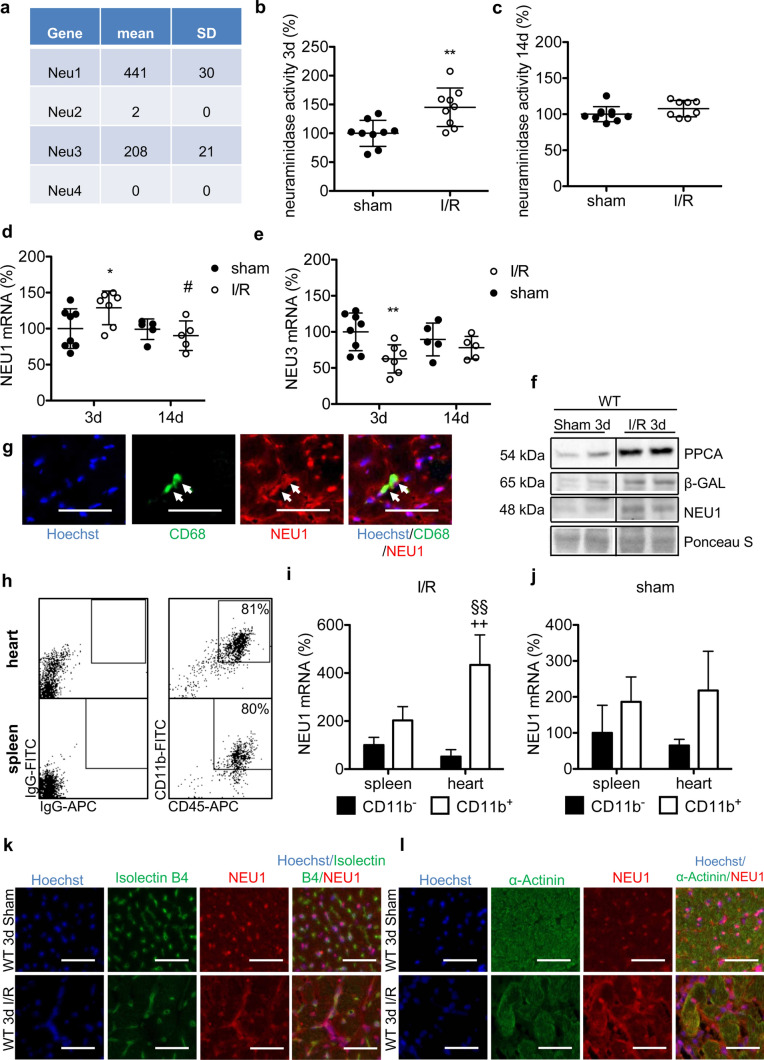
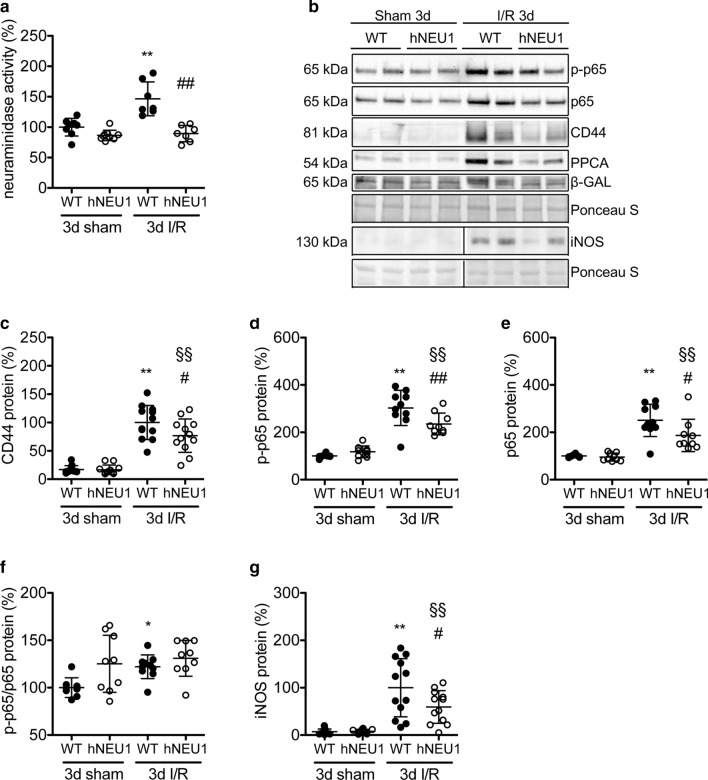
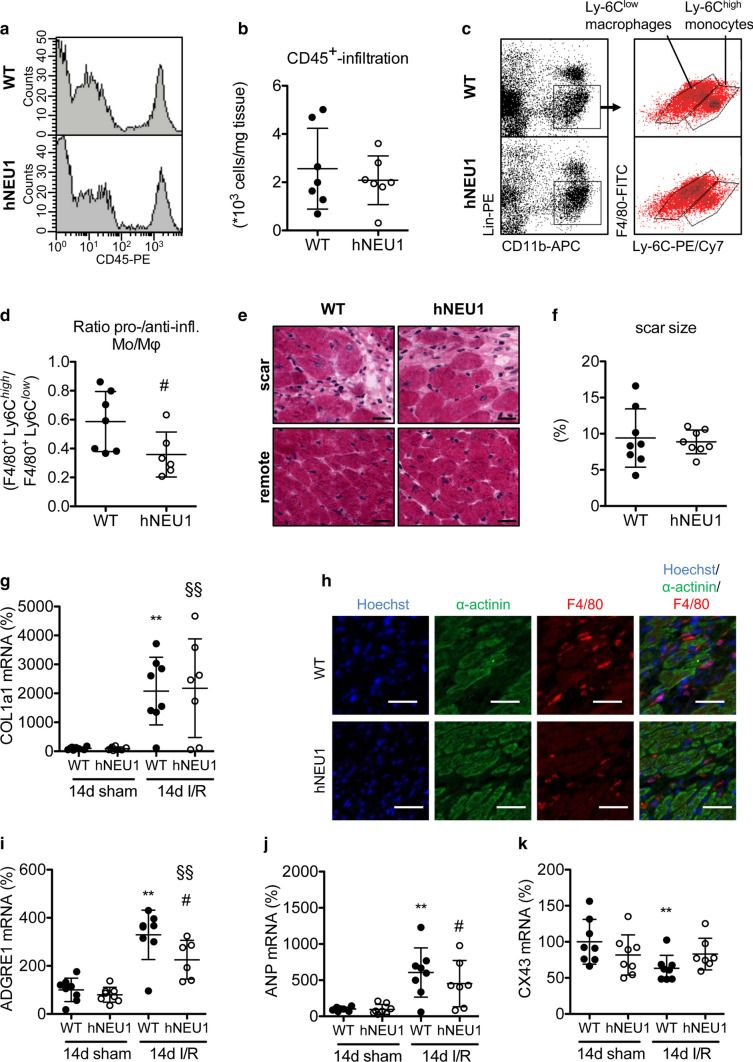
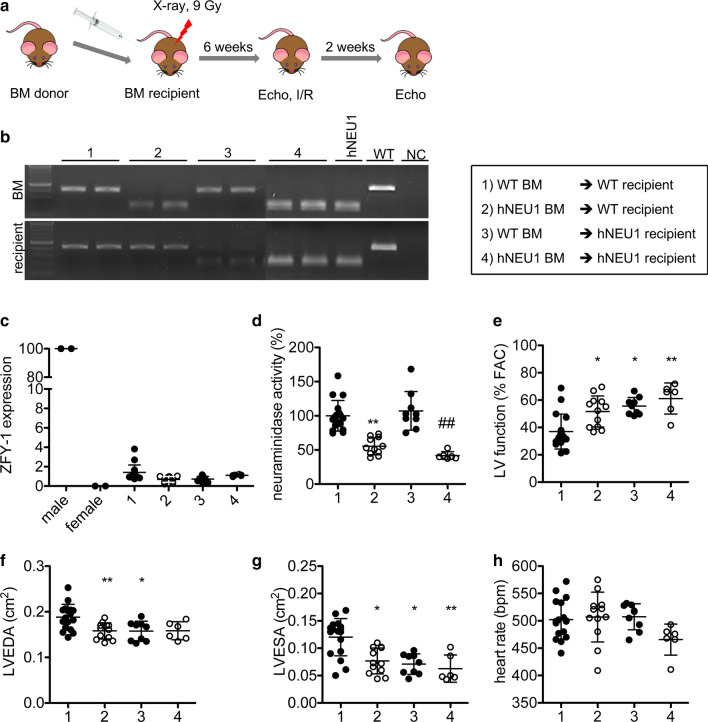
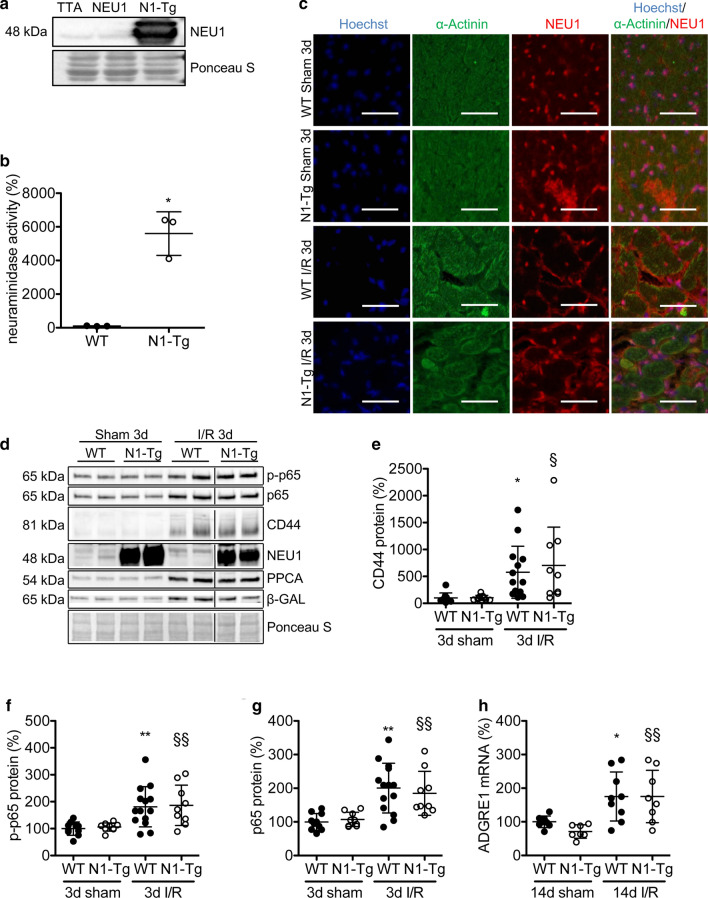
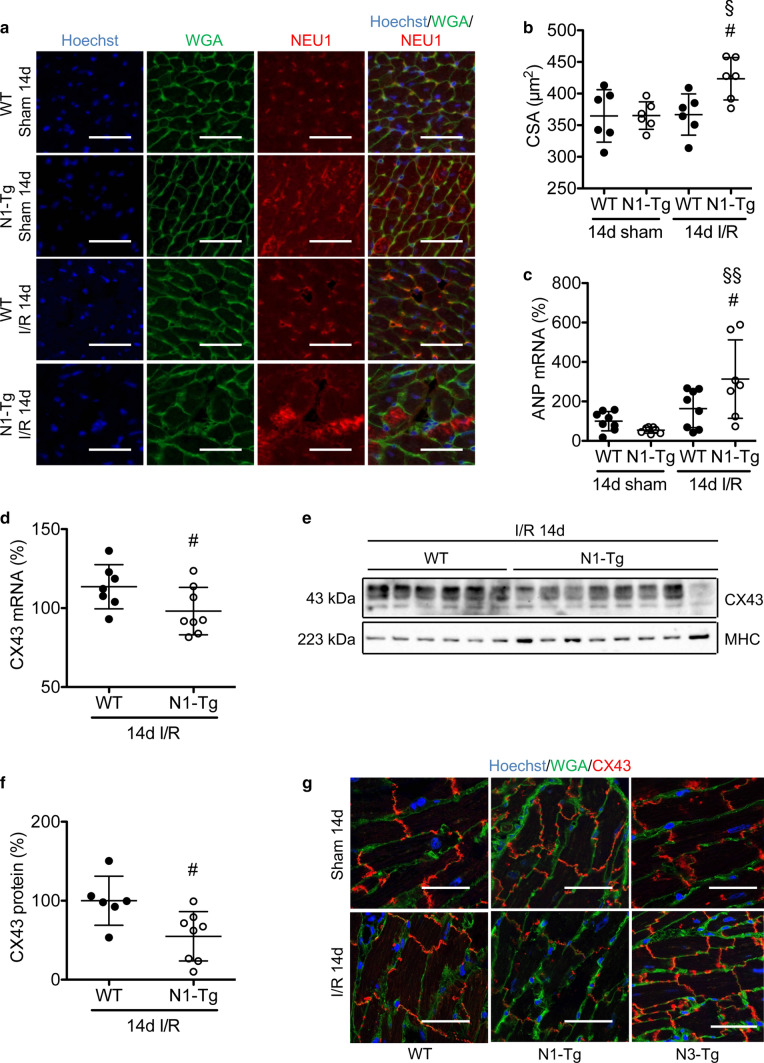
Neuraminidase (NEU)1 forms a multienzyme complex with beta-galactosidase (β-GAL) and protective-protein/cathepsin (PPC) A, which cleaves sialic-acids from cell surface glycoconjugates. We investigated the role of NEU1 in the myocardium after ischemia/reperfusion (I/R). Three days after inducing I/R, left ventricles (LV) of male mice (3 months-old) displayed upregulated neuraminidase activity and increased NEU1, β-GAL and PPCA expression. Mice hypomorphic for neu1 (hNEU1) had less neuraminidase activity, fewer pro-inflammatory (Lin-CD11b+F4/80+Ly-6Chigh), and more anti-inflammatory macrophages (Lin-CD11b+F4/80+Ly-6Clow) 3 days after I/R, and less LV dysfunction 14 days after I/R. WT mice transplanted with hNEU1-bone marrow (BM) and hNEU1 mice with WT-BM showed significantly better LV function 14 days after I/R compared with WT mice with WT-BM. Mice with a cardiomyocyte-specific NEU1 overexpression displayed no difference in inflammation 3 days after I/R, but showed increased cardiomyocyte hypertrophy, reduced expression and mislocalization of Connexin-43 in gap junctions, and LV dysfunction despite a similar infarct scar size to WT mice 14 days after I/R. The upregulation of NEU1 after I/R contributes to heart failure by promoting inflammation in invading monocytes/macrophages, enhancing cardiomyocyte hypertrophy, and impairing gap junction function, suggesting that systemic NEU1 inhibition may reduce heart failure after I/R.

Keywords: Inflammation; Ischemia/reperfusion; Monocytes; Neuraminidase 1; Sialidase 1.


Conflict of interest statement

The authors declare that they have no conflict of interest.

Figures

Fig. 1
Fig. 1
Induced NEU1 expression and activity in the LV after I/R. a Expression of NEU1-4 was analysed by RNAseq in RNA isolated from LV tissue from 3 pools (N = 3–4 per pool) of WT male mice, aged 3 months. Relative neuraminidase activity in ischemic LV of 129S2/SvPasCrl mice b 3 days and c 14 days after I/R, respectively, in comparison with sham-operated controls after normalization to protein content. Sham 3 days N = 9; I/R 3 days N = 9; sham 14 days N = 10; I/R 14 days N = 8. Relative NEU1 (d) and NEU3 (e) mRNA expression in ischemic LV of 129S2/SvPasCrl mice 3 days and 14 days after I/R, respectively, as compared with sham-operated controls after normalization to TPT1. Sham 3 days N = 8; I/R 3  days N = 7; sham 14 days N = 5; I/R 14 days N = 5. f Western blot analysis of NEU1 cofactors PPCA and β-GAL 3 days after I/R compared with sham WT LV. N = 2. g Representative immunostaining of NEU1 (red), CD68 (green) and nuclear Hoechst (blue) staining in WT LV 3 days after I/R. Scale bar: 50 µm. h Representative dot plots of flow cytometric analysis of isolated CD45hiCD11bhi cells from 129S2/SvPasCrl hearts 3 days after I/R. Relative NEU1 mRNA expression in CD11b+ and CD11b cells, respectively, isolated from spleens or hearts of 129S2/SvPasCrl mice 3 days after I/R (i) or sham (j) operation, normalized to 18S. Data in h–j derive from 3 (sham) and 4 (I/R) independent experiments with 4–9 pooled hearts and spleens for each experiment. Representative immunostaining of NEU1 (red) upregulation in the heart 3 days after I/R in different cell types including epithelial cells (Isolectin B4 green) (k) and cardiomyocytes (α-actinin green) (l). Scale bar: 50 µm. All values are depicted as mean ± SD. Statistical analysis was done using Two-Way-ANOVA with Bonferroni post-test (d, e, i, j) and unpaired, two-tailed t test (b, c), respectively. *P < 0.05 and **P < 0.01 vs. sham; #P < 0.05 vs. 3 days; §§P < 0.01 vs. spleen; + +P < 0.01 vs. CD11b
Fig. 2
Fig. 2
Blunted iNOS, p65 and CD44 induction in NEU1-hypomorphic (hNEU1) mice after I/R. a Relative neuraminidase activity in LV of hNEU1 and WT mice 3 days after I/R or sham operation after normalization to protein concentration. WT sham N = 8; hNEU1 sham N = 9; WT I/R N = 7; hNEU1 I/R N = 7. b Representative Western blots and relative quantification (c-g), respectively, of the total (WT sham N = 8; hNEU1 sham N = 9; WT I/R N = 10; hNEU1 I/R N = 9) and phosphorylated (S536) p65 (WT sham N = 8; hNEU1 sham N = 9; WT I/R N = 10; hNEU1 I/R N = 9) and the ratio of phosphorylated to total p65 (WT sham N = 8; hNEU1 sham N = 9; WT I/R N = 10; hNEU1 I/R N = 9), CD44 (WT sham N = 11; hNEU1 sham N = 12; WT I/R N = 12; hNEU1 I/R N = 12) and iNOS (WT sham N = 11; hNEU1 sham N = 12; WT I/R N = 12; hNEU1 I/R N = 12) protein levels in the ischemic LV of hNEU1 and WT mice 3 days after sham or I/R injury normalized to Ponceau loading control. All values are depicted as mean ± SD. Statistical analysis was done using or Two-Way-ANOVA with Bonferroni post-test (a, c–g). *P < 0.05 and **P < 0.01 WT I/R 3 days vs. WT sham 3 days; §§P < 0.01 hNEU1 I/R 3 days vs. hNeu1 sham 3 days; #P < 0.05 hNEU1 I/R 3 days vs. WT I/R 3 days
Fig. 3
Fig. 3
Analysis of infiltrated immune cells and infarct sizes in NEU1-hypomorphic mice after I/R. a, b Representative flow cytometry histograms and quantification of infiltrated CD45+ cells in LV of hNEU1 and WT mice 3 days after I/R. N = 7. c Representative dot plots of flow cytometric analysis of infiltrated pro-inflammatory LinCD11b+F4/80+Ly-6Chigh and anti-inflammatory LinCD11b+F4/80+Ly-6Clow macrophages in LV of hNEU1 and WT mice 3 days after I/R. d Ratio of F4/80+Ly-6Chigh and F4/80+Ly-6Clow macrophages per mouse 3 days after I/R. WT N = 7; hNEU1 N = 6. e Representative images of H&E stained ischemic (scar) and remote LV of hNEU1 and corresponding WT mice 14 days after I/R. Scale bar: 20 µm. f Quantification of scar patches was done by measuring scar area in comparison with the whole LV area in % on 43 and 40 serial slides, respectively. N = 8. g COL1a1 mRNA expression in the ischemic LV of WT and hNEU1 mice 14 days after I/R, normalized to TPT1. WT sham N = 8, hNEU1 sham N = 8; WT I/R N = 8; hNEU1 I/R N = 7. h Representative immunohistochemistry staining of F4/80 (ADGRE1) (red) and α-actinin (green) in ischemic LV of hNEU1 and WT mice 14 days after I/R. Scale bar: 50 µm. i ADGRE1 (WT sham N = 8; hNEU1 sham N = 8; WT I/R N = 8; hNEU1 I/R N = 6) and (j) ANP (WT sham N = 8, hNEU1 sham N = 8; WT I/R N = 7; hNEU1 I/R N = 7) and (k) CX43 (WT sham N = 8, hNEU1 sham N = 8; WT I/R N = 8; hNEU1 I/R N = 7), respectively, mRNA expression in the ischemic LV of WT and hNEU1 mice 14 days after I/R and sham operation, normalized to TPT1. All values are depicted as mean ± SD. Statistical analysis was done using unpaired two-tailed t test with Welch’s correction (b, d, f) and Two-Way-ANOVA with Bonferroni post-test (g, i–k). For panel d: #P < 0.05 hNEU1 I/R 33 daysvs. WT I/R 3 days; for panel f, g, i-k: **P < 0.01 WT I/R 14 days vs. WT sham 14 days; §§P < 0.01 hNEU1 I/R 14 days vs. hNeu1 sham 14 days #P < 0.05 hNEU1 I/R 14 days vs. WT I/R 14 days
Fig. 4
Fig. 4
Bone marrow transplantation experiments reveal the impact of NEU1 in invading haematopoietic cells and in the myocardial tissue on heart function. (a) Experimental setup of BM transplantation experiments between male WT and hNEU1 mice. (b) Representative genotyping of transplanted donor BM and appropriate recipient 14 days after I/R for the 240C→T point mutation [5]. (c) Relative expression of the Zfy-1 gene located on the Y chromosome in explanted female BM cells 14 days after I/R, normalized to Bcl-2. (male N = 2; female N = 2; 1 N = 17; 2 N = 12; 3 N = 9; 4 N = 6). (d) Relative neuraminidase activity (mean of WT BM transplanted in WT mice was set as 100%) in explanted BM cells 14 days after I/R after normalization to protein concentration. (1 N = 17; 2 N = 11; 3 N = 9; 4 N = 6). Arrow indicates the direction of the transplantation of the respective BM cells into the recipient. LV function (e), LVEDA (f), LVESA (g) and heart rate (h) of BM transplanted mice 14 days after I/R injury. 1 N = 17; 2 N = 12; 3 N = 9; 4 N = 6. All values are depicted as mean ± SD. Statistical analysis was done using unpaired two-tailed t test for WT and hNEU1 recipients separately (d) and One-Way-ANOVA with Bonferroni post-test (LVEDA) and Kruskal–Wallis test with Dunn’s post-test (FAC, LVESA, HR), respectively. *P < 0.01 and **P < 0.05 vs. WT-BM → WT recipient (1); #P < 0.05 vs. WT-BM → hNEU1 recipient. NC negative control
Fig. 5
Fig. 5
Cardiomyocyte-specific overexpression of NEU1 does not promote inflammation after I/R. a Representative Western blot shows NEU1 overexpression in the LV of a N1-Tg mouse as compared with WT hearts and Ponceau staining for loading control. b Neuraminidase activity in the LV of N1-Tg and corresponding WT mice. N = 3. c Microscopy of representative immunostaining of cardiomyocyte-specific NEU1 overexpression (red), α-actinin (green) and nuclear Hoechst staining (blue) in LV of N1-Tg and corresponding WT mice 3 days after sham or I/R operation. Scale bar: 50 µm. d Representative Western blot in ischemic LV of N1-Tg and WT mice 3 days after sham or I/R injury. Relative quantification (e–g) of total and phosphorylated (S536) p65 and CD44, respectively, in ischemic LV of N1-Tg and WT mice 3 days after sham or I/R injury normalized to Ponceau loading control. WT sham N = 10; N1-Tg sham N = 9; WT I/R N = 14; N1-Tg I/R N = 9. h ADGRE1 mRNA expression in the ischemic LV of N1-Tg and WT mice 14 days after I/R and sham operation, normalized to 18S. WT sham N = 8; N1-Tg sham N = 7; WT I/R N = 9; N1-Tg I/R N = 8. All values are depicted as mean ± SD. Statistical analysis was done using unpaired, two-tailed t test (b) and Two-Way-ANOVA with Bonferroni post-test (d, f–h). For panel b: *P < 0.5 N1-Tg vs. WT mice, for panel e–g: *P < 0.05 and **P < 0.01 WT I/R 3 days vs. WT sham 3 days, for panel h: *P < 0.05 WT I/R 14 days vs. WT sham 14 days; for panel e–g: §P < 0.05 and §§P < 0.01 N1-Tg I/R 3 days vs. N1-Tg sham 3 days, for panel h: §§P < 0.01 N1-Tg I/R 14 days vs. N1-Tg sham 14 days
Fig. 6
Fig. 6
Cardiomyocyte-specific overexpression of NEU1, but not of NEU3 affects localization of CX43 and triggers cardiomyocyte hypertrophy. a Representative microscopy of immunohistochemical staining for WGA (green), NEU1 (red) and nuclear Hoechst (blue) on LV of N1-Tg and corresponding WT mice 14 days (14d) after sham and I/R injury. Scale bar: 50 μm. b Analysis of the cross-sectional area (CSA) of cardiomyocytes in WT and N1-Tg mice. Quantification was done by measuring the CSA of 29–57 cardiomyocytes per heart (N = 6 in each group). c ANP mRNA expression in the ischemic LV of WT and N1-Tg hearts 14 days after I/R or sham operation, normalized to 18S. WT sham N = 8; N1-Tg sham N = 7; WT I/R N = 8; N1-Tg I/R N = 7. d Relative CX43 mRNA expression in WT and N1-Tg 14 days after I/R normalized to HPRT. WT I/R N = 7; N1-Tg I/R N = 8. e Western blot of CX43 protein expression in N1-Tg and corresponding WT LV 14 days after I/R injury, normalized to MHC and f quantification of CX43 protein levels in the ischemic LV of N1-Tg and WT mice 14 days after I/R injury normalized to heavy chain cardiac myosin (MHC). WT I/R N = 6; N1-Tg I/R N = 8. g Confocal microscopy of immunohistochemical double staining on cryosections for CX43 (red), WGA (green) and nuclear Hoechst staining (blue) of WT, N1-Tg and N3-Tg hearts 14 days after I/R or sham operation. Scale bars: 50 μm. All values are depicted as mean ± SD. Statistical analysis was done using unpaired, two-tailed t test (d, f) and Two-Way-ANOVA with Bonferroni post-test (b, c). #P < 0.05 N1-Tg I/R 14 days vs. WT I/R 14 days; §P < 0.05 and §§P < 0.01 N1-Tg I/R 14 days vs. N1-Tg sham 14 days

Similar articles

Cited by

References

    1. Abdulkhalek S, Szewczuk MR. Neu1 sialidase and matrix metalloproteinase-9 cross-talk regulates nucleic acid-induced endosomal TOLL-like receptor-7 and -9 activation, cellular signaling and pro-inflammatory responses. Cell Signal. 2013;25:2093–2105. doi: 10.1016/j.cellsig.2013.06.010. - DOI - PubMed
    1. Bennett E, Urcan MS, Tinkle SS, Koszowski AG, Levinson SR. Contribution of sialic acid to the voltage dependence of sodium channel gating. A possible electrostatic mechanism. J Gen Physiol. 1997;109:327–343. doi: 10.1085/jgp.109.3.327. - DOI - PMC - PubMed
    1. Bennett ES. Isoform-specific effects of sialic acid on voltage-dependent Na+ channel gating: functional sialic acids are localized to the S5–S6 loop of domain I. J Physiol. 2002;538:675–690. doi: 10.1113/jphysiol.2001.013285. - DOI - PMC - PubMed
    1. Bonten EJ, Campos Y, Zaitsev V, Nourse A, Waddell B, Lewis W, Taylor G, d'Azzo A. Heterodimerization of the sialidase NEU1 with the chaperone protective protein/cathepsin A prevents its premature oligomerization. J Biol Chem. 2009;284:28430–28441. doi: 10.1074/jbc.M109.031419. - DOI - PMC - PubMed
    1. Champigny MJ, Mitchell M, Fox-Robichaud A, Trigatti BL, Igdoura SA. A point mutation in the neu1 promoter recruits an ectopic repressor, Nkx3.2 and results in a mouse model of sialidase deficiency. Mol Genet Metab. 2009;97:43–52. doi: 10.1016/j.ymgme.2009.01.004. - DOI - PubMed

Publication types

MeSH terms