. 2020 Oct 9;48(18):10313-10328.
doi: 10.1093/nar/gkaa785.

Periphilin self-association underpins epigenetic silencing by the HUSH complex

Affiliations

Periphilin self-association underpins epigenetic silencing by the HUSH complex

Daniil M Prigozhin et al. Nucleic Acids Res. .

Abstract

Transcription of integrated DNA from viruses or transposable elements is tightly regulated to prevent pathogenesis. The Human Silencing Hub (HUSH), composed of Periphilin, TASOR and MPP8, silences transcriptionally active viral and endogenous transgenes. HUSH recruits effectors that alter the epigenetic landscape and chromatin structure, but how HUSH recognizes target loci and represses their expression remains unclear. We identify the physicochemical properties of Periphilin necessary for HUSH assembly and silencing. A disordered N-terminal domain (NTD) and structured C-terminal domain are essential for silencing. A crystal structure of the Periphilin-TASOR minimal core complex shows Periphilin forms an α-helical homodimer, bound by a single TASOR molecule. The NTD forms insoluble aggregates through an arginine/tyrosine-rich sequence reminiscent of low-complexity regions from self-associating RNA-binding proteins. Residues required for TASOR binding and aggregation were required for HUSH-dependent silencing and genome-wide deposition of repressive mark H3K9me3. The NTD was functionally complemented by low-complexity regions from certain RNA-binding proteins and proteins that form condensates or fibrils. Our work suggests the associative properties of Periphilin promote HUSH aggregation at target loci.


Figures

Figure 1.
Figure 1.
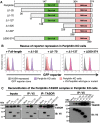
Both N- and C-terminal regions of Periphilin are required for HUSH function but only the C-terminal region is required for HUSH complex formation. (A) Schematic representation of Periphilin constructs used for complementation assay. All variants were expressed with an N-terminal V5 tag. (B) Repression of a lentiviral GFP reporter in Periphilin KO cells complemented with full-length Periphilin or truncation mutants (data shown 7 days post-transduction). The Δ1–127 and Δ350–374 variants fail to rescue reporter repression. (C) Pulldown assays with Periphilin and TASOR, the largest HUSH component. Periphilin and TASOR were immunoprecipitated (IP) from Periphilin KO cells complemented with Periphilin deletion mutants on Protein A/G resin decorated with anti-V5 or anti-TASOR primary antibody, respectively. TASOR and Periphilin proteins bound to the resin were quantified by Western immunoblot (IB). Only the C-terminal Periphilin deletion (Δ350–374) abolished TASOR binding. The V5 tag was used to detect Periphilin.
Figure 2.
Figure 2.
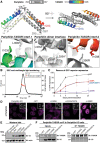
Periphilin and TASOR form a 2:1 complex required for HUSH function. (A) Crystal structure of the minimal Periphilin–TASOR core complex. The Periphilin fragment (residues 292–367, light/dark grey) forms a homodimer of helical hairpins. The TASOR fragment (residues 1014–1095, rainbow colors) wraps around the Periphilin dimer, adding an α-helix to each Periphilin hairpin to form two helical coiled coils. Insets show close-up views of the Periphilin-TASOR interfaces (‘i’, ‘iii’) and the Periphilin dimer interface (‘ii’). Residues forming key contacts and mutations designed to disrupt Periphilin-TASOR complex formation are labeled. (B) SEC-MALS of minimal Periphilin-TASOR core complex. The molecular weight calculated from light scattering data is consistent with a 2:1 complex in solution. (C) Repression of a lentiviral GFP reporter in Periphilin KO cells complemented with Periphilin mutants designed to inhibit Periphilin-TASOR complex assembly. Reporter expression was monitored over 21 days by flow cytometry. The log10(GFP fluorescence) data for live cells were converted to percent repression activity with WT HeLa reporter cells set at 100% and Periphilin KO cells set a 0% repression (see Materials and Methods). (D) Immunofluorescence microscopy of Periphilin KO cells transduced with Periphilin mutants affecting Periphilin–TASOR complex assembly. Cells were fixed 4 days post-transduction and stained with anti-Periphilin antibody (magenta) and DAPI (grey, insets). Scale bar, 10 μm. (E) Western immunoblot of Periphilin KO cells (whole cell lysate, 1% SDS) transduced with the three mutants shown in (C). The V5 tag was used for detection of Periphilin 7 days after transduction. Comparison with the actin loading control (lower panel) shows the mutants are expressed at higher levels than wild-type. (F) Pulldown assay with TASOR and the Periphilin mutants shown in (C). TASOR was immunoprecipitated (IP) from Periphilin KO cells (14 000 g cell lysate supernatant, 1% NP-40) complemented with V5-tagged Periphilin mutants on resin decorated with anti-TASOR antibody. TASOR and Periphilin proteins bound to the resin were quantified by Western immunoblot (IB), using the V5 tag to detect Periphilin. All three mutations abolished TASOR binding despite being more abundant than wild-type in the cell lysate supernatants.
Figure 3.
Figure 3.
The NTD of Periphilin required for HUSH function contains partially-redundant sequences predicted to be unstructured. (A) Predicted structural disorder, charge and hydropathy of Periphilin calculated with localCIDER (27). (B) Repression of a lentiviral GFP reporter in Periphilin KO cells complemented with Periphilin variants containing deletions in the NTD. Repression activity is calculated as in Figure 2C. The WT curve (dotted line) is shared with contemporaneous experiments reported in Figure 2C. (C) Western blot of Periphilin KO cells transduced with the Periphilin N-terminal deletion variants, using the V5 tag for detection 7 days after transduction. The three mutants are expressed at similar levels.
Figure 4.
Figure 4.
Genome-wide analysis of H3K9me3 distribution in cells expressing wild-type and functionally deficient variants of Periphilin. (A) Genome browser snapshot of H3K9me3 distribution in the presence of different Periphilin variants. H3K9me3 distribution is shown at the ZNF594 locus, shown previously to be transcriptionally repressed by HUSH (11). Other representative snapshots are shown in Supplementary Figure S3. An H3K9me3 track from parent HeLa cells (Control) and a track with a non-cognate IgG are shown in grey as positive and negative controls, respectively (17). The Periphilin-complemented tracks are in purple. All experiments were run in duplicate with similar results. RPM, scaled reads per million. (B) Heatmap showing CUT&RUN signal enrichment (normalized signal from complementing Periphilin construct minus normalized signal from Periphilin KO) over the 393 TASOR-regulated H3K9me3 peaks in the genome (17), centered on each peak, with a ±30 kb window. Both replicates are shown for WT, L356R and Δ1–127 Periphilin variants. The mean binned signal is shown above each heatmap. H3K9me3 is lost specifically over HUSH-regulated peaks, but is unaffected in HUSH-independent peaks (see Supplementary Figure S3C).
Figure 5.
Figure 5.
Physicochemical properties of the Periphilin NTD and contribution of enriched residues to HUSH activity. (A) Amino acid sequence of Periphilin-1 isoform 2 (UniProt Q8NEY8-2). Background shading color code: yellow, NTD; pink, Ser-rich region; blue, crystallized TASOR-binding region, with positions of the α-helices indicated. Candidate phosphorylation sites are labeled (P, black circles). Residues mutated in this study are underlined and in bold typeface. (B) Solubility of wild-type and terminal-deletion variants of Periphilin expressed in E. coli. The presence of HUSH-dependent silencing activity is indicated for each variant (see Figure 3B). (C) Solubility of WT and Δ1-127 Periphilin variants, measured as absorbance at 400 nm (A400) due to light scattering, as a function of urea concentration in the buffer. Representative of two independent experiments. (D) Differential interference contrast (DIC) microscopy of WT and Δ1-127 Periphilin variants (4 μM) in buffer containing 0.5 M urea. Scale bar, 10 μm. (E) Repression of a lentiviral GFP reporter in Periphilin KO cells complemented with Periphilin variants with all Asp/Glu, Arg or Tyr in the NTD mutated to Asn/Gln, NTD(DE>NQ); Lys NTD(R>K); or Ser NTD(Y>S), respectively. Repression activity is calculated as above. The WT curve (dotted line) is shared with contemporaneous experiments reported in Figure 2C. (F) Western blot against the V5 tag on Periphilin variants NTD(DE>NQ), NTD(Y>S) or NTD(R>K) 7 days after transduction into Periphilin KO cells. The NTD(DE>NQ) and NTD(R>K) variants are expressed at lower levels than wild-type.
Figure 6.
Figure 6.
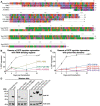
Complementation of NTD deletion with disordered regions from RNA-binding or prion-forming polypeptides partially rescues HUSH function. (A) Sequences used in this study to functionally complement the NTD of Periphilin in the Δ1-127 variant: YBX3, human Y-box-binding protein 3 residues 151–268, UniProt P16989-1; SUP35, Saccharomyces cerevisiae SUP35 prion domain, UniProt P05453 residues 5–135; FUS-RBD, human Fused in Sarcoma disordered RNA-binding region, UniProt P35637 residues 454–526; FUS-PLD, human Fused in Sarcoma prion-like low complexity domain, UniProt P35637 residues 2–214; ALYREF2, mouse Aly/RNA export factor 2 residues 17–67, UniProt Q9JJW6.1. (B and C) Repression of a lentiviral GFP reporter in Periphilin KO cells complemented with Periphilin variants with the NTD (residues 1–127) replaced by: (B) the disordered RNA-binding regions from ALYREF2, YBX3 or FUS; (C) the prion-like domain from FUS or the prion domain of SUP35, wild-type or with all tyrosine residues mutated to serine (Y>S). Residue ranges and sequence accession numbers are listed in (A). Repression activity is calculated as above. The WT curve in (C) is shared with contemporaneous experiments reported in Figure 2C and is shown here as a dotted line. The WT curve in (B) is part of a separate experiment and is represented as a solid line. (D) Western blot of Periphilin KO cells transduced with the Periphilin variants shown in (B) and (C). The variants were detected using their V5 tag 7 days post-transduction.

References

    1. Friedli M., Trono D.. The developmental control of transposable elements and the evolution of higher species. Annu. Rev. Cell Dev. Biol. 2015; 31:429–451. - PubMed
    1. Chuong E.B., Elde N.C., Feschotte C.. Regulatory evolution of innate immunity through co-option of endogenous retroviruses. Science. 2016; 351:1083–1087. - PMC - PubMed
    1. Zhou L., Mitra R., Atkinson P.W., Hickman A.B., Dyda F., Craig N.L.. Transposition of hAT elements links transposable elements and V(D)J recombination. Nature. 2004; 432:995–1001. - PubMed
    1. Dupressoir A., Lavialle C., Heidmann T.. From ancestral infectious retroviruses to bona fide cellular genes: role of the captured syncytins in placentation. Placenta. 2012; 33:663–671. - PubMed
    1. Goodier J.L. Restricting retrotransposons: a review. Mob. DNA. 2016; 7:16. - PMC - PubMed

Publication types

MeSH terms