. 2020 Nov 3;32(5):786-800.e7.
doi: 10.1016/j.cmet.2020.08.017. Epub 2020 Sep 24.

Insulin and Leptin/Upd2 Exert Opposing Influences on Synapse Number in Fat-Sensing Neurons

Affiliations

Insulin and Leptin/Upd2 Exert Opposing Influences on Synapse Number in Fat-Sensing Neurons

Ava E Brent et al. Cell Metab. .

Abstract

Energy-sensing neural circuits decide to expend or conserve resources based, in part, on the tonic, steady-state, energy-store information they receive. Tonic signals, in the form of adipose tissue-derived adipokines, set the baseline level of activity in the energy-sensing neurons, thereby providing context for interpretation of additional inputs. However, the mechanism by which tonic adipokine information establishes steady-state neuronal function has heretofore been unclear. We show here that under conditions of nutrient surplus, Upd2, a Drosophila leptin ortholog, regulates actin-based synapse reorganization to reduce bouton number in an inhibitory circuit, thus establishing a neural tone that is permissive for insulin release. Unexpectedly, we found that insulin feeds back on these same inhibitory neurons to conversely increase bouton number, resulting in maintenance of negative tone. Our results point to a mechanism by which two surplus-sensing hormonal systems, Upd2/leptin and insulin, converge on a neuronal circuit with opposing outcomes to establish energy-store-dependent neuron activity.

Keywords: Drosophila; JAK-STAT; Upd2; actin; arouser; basigin; energy homeostasis; gelsolin; inhibitory tone; insulin; leptin.


Conflict of interest statement

Declaration of Interests The authors declare no competing interests.

Figures

Figure 1.
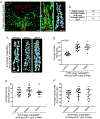
Figure 1.. STAT is expressed in a population of PI GABA neurons that regulate systemic fat storage and Insulin release.
(A) Analysis of STAT expression in adult brain (STAT-Gal4>UAS-dsRed). Left panels: whole brain view. Yellow arrow indicates PI-STAT somas; yellow bracket, PI-STAT arborizations. Additional expression seen in a bilateral domain (blue arrows), olfactory bulbs (magenta arrow), and SEZ (green arrow). IPCs labeled with α-Dilp2. Middle and right panels in, respectively, the XY and YZ planes, are at higher magnification. Scale bars: 50μm (left panels) and 20μm (middle and right panels). (B, C) TAG analysis of indicated genotypes. (D) Dilp5 immunostaining in IPCs following activation of STAT-expressing neurons with TrpA1, with or without Gad1-Gal80. Quantification of mean Dilp5 fluorescence indicated on the right: n=8 brains per genotype. Scale bar, 10μm. (E, F) TAG analysis of indicated genotypes. Statistical significance calculated by t-test. Error bars represent %SD. For all TAG experiments, 4 replicates of 3 flies each were analyzed.
Figure 2.
Figure 2.. PI-STAT neurons are in synaptic contact with the IPCs.
(A) GRASP detection in PI region of adult brain. STAT neurons identified with α-GFP antibody that recognizes spGFP1–10 (first panel); IPCs identified with IHC for Dilp5 (second panel). Points of contact (arrows, merged image) revealed by α-GFP specific to reconstituted GFP (third panel). Scale bar, 10μm. (B) Expression of Syt-GFP via STAT-Gal4 in adult brain at low magnification (upper panels) or high magnification (bottom panels, indicated by yellow dashed rectangle). Arrows point to Dilp5-labelled IPC tracts. Scale bars, 20μm (upper panels) and 10μm (lower panels). (C) Side view of Syt-GFP expression in PI-STAT neurons (YZ plane) showing contact with Dilp5-expressing projections arising from IPC tracts (middle panel). Scale bar, 10μm. (D) Visualization of Dilp2-Gal4 driving expression of UAS-DenMark in IPCs at low (left) or high (middle, XY; right, YZ) magnification. Scale bars, 20μm (left panel) and 10μm (middle and right panels). (E) STAT-Gal4-driven expression of Syt-GFP in PI-STAT neurons is eliminated by Gad1-Gal80 (arrow). Scale bar, 10μm.
Figure 3.
Figure 3.. Assessment of tonic neuronal activity by segmentation analysis of presynaptic bouton number.
(A) STAT-Gal4-driven expression of Syt-GFP in PI-STAT neurons. IPCs marked by IHC with Dilp5. Box in left panel indicates region of interest seen in middle panel. Right panel shows result of segmentation analysis. Scale bars, 10μm (left) and 5μm (middle and right). (B) Segmentation analysis of PI-STAT neuron boutons in (A). (C) Segmentation analysis of Syt-GFP boutons in PI-STAT neurons of indicated genotypes. Scale bar, 5μm. (D-F) Average number (D), volume (E), and surface area (F) of segmented PI-STAT Syt-GFP boutons following knock-down with indicated RNAi. Each point represents average bouton number, volume, or surface area from a single brain. Between 12–15 brains were analyzed per genotype. For segmentation analysis, statistical significance calculated by 1-way ANOVA on indicated number of individuals. Error bars represent SEM.
Figure 4.
Figure 4.. Arouser functions downstream of STAT to regulate tonic activity in the PI-STAT neurons.
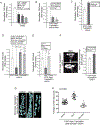
(A-E) TAG analysis of indicated genotypes. 4 replicates of 3 flies each were analyzed. (F) IHC for Dilp5 in IPCs of adult brains of indicated genotypes. Mean Dilp5 fluorescence quantified on the right: n=15 brains per genotype. Scale bar, 10μm. (G) Segmentation analysis of Syt-GFP boutons in PI-STAT neurons of indicated genotypes. Scale bar, 5μm. (H) Quantification of average number of segmented PI-STAT Syt-GFP boutons in indicated genotypes. Between 10–23 brains analyzed per genotype. For TAG assays and Dilp accumulation, statistical significance calculated by t-test on indicated number of individuals. Error bars represent %SD. For segmentation analysis, statistical significance calculated by 1-way ANOVA on indicated number of individuals. Error bars represent SEM.
Figure 5.
Figure 5.. Aru, Bsg, and Gel regulate PI-STAT neuron bouton number through regulation of the actin cytoskeleton.
(A) TAG analysis for indicated genotypes; n=4 replicates of 3 flies each. (B) Segmentation analysis of Syt-GFP boutons in PI-STAT neurons of indicated genotypes. Scale bar, 5μm. (C) Quantification of average number of PI-STAT Syt-GFP boutons in indicated genotypes. Between 10–11 brains analyzed per genotype. (D) Left panel, Moesin-GFP expression in PI-STAT neurons, driven by STAT-Gal4. Right panels, expression of Syt-GFP and F-Tractin-tdTom in boutons of PI-STAT neurons, via STAT-Gal4. Scale bar, 5μm. (E) Moesin-GFP expression in adult brain PI-STAT neurons of indicated genotypes. Scale bar, 5μm. (F) Segmentation analysis of Syt-GFP boutons in PI-STAT neurons of indicated genotypes. Scale bar, 5μm. (G) Quantification of average number of PI-STAT Syt-GFP boutons in indicated genotypes. Between 14–16 brains analyzed per genotype. (H) TAG analysis of indicated genotypes; n=4 replicates of 3 flies each. For TAG assays, statistical significance calculated by t-test on indicated number of individuals. Error bars represent %SD. For segmentation analysis, statistical significance calculated by 1-way ANOVA on indicated number of individuals. Error bars represent SEM.
Figure 6.
Figure 6.. PI-STAT neuron bouton number adjusts in response to high sugar diet.
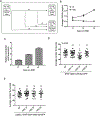
(A) Time-line for HSD exposure. (B) Average TAG/fly in adult flies exposed to NF or HSD (n=4 replicates of 3 flies each). (C) qPCR analysis of normalized upd2 transcripts in adult flies exposed to NF or HSD. (D, E) Average number of Syt-GFP boutons in PI-STAT neurons of flies exposed to NF or HSD timepoints in (D) control background and Upd2Δ (E). Between 22–25 brains analyzed per condition. For TAG assays and qPCR, statistical significance calculated by t-test on indicated number of individuals. Error bars represent %SD. For segmentation analysis, statistical significance calculated by 1-way ANOVA on indicated number of individuals. Error bars represent SEM.
Figure 7.
Figure 7.. Insulin signaling promotes inhibitory contacts between PI-STAT neurons and IPCs.
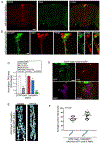
(A) InR-Gal4-driven expression of dsRed marks population of InR-expressing neurons in PI region. IPCs marked by IHC for Dilp2 (pink arrow: Dilp2-expressing neurons; yellow arrow: non-Dilp2-expressing neurons. Scale bar, 50 μm. (B) Syt-GFP in InR-expressing PI neurons (arrows) (InR-Gal4>UAS-Syt-GFP). First three panels are XY plane, last three are YZ plane. Scale bars, 10μm (XY views) and 5μm (YZ view). (C) TAG analysis performed on indicated genotypes; n=4 replicates of 3 flies each. (D) IHC for InR in td-GFP-expressing PI-STAT neurons (arrows). IPCs labelled via IHC for Dilp2. Scale bar, 10μm. (E) Segmentation analysis of Syt-GFP boutons in PI-STAT neurons of indicated genotypes. Scale bar, 5μm. (F) Quantification of average number of PI-STAT Syt-GFP puncta in (E). Between 13–14 brains analyzed per genotype. For TAG assays, statistical significance calculated by t-test on indicated number of individuals. Error bars represent %SD. For segmentation analysis, statistical significance calculated by 1-way ANOVA on indicated number of individuals. Error bars represent SEM.

Similar articles

Cited by

References

    1. Ahima RS, Prabakaran D, Mantzoros C, Qu D, Lowell B, Maratos-Flier E, and Flier JS (1996). Role of leptin in the neuroendocrine response to fasting. Nature 382, 250–252. - PubMed
    1. Baker KD, and Thummel CS (2007). Diabetic larvae and obese flies-emerging studies of metabolism in Drosophila. Cell Metab 6, 257–266. - PMC - PubMed
    1. Banks WA (2004). The many lives of leptin. Peptides 25, 331–338. - PubMed
    1. Baver SB, Hope K, Guyot S, Bjorbaek C, Kaczorowski C, and O’Connell KM (2014). Leptin modulates the intrinsic excitability of AgRP/NPY neurons in the arcuate nucleus of the hypothalamus. J Neurosci 34, 5486–5496. - PMC - PubMed
    1. Beshel J, Dubnau J, and Zhong Y (2017). A Leptin Analog Locally Produced in the Brain Acts via a Conserved Neural Circuit to Modulate Obesity-Linked Behaviors in Drosophila. Cell Metab 25, 208–217. - PMC - PubMed

Publication types