. 2020 Oct 13;15(4):855-868.
doi: 10.1016/j.stemcr.2020.08.017. Epub 2020 Sep 24.

Electrophysiological Maturation of Cerebral Organoids Correlates with Dynamic Morphological and Cellular Development

Affiliations

Electrophysiological Maturation of Cerebral Organoids Correlates with Dynamic Morphological and Cellular Development

Summer R Fair et al. Stem Cell Reports. .

Abstract

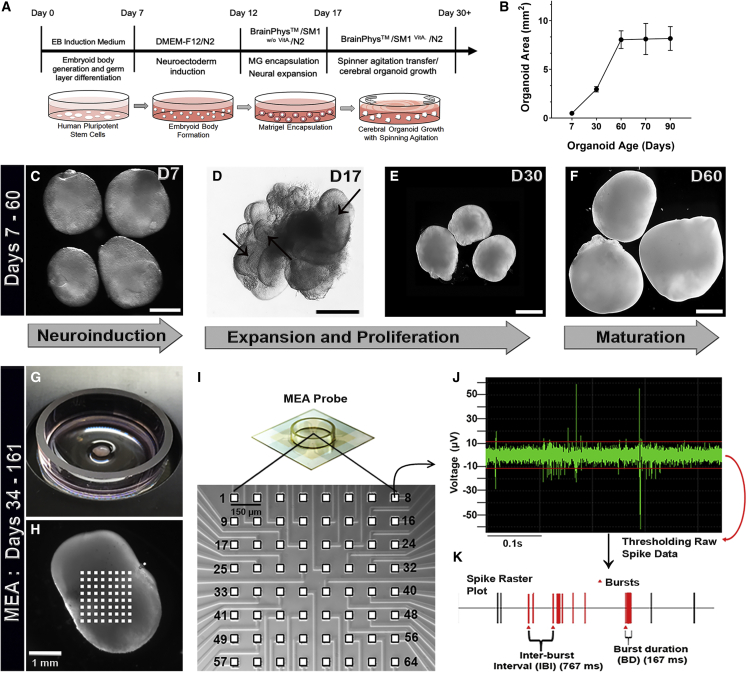
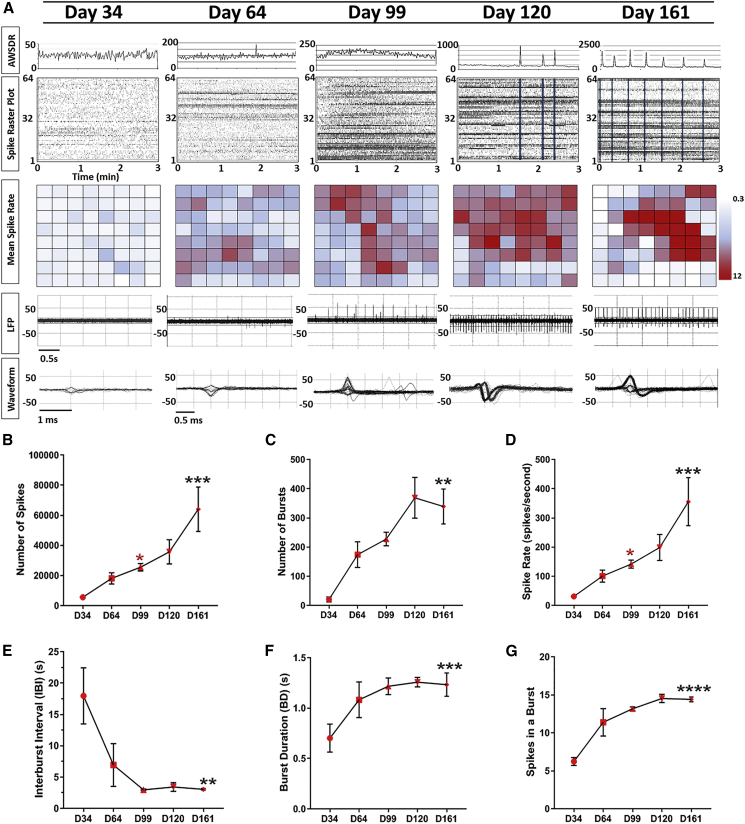
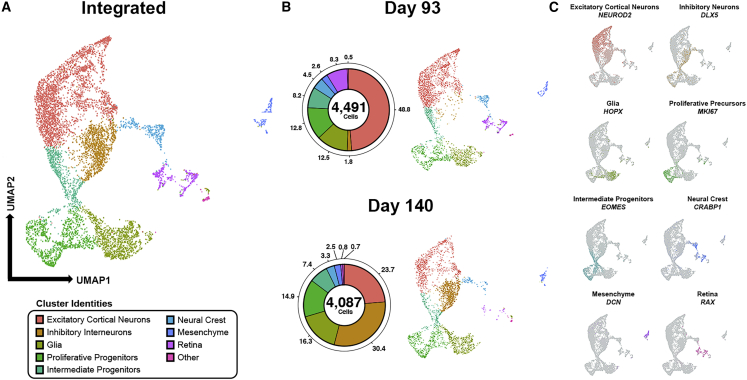
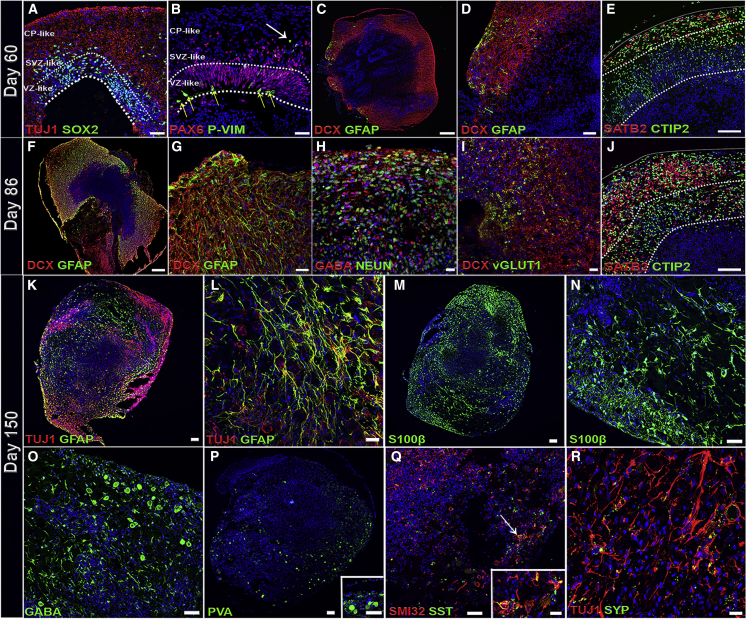
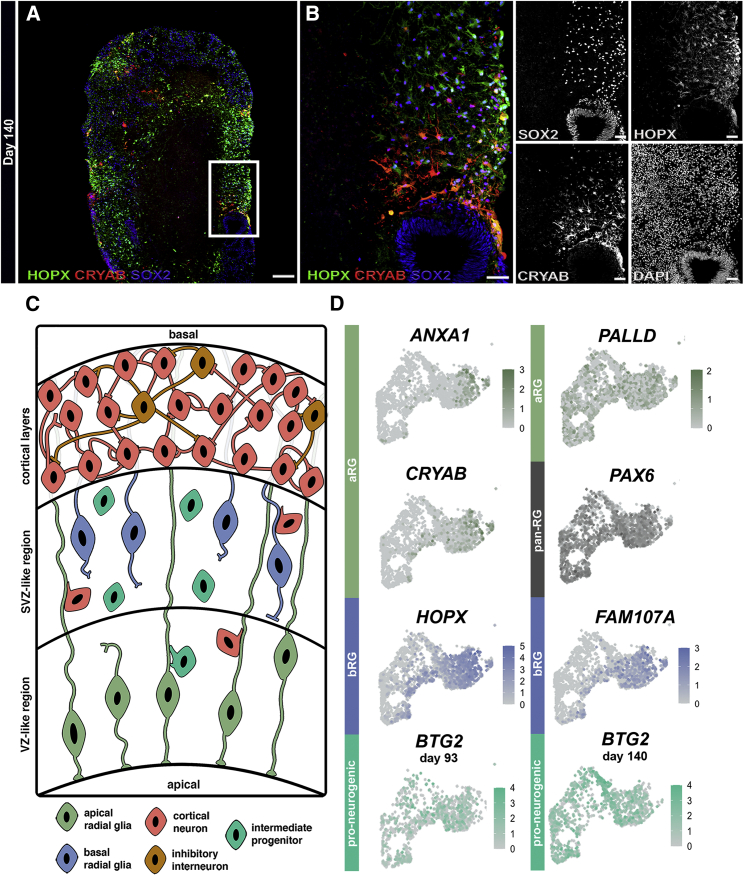
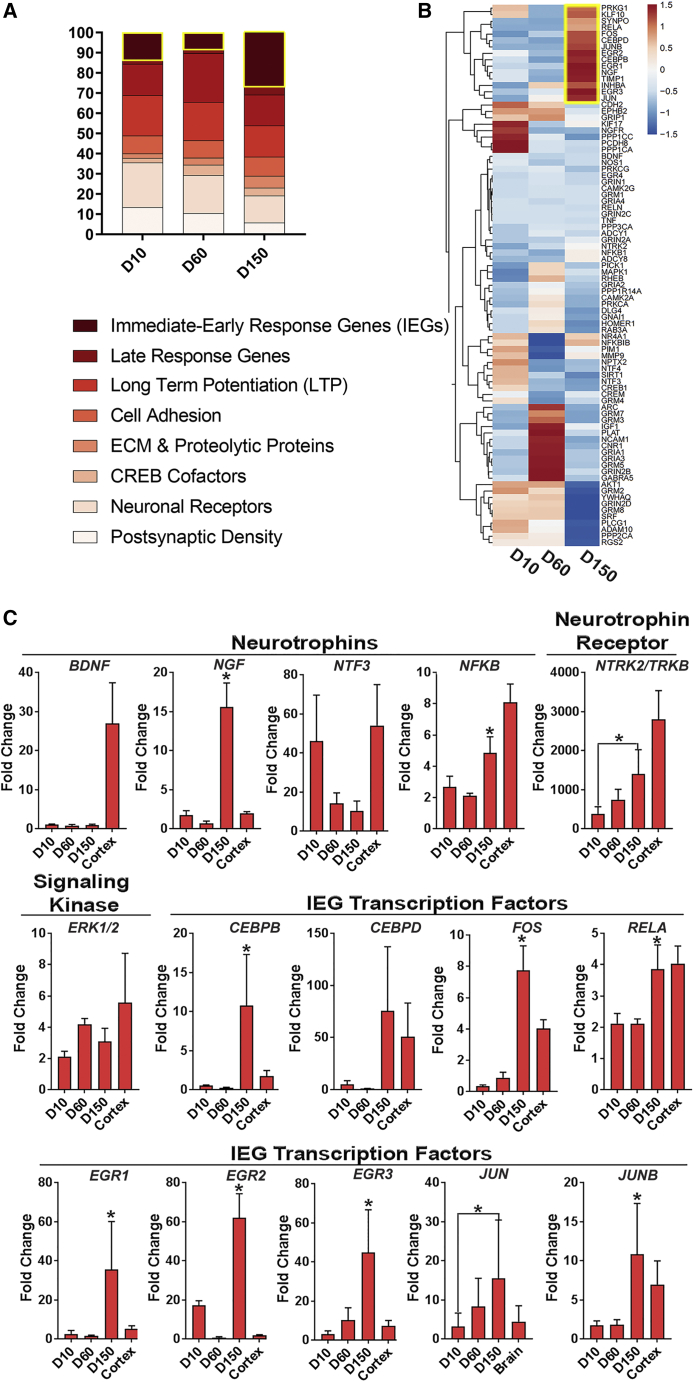
Cerebral organoids (COs) are rapidly accelerating the rate of translational neuroscience based on their potential to model complex features of the developing human brain. Several studies have examined the electrophysiological and neural network features of COs; however, no study has comprehensively investigated the developmental trajectory of electrophysiological properties in whole-brain COs and correlated these properties with developmentally linked morphological and cellular features. Here, we profiled the neuroelectrical activities of COs over the span of 5 months with a multi-electrode array platform and observed the emergence and maturation of several electrophysiologic properties, including rapid firing rates and network bursting events. To complement these analyses, we characterized the complex molecular and cellular development that gives rise to these mature neuroelectrical properties with immunohistochemical and single-cell transcriptomic analyses. This integrated approach highlights the value of COs as an emerging model system of human brain development and neurological disease.

Keywords: MEA; brain organoids; cerebral cortex; cerebral organoids; electrophysiology; multi-electrode array; neural network; single cell RNA sequencing.


Figures

Figure 1
Figure 1
CO Protocol Timeline and Early-Stage Morphological Features (A) Timeline of major developmental features and technical milestones in generating human COs. EB, embryoid body; MG, Matrigel encapsulation; VitA, vitamin A. (B) Growth curve of organoid areas shows a plateau at day 60 (minimum of four independent organoids per time point). Data are presented as mean ± SEM. (C) Encapsulated NE body that has been induced toward neuroectoderm. Scale bar, 200 μm. (D) Encapsulated NE body with expanding neuroepithelial folds (black arrows). Scale bar, 100 μm. (E) Day 30 COs. Scale bar, 1 mm. (F) Day 60 COs. Scale bar, 1 mm. (G and H) Spontaneous electrical activity can be detected from COs using a multi-electrode array (MEA) system. (G) A transferred CO on an MEA probe during acquisition of spontaneous electrical activity. (H) CO recording setup with 64 planar microelectrodes. (I) Microelectrode array at high magnification. (J) Local field potential trace from an individual microelectrode. (K) Spike raster plot depicting electrical activities derived from a CO. Bursts are represented as red triangles.
Figure 2
Figure 2
Developmental Trajectories of Electrophysiological Properties in COs (A) Detection of spontaneous electrical activity in day-34 COs and approximately every month thereafter shows a progressive increase in and complexity of EP properties. Top: Graphical representation of the array-wide spike detection rate (AWSDR) above every spike raster plot with a 3-min recording interval. Synchronized burst firing (SBF) activity is observed in late-stage CO cultures and is indicated by light blue columns within raster plots of days 120 and 161. Note the corresponding peaks in the AWSDR above each SBF. Middle: Heatmap plots of the mean spike rates of neurons within COs recorded by each individual microelectrode. Bottom: Local field potential (LFP) traces and a corresponding waveform taken from a shorter time interval showing a progressive increase in voltage amplitude and spiking rate at successive developmental time points. Note the characteristic action potential waveforms shown in days 99, 120, and 161. (B–G) EP quantifications of developing COs at approximately monthly intervals initiating at day 34 (n = 4/time point). EP data include (B) number of spikes, (C) number of bursts, (D) spike rate (number of spikes/s), (E) interburst interval, (F) burst duration, and (G) number of spikes in a burst. Data are presented as mean ± SEM and statistical analyses were performed using one-way ANOVA with Tukey's multiple comparisons test (n = 4 independent organoids per time point recorded and 2 independent experiments performed). Differences between day 34 and day 161 or between day 99 and day 161 time points are shown by black or red asterisks, respectively. p ≤ 0.05; ∗∗p ≤ 0.01; ∗∗∗p ≤ 0.001; ∗∗∗∗p ≤ 0.0001. All statistical analyses are shown in Table S3.
Figure 3
Figure 3
scRNA-seq Reveals Dynamic Cell Type Diversity Throughout the Developmental Trajectory of COs (A) Uniform-manifold approximation map (UMAP) of single-cell RNA-sequencing data from two COs with 8,578 cells total analyzed in one independent experiment. Each point on the UMAP represents a single cell. Color map specifies cell type, as outlined in the legend. (B) Donut plots and UMAPs for day 93 and day 140 capture of the cell type diversity within COs as a function of time. Day 93: 4,491 cells shown, including 2,190 excitatory cortical neurons (48.8%), 79 inhibitory interneurons (1.8%), 560 glia (12.5%), 575 proliferative progenitors (12.8%), 370 intermediate progenitors (8.2%), 203 neural crest (4.5%), 116 mesenchyme (2.6%), 373 retina (8.3%), and 25 other (0.5%). Day 140: 4,087 cells shown, including 968 excitatory cortical neurons (23.7%), 1,242 inhibitory interneurons (30.4%), 667 glia (16.3%), 608 proliferative progenitors (14.9%), 304 intermediate progenitors (7.4%), 133 neural crest (3.3%), 104 mesenchyme (2.6%), 34 retina (0.8%), and 27 other (0.7%). (C) UMAPs depict canonical markers for each cell cluster type, excluding other. Additional markers are provided in Figure S4.
Figure 4
Figure 4
Cell-Type Diversity in COs (A) Immunostaining of day 60 COs shows SOX2+ NPCs lining the ventricle-like structures within COs. At day 60, the majority of SOX2+ NPCs are restricted to the VZ-like areas within the area of dashed lines. SOX2+ NPCs are also observed migrating into SVZ-like areas and rarely observed in CP-like zones as shown by TUJ1 immunostaining at this developmental stage. Scale bar, 50 μm. (B) Immunostaining for the radial glial (RG) marker PAX6, showing dense expression primarily within the VZ-like area, in addition to the mitotic RG marker phospho-Vimentin (P-VIM), showing RG preferentially dividing at the apical surface (yellow arrows, lower dashed line). PAX6+ RGs observed outside of the VZ-like zone representbasal RG cells, which also remain mitotically active to a lesser extent, as shown by P-VIM staining (white arrow). Scale bar, 50 μm. (C) Day 60 COs show the emergence of astroglia as shown by GFAP staining. DCX, a neuronal migratory marker, demarcates the CP-like zone. Scale bar, 200 μm. (D) High-magnification image of (E) showing the presence of GFAP+ astrocytes. Scale bar, 50 μm. (E) Immunostaining for the late-born and superficial CP marker SATB2 and the deep-layer CP marker CTIP2. Dashed lines indicate upper SATB2+ cortical layer zone with deeper layer CTIP2+ zone. Scale bar,100 μm. (F) Day 86 COs show significant expansion of GFAP+ astrocytes within the CP-like zone, which also contains DCX+ neurons. Scale bar, 200 μm. (G) High-magnification image of (I) showing the increased presence of GFAP+ astrocytes compared with day 60. Scale bar, 50 μm. (H) Immunostaining for the inhibitory neuronal marker GABA and the mature neuronal marker NEUN. Scale bar, 20 μm. (I) Presence of excitatory neurons is also observed as shown by staining for the vesicular glutamate transporter 1, vGLUT1, which co-localized with DCX in the CP-like zone. Scale bar, 50 μm. (J–N) (J) Day 86 COs show an expansion of the superficial SATB2+ cortical layer zone compared with day 60 COs. Dashed lines indicate more defined upper SATB2+ cortical layer zone and deeper layer CTIP2+ zone. Scale bar, 100 μm. (K–N) Immunostaining of day 150 cerebral COs shows presence of neuronal (K and L, TUJ1) and astrocytic cell lineages (K and L, GFAP, and M and N, S100β). Scale bars, (K and M) 100 μm, (L) 20 μm, and (N) 50 μm. (O–R) Maturation of day 150 COs exhibits GABAergic neurons as shown by (O) GABA staining and interneuron subtypes, (P) parvalbumin (PVALB), and (Q) somatostatin (SST). Scale bars, (O) 50 μm; (P) 100 μm and inset, 50 μm; (Q) 50 μm and inset, 25 μm. (R) Synaptic maturation is also observed in day 150 COs as shown by expression of the pre-synaptic marker, synaptophysin (SYP). Scale bar, 25 μm. All images were stained with DAPI (blue) (n = 4 independent organoids, all time points).
Figure 5
Figure 5
Presence of Diverse RG Cells in COs (A) Low-power composite image of HOPX, CRYAB, and SOX2 expression in day 140 COs. White frame indicates reference for (B). (B) High-power merged and single-channel images from inset in (A). (C) Schematic depicting progenitor zones in the CO model. (D) Feature UMAPs of integrated glia and proliferative progenitor clusters (note the retained shape of clusters from Figure 3). From top to bottom: expression of aRG-specific markers PALLD, ANXA1, and CRYAB; bRG-specific markers HOPX and FAM107A; pan-RG markers PAX6 and SOX2 in integrated scRNA-seq dataset; and anti-proliferative/pro-neurogenic marker BTG2 shows increased expression over time (left, day 93, and right, day 140) (n = 4 independent organoids). Scale bar (A), 200 μm. All scale bars in (B), 50 μm.
Figure 6
Figure 6
Gene Expression Profiling Reveals Activation of an IEG Cluster in Day 150 COs (A) Functional categorization of upregulated genes involved in synaptic plasticity. The highlighted boxed segments in the bar graph at each time point refer to IEGs. (B) Heatmap of gene expression dynamics associated with synaptic activity at days 10, 60, and 150 during CO development. (C) Quantitative expression analyses of NTR/TRK signaling and IEG activation genes regulating synaptic plasticity at days 10, 60, and 150 during CO development. Profiled gene members include NTRs, the TRKB receptor, the ERK 1/2 signaling kinase, and multiple IEG transcription factors. Gene expression values that showed significant differences (p < 0.05) between day 60 and day 150 time points are indicated by an asterisk. Adult human brain cortex was included as a positive control (n = 5 independent organoids pooled together and 3 independent experiments performed).

References

    1. Attardo A., Fabel K., Krebs J., Haubensak W., Huttner W.B., Kempermann G. Tis21 expression marks not only populations of neurogenic precursor cells but also new postmitotic neurons in adult hippocampal neurogenesis. Cereb. Cortex. 2010;20:304–314. - PMC - PubMed
    1. Bardy C., van den Hurk M., Eames T., Marchand C., Hernandez R.V., Kellogg M., Gorris M., Galet B., Palomares V., Brown J. Neuronal medium that supports basic synaptic functions and activity of human neurons in vitro. Proc. Natl. Acad. Sci. U S A. 2015;112:E2725–E2734. - PMC - PubMed
    1. Bershteyn M., Nowakowski T.J., Pollen A.A., Di Lullo E., Nene A., Wynshaw-Boris A., Kriegstein A.R. Human iPSC-derived cerebral organoids model cellular features of lissencephaly and reveal prolonged mitosis of outer radial glia. Cell Stem Cell. 2017;20:435–449.e34. - PMC - PubMed
    1. Biane J., Conner J.M., Tuszynski M.H. Nerve growth factor is primarily produced by GABAergic neurons of the adult rat cortex. Front. Cell. Neurosci. 2014;8:220. - PMC - PubMed
    1. Birey F., Andersen J., Makinson C.D., Islam S., Wei W., Huber N., Fan H.C., Metzler K.R.C., Panagiotakos G., Thom N. Assembly of functionally integrated human forebrain spheroids. Nature. 2017;545:54–59. - PMC - PubMed

Publication types

Substances