. 2020 Dec 9;108(5):919-936.e11.
doi: 10.1016/j.neuron.2020.08.030. Epub 2020 Sep 24.

LTP Induction Boosts Glutamate Spillover by Driving Withdrawal of Perisynaptic Astroglia

Affiliations

LTP Induction Boosts Glutamate Spillover by Driving Withdrawal of Perisynaptic Astroglia

Christian Henneberger et al. Neuron. .

Abstract

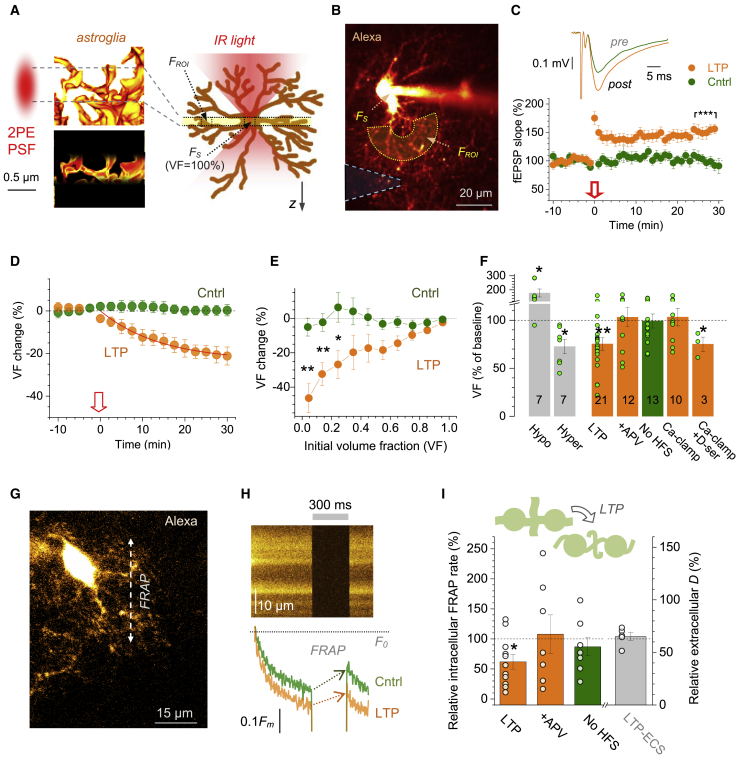
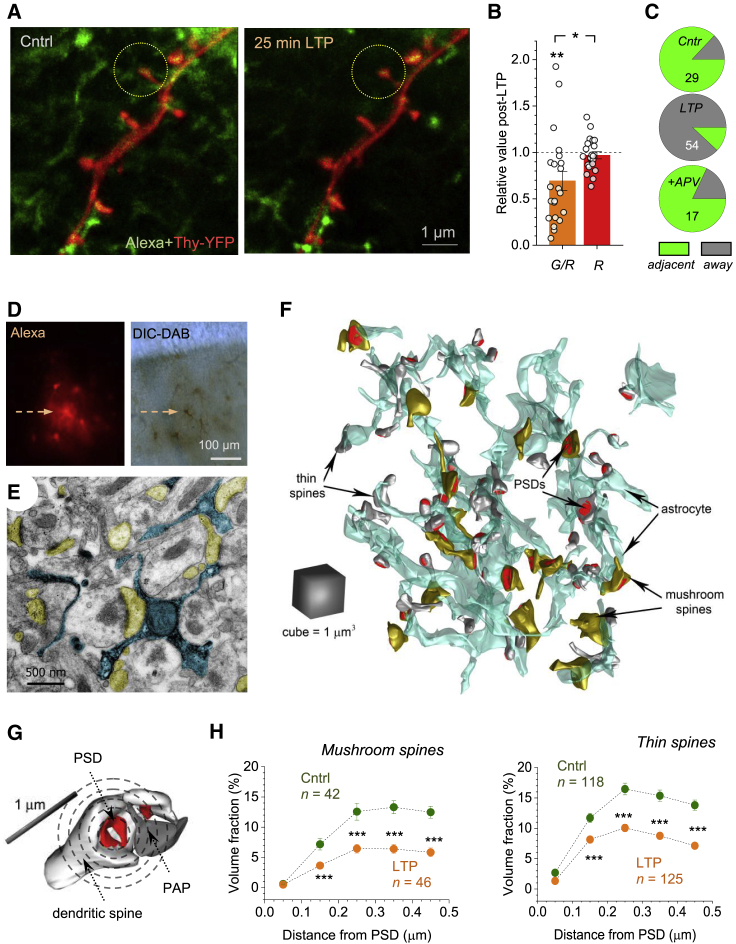
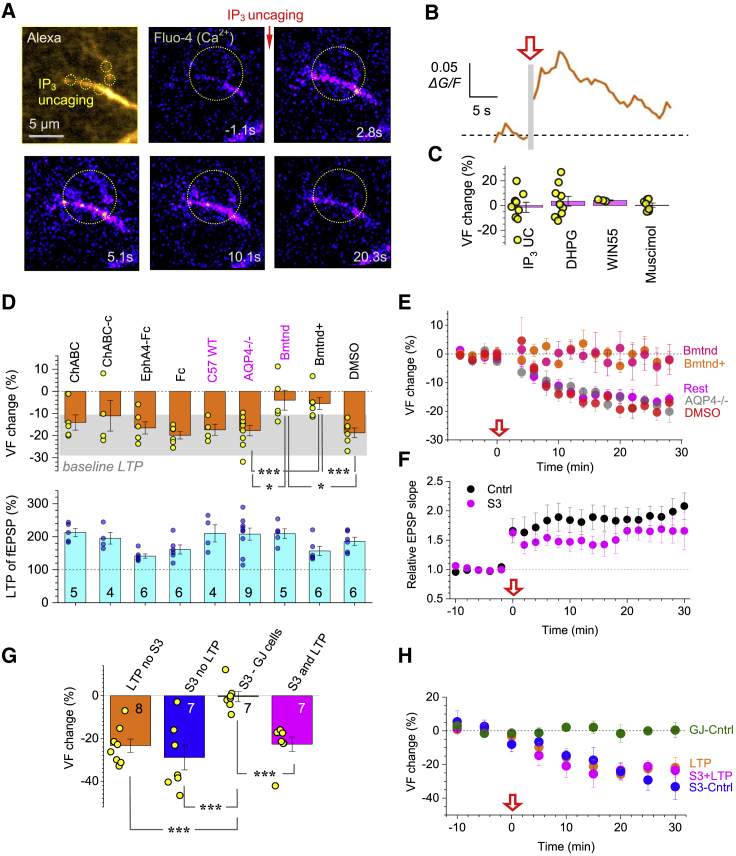
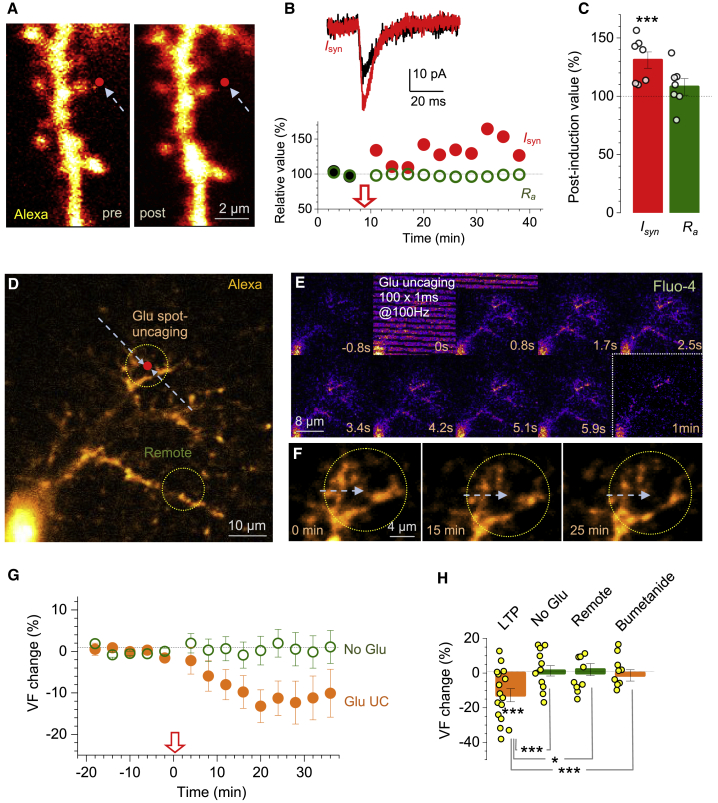
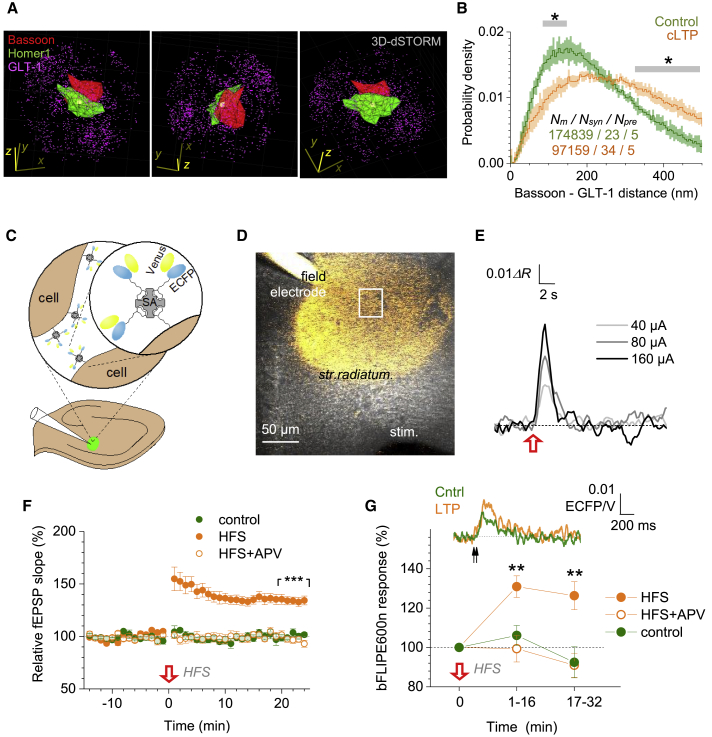
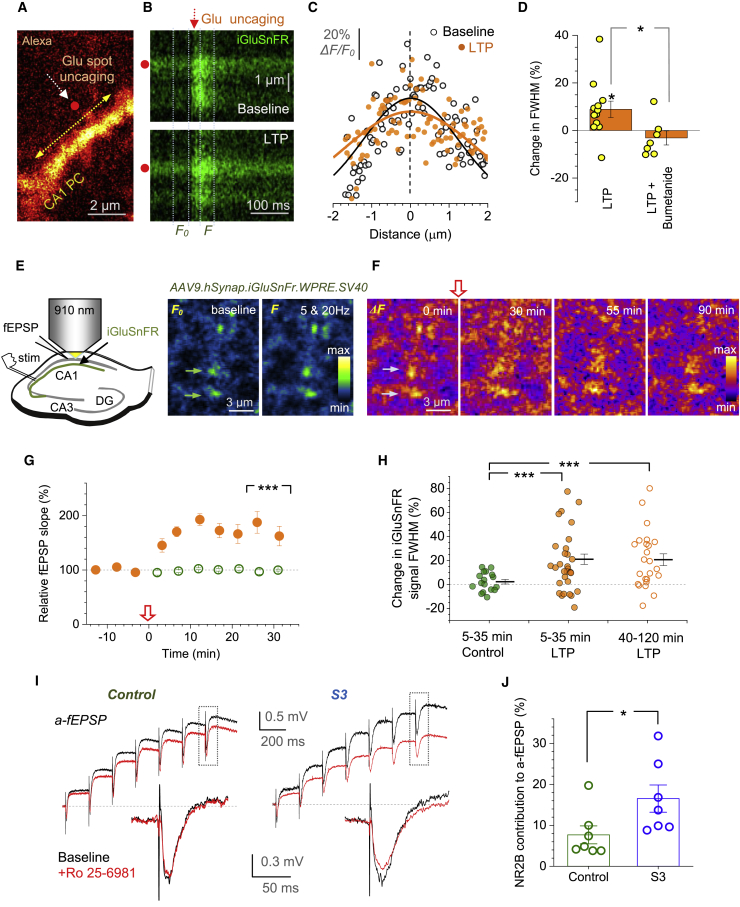
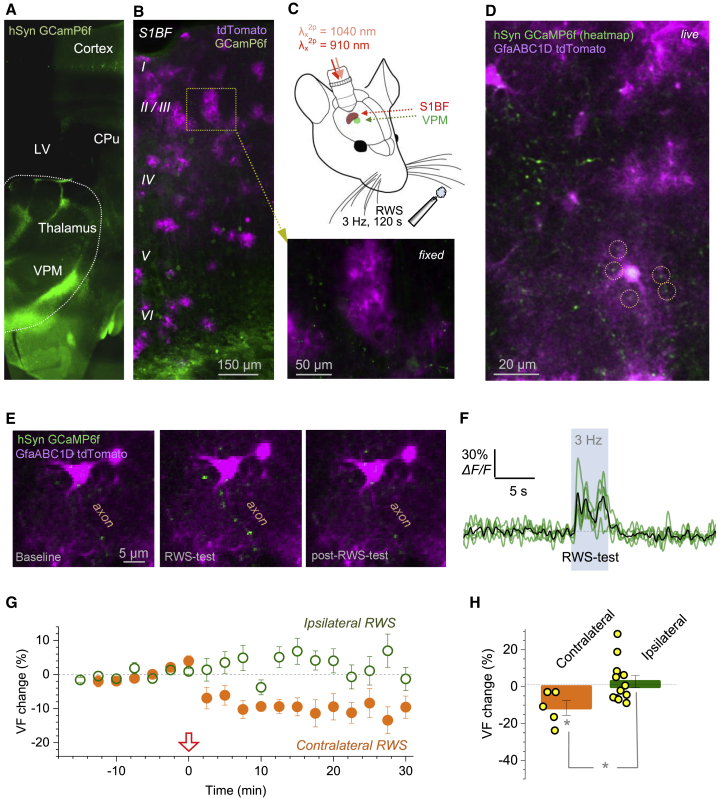
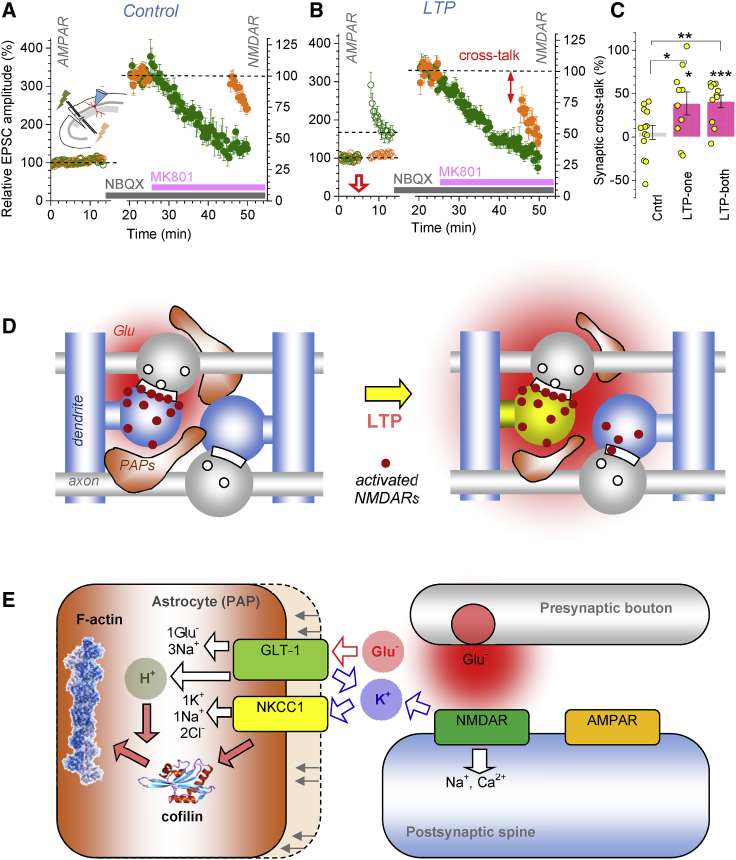
Extrasynaptic actions of glutamate are limited by high-affinity transporters expressed by perisynaptic astroglial processes (PAPs): this helps maintain point-to-point transmission in excitatory circuits. Memory formation in the brain is associated with synaptic remodeling, but how this affects PAPs and therefore extrasynaptic glutamate actions is poorly understood. Here, we used advanced imaging methods, in situ and in vivo, to find that a classical synaptic memory mechanism, long-term potentiation (LTP), triggers withdrawal of PAPs from potentiated synapses. Optical glutamate sensors combined with patch-clamp and 3D molecular localization reveal that LTP induction thus prompts spatial retreat of astroglial glutamate transporters, boosting glutamate spillover and NMDA-receptor-mediated inter-synaptic cross-talk. The LTP-triggered PAP withdrawal involves NKCC1 transporters and the actin-controlling protein cofilin but does not depend on major Ca2+-dependent cascades in astrocytes. We have therefore uncovered a mechanism by which a memory trace at one synapse could alter signal handling by multiple neighboring connections.

Keywords: Excitatory synapse; astrocyte plasticity; barrel cortex; glutamate sensor imaging; glutamate spillover; hippocampus; long-term potentiation; perisynaptic astroglial processes; super-resolution microscopy; whisker stimulation.


Conflict of interest statement

Declaration of Interests The authors declare no competing interests.

Figures

Figure 1
Figure 1
Reduced PAP Presence after LTP Induction at CA3-CA1 Synapses (A) Left: 2PE point-spread function (PSF) excites dye-filled PAPs (yellow, 3D EM fragment) within an ~1 μm focal plane (dotted lines; bottom). Right: fluorescence within ROI (FROI) scales with PAP VF, reaching ~100% VF inside the 5–7 μm wide soma (FS). (B) Astrocyte filled with AF 594 (single focal section; λx2P = 800 nm); dashed cone, extracellular recording pipette. FROI and FS, areas of VF readout; see Video S1 for extended dynamic range. (C) Traces, s. radiatum fEPSPs, before (pre) and ~25 min after LTP induction (post); graph, relative fEPSP slope (mean ± SEM; arrow, induction onset); ∗∗∗p < 0.001 (25–30 min post-induction: 151.0% ± 6.7% compared to baseline, n = 18). (D) Relative change in PAP VF (%, mean ± 95% confidence interval [CI]) in control (green; n = 24 cells) and during LTP induction (arrow, onset; orange; n = 29); red line, best-fit exponential decay to steady state VF(t)=VFss+(1VFss)exp(t/τ); VFss = 0.77 ± 0.04, τ = 14 ± 5 min. (E) Relative change in PAP VF (%, mean ± SEM) plotted against initial PAP VF, in control (n = 8 cells) and ~25 min after LTP induction (orange; n = 13; p < 0.05, ∗∗< 0.01, compared to control, df = 19). (F) Grey, PAP VF change (%, sample size n shown) in hypo-osmotic (220 mOsm/L) and hyper-osmotic (420 mOsm/L) solutions, as shown. Green and orange, PAP VF change 25–30 min after LTP induction in control (LTP, mean ± SEM: −25% ± 7%), in 50 μM APV (+APV, 3.1% ± 9.9%), with no HFS (−0.8% ± 7.3%), under Ca2+ clamp (Ca-clamp, 6.8% ± 9.5%), under Ca2+ clamp with 10 μM D-serine added (Ca-clamp+ D-ser, −24% ± 7%); ∗∗p < 0.01; p < 0.05; dots, individual cells. (G) Evaluating diffusion coupling inside astroglia using FRAP of dialyzed AF 594 (STAR Methods; single focal section; ~80 μm depth); arrow, example line scan position. (H) Top: line scan as in (G) (baseline conditions; gray segment, shutter closed). Bottom: the corresponding fluorescence time course, before (Cntrl) and ~20 min after LTP induction (LTP); F0, initial intensity; arrows, FRAP during shutter-on period (full recovery takes 39–40 s). (I) Summary of FRAP tests (G and H); diagram, LTP induction may taper PAPs lowering diffusion coupling. Graph (mean ± SEM), FRAP rate relative to baseline (left ordinate): ~25 min after LTP induction (LTP, 62% ± 12%, n = 11; p < 0.05); in 50 μM APV (108% ± 32%, n = 7); no-HFS control (87% ± 15%, n = 7). Grey (right ordinate), change in extracellular diffusivity ~25 min post-induction (LTP-ECS; 104% ± 7%, n = 5; Figures S1F–S1H); dots, individual tests.
Figure 2
Figure 2
Live STED and Correlational 3D EM Report PAP Withdrawal after LTP Induction (A) STED images of dendritic spines (red, CA1 pyramidal cell; Thy1-YFP) and nearby astroglia (green; 600 μM AF 488), before and ~25 min after LTP induction, as indicated; circles, ROIs centered at spine heads. (B) LTP induction reduces the green/red (astroglia/neuron) pixel ratio within ROIs (G/R; mean ± SEM; 31% ± 10%, n = 22, ∗∗p < 0.01), with no effect on red pixel count (R; −3.1% ± 3.8%; p < 0.02 compared to the G/R change, df = 42); dots, individual ROIs. (C) Proportion of dendritic spines that adjacent to (green) and away from (gray) PAPs, in control (Cntrl), 20–25 min post-induction (LTP), and the latter with 50 μM APV (+APV); spine numbers shown (Figures S2A–S2D). (D) Patched astrocyte loaded with biocytin (arrow, local astroglia stained through gap junctions), shown in the fluorescence (left) and DIC channel post-DAB conversion (right). (E) Electron micrograph showing PAPs of the patched astrocyte (arrow in D) filled with precipitate (blue), and adjacent dendritic spines (yellow) featuring PSDs. (F) Astrocyte fragment (cyan) reconstructed in 3D, including adjacent thin (white) and mushroom (yellow) dendritic spines with PSDs (red; Figure S2E). (G) Volumetric measure of synaptic astroglial coverage: PAP VF is calculated within 100 nm-thick concentric 3D shells (circles, not to scale) centered at the PSD (red). (H) PAP VF around PSDs (mean ± SEM) of thin and mushroom spines, in control and ~30 min after LTP induction, as indicated; sample sizes shown; ∗∗∗p < 0.001 (df = 86 for mushroom and df = 241 for thin spines).
Figure 3
Figure 3
LTP-Associated PAP Withdrawal Depends on NKCC1 and Cofilin (A) Top left: astrocyte fragment (5 μm z stack); circles, uncaging spots (400 μM NPE-IP3; AF 594 channel, λx2P = 840 nm). Other panels: Ca2+ response (200 μM Fluo-4; false colors) to IP3 spot-uncaging (at t = 0; five 5 ms pulses at 5 Hz; λu2P = 720 nm); time lapse shown; circle, ROI for Ca2+. (B) Time course of intracellular Ca2+ signal (ΔF/G) in ROI shown in (A); one-cell example; red arrow (gray segment), IP3 uncaging. (C) Relative change in PAP VF (%, mean ± SEM) 25 min after: spot-uncaging of intracellular IP3 (−1.4% ± 4.1%, n = 10), application of DHPG (300 μM, 3.5% ± 3.9%, n = 10), CB1 receptor agonist WIN55 (1 μM, 4.1% ± 0.4%, n = 3), or GABA receptor agonist muscimol (20 μM, 0.4% ± 1.7%, n = 6). (D) Relative change in PAP VF (%, mean ± SEM; top) ~25 min after LTP induction, and the corresponding LTP level (%, mean ± SEM; bottom, sample size shown): in the presence of 0.5–0.7 U/mL chondroitinase ABC (ChABC, −14% ± 3%), control ChABC-c (−11% ± 7%), 10 μg/mL EphA4-Fc (−17% ± 3%), 10 μg/mL Fc control (−20% ± 2%), wild-type C57BI6 mice (−17% ± 3%), AQP4−/− knockout mice (−18% ± 2%), 20 μM intracellular bumetanide (Bmtnd, −4% ± 4.5%), 50 μM intracellular bumetanide + 100 μM extracellular TGN-020 (Bmtnd+, −5.5% ± 2.7%), DMSO control 0.2% external + 0.05% internal (−19% ± 2%); blue text, data from mice; gray shadow, 95% CI for PAP VF change after LTP induction in control conditions; p < 0.02 (df = 12 for AQP4/ versus Bmtnd, df = 9 for Bmtnd versus DMSO), ∗∗∗p < 0.005 (df = 13 for AQP4/ versus Bmtnd+, df = 10 for Bmtnd+ versus DMSO; t test or Mann-Whitney independent sample tests). (E) PAP VF change (%, mean ± SEM) during LTP induction (arrow) in key tests shown in (D), as indicated, and summary for other experiments (Rest). (F) Relative fEPSP slope (mean ± SEM) during LTP induction at CA3-CA1 synapses in control (n = 10) and with S3 peptide inside astroglia (200 μM , n = 6), as shown (Figures S3B and S3C). (G) Occlusion experiment: PAP VF change (%, mean ± SEM, sample size shown): ~25 min after LTP induction in control (LTP no S3; −23% ± 3%), no LTP induction, whole-cell loaded S3 (S3 no LTP; −29% ± 6%); same but recorded in gap-junction connected astrocytes devoid of S3 (S3-GJ cells; −0.4% ± 2.4%); and ~25 min after LTP induction with S3 (S3 and LTP; −27% ± 3%); ∗∗∗p < 0.001 (df = 13 for “LTP no S3” versus “S3 GJ Cells,” df = 12 for the rest). (H) Time course of PAP VF (%, mean ± SEM) in the occlusion experiments shown in (G); notations as in (G).
Figure 4
Figure 4
LTP Induction at Individual CA3-CA1 Synapses Reduces Local PAP Presence (A) Dendritic fragment, CA1 pyramidal cell (AF 594 channel), showing glutamate uncaging spot (red dot; 2.5 mM bath-applied MNI-glutamate) before (pre) and ~20 min after spot-uncaging LTP induction (post). (B) One-spine example. Traces, EPSCs (Isyn, voltage-clamp) during baseline (black) and ~30 min after LTP induction (red; see Figures S4A and S4B for Ca2+ dynamics). Graph, relative EPSC amplitude (Isyn; black and red circles) and cell access resistance (Ra, green) time course; arrow, LTP induction onset. (C) Statistical summary of experiments in (A) and (B) (mean ± SEM; n = 7, ∗∗∗p < 0.005); notations as in (B); dots, individual tests. (D) Example, astrocyte fragment (whole-cell AF 594, single focal section); red dot, glutamate uncaging spot; circles, ROIs for PAP VF monitoring near the spot and away, as shown. (E) Time-lapse frames (area shown in D): astrocyte Ca2+ response (Fluo-4, λx2P = 840 nm) to the spot-uncaging LTP protocol (λu2P = 720 nm). (F) Astrocyte fragment near the uncaging spot (as in D; arrow) immediately after (0 min), at 15 min and 25 min after LTP induction (~9 μm z stack average); PAP retraction seen at 15–25 min (Figures S4C–S4E; Video S2). (G) PAP VF change (%, mean ± SEM) in tests shown in (D) and (E) (Glu, n = 11), and with no MNI-glutamate (no Glu, n = 11; arrow, uncaging onset). (H) Summary: PAP VF change (%, mean ± SEM) ~25 min post-induction (LTP, −13% ± 4%, ∗∗∗p < 0.005, n = 16), with no MNI-glutamate (no Glu, 1.3% ± 3.0%, n = 9), in remote ROI (as in D; 2.0% ± 3.5%, n = 11), and with 20 μM bumetanide whole-cell (−1.4% ± 3.3%, n = 9); p < 0.05 (df = 15); ∗∗∗p < 0.005 (df = 23).
Figure 5
Figure 5
LTP Induction Triggers Withdrawal of Glial Glutamate Transporters Boosting Extracellular Glutamate Transient (A) Perisynaptic patterns of bassoon (red cluster), Homer 1 (green cluster), and GLT1 (magenta dots) molecules localized with 3D dSTORM; one-synapse example, three viewing angles shown; x-y-z scale bars, 500 nm (STAR Methods). (B) Nearest-neighbor distances (probability density, mean ± SEM) between GLT1 and bassoon, in control tissue and ~30 min after cLTP induction (Figures S5A and S5B; STAR Methods); sample size: Nm, inter-molecular distances; Nsyn, synapses; Npre, slices; SEM relates to Npre = 5; p < 0.05 (gray segments, significant difference). (C) Diagram, extracellular immobilization of bFLIPE600n (Venus and ECFP attachments shown) via biotinylation and attachment to streptavidin (SA) (Figure S5D; STAR Methods) in s. radiatum (delivery pipette shown). (D) Experimental design: sensor-injecting pipette (field) records fEPSPs evoked by Schaffer collateral stimulation (stim) while bFLIPE600n signal is monitored within an adjacent ROI (rectangle). (E) Example, glutamate signal reported by bFLIPE600n (ΔR, ECFP/Venus signal ratio) in response to Schaffer collateral HFS (100 Hz for 1 s, red arrow; 10 μM NBQX, 50 μM D-APV) in s. radiatum (also Figures S5E and S5F). (F) Relative fEPSP slope (%, mean ± SEM) in control (green, n = 8 slices), during LTP induction (n = 14, orange), and with 50 μM APV present (n = 7, orange empty); ∗∗∗p < 0.005, difference over 20–25 min post-induction. (G) Traces, bFLIPE600n response to paired-pulses (20 Hz, arrows; mean ± SEM) in control (green) and ~25 min after LTP induction (orange). Plot, summary (notations as in F); ∗∗p < 0.01, difference between LTP and either control or APV datasets.
Figure 6
Figure 6
LTP Induction Broadens Evoked Extracellular Glutamate Transients (A) Dendritic fragment, CA1 pyramidal cell (AF 594 channel); red dot, glutamate uncaging spot; yellow arrow, line scan position for iGluSnFR monitoring (Figures S6A–S6C). (B) Line scans (as in A; iGluSnFR channel) showing fluorescence transients in response to a 1 ms uncaging pulse (arrow, onset; red dot, position), before (top) and 20–25 min after the spot-uncaging LTP induction (bottom); dotted lines, time windows to sample baseline (F0) and evoked (F) fluorescence profiles, giving signal profile ΔF = FF0 (STAR Methods). (C) iGluSnFR fluorescence profiles (dots, pixel values) from test in (B); zero, uncaging spot position; black and orange lines, best-fit Gaussian. (D) Summary of tests shown in (A)–(C): relative change (%, mean ± SEM) in ΔF/F0 signal full-width-at-half-magnitude (FWHM) ~25 min after LTP induction (LTP, 9.0% ± 3.4%; n = 12; p < 0.03), and with 20 μM bumetanide inside astroglia (LTP+Bumetanide; −3.1% ± 3.0%; n = 7; p < 0.02, df = 15; Figures S6D–S6G); dots, individual tests. (E) Diagram, monitoring evoked glutamate release from Schaffer collateral boutons with iGluSnFR, acute slices. Images: iGluSnFR fluorescence landscape s. radiatum in resting conditions (F0) and during five stimuli at 20 Hz (F); arrows, two tentative axonal boutons, false colors. (F) Evoked iGluSnFR signal landscapes (ΔF = FF0; ROI as in E) just before (0 min, as in E) and 30, 55, and 90 min after LTP induction (red arrow; Figure S6H; STAR Methods); false colors. (G) Relative fEPSP slope (%, mean ± SEM, n = 8 slices), protocol as in (E) and (F); arrow, LTP induction; ∗∗∗p < 0.001 (relative to no-HFS control, n = 4; over 25–35 min post-induction; df = 10). (H) The FWHM of evoked iGluSnFR ΔF signals relative to baseline, over 5–35 min in control conditions (control, n = 17 boutons), 5–35 min (n = 31), and 40–120 min (n = 21) after LTP induction, as shown; dots, individual boutons; bars, mean ± SEM; ∗∗∗p < 0.005 (df = 46; 4 slices). (I) Upper traces, examples of CA1 astrocyte-recorded fEPSPs (a-fEPSP, current clamp, isolated NMDAR component; 3–5 trial average) evoked by 7 stimuli at 5 Hz, in baseline conditions (black) and after blocking GluN2B-containing NMDARs (1 μM Ro 25-6981, red); control cell and one dialyzed with 200 μM peptide S3 shown, as indicated; lower traces, fragments (rectangles) showing the 7th a-fEPSPs (pre-pulse baseline adjusted; see Figure S6I for extended traces). (J) Summary of tests shown in I; ordinate, reduction of the a-fEPSP amplitude by Ro 25-698; dots, individual cells; bars, mean ± SEM; p < 0.05 (n = 7 in control and S3; df = 12).
Figure 7
Figure 7
Whisker-Stimulation LTP Protocol in the Barrel Cortex In Vivo Triggers PAP VF Reduction in Astroglia Trespassed by Stimulated Axons (A) Expression of GCaMP6f 3 weeks post-transfection (STAR Methods) into the mouse ventral posteromedial nucleus (VPM), coronal section; LV, lateral ventricle; CPu caudate putamen; wide-field image, fixed tissue. (B) Composite post hoc image, barrel cortex area (coronal section), with astroglia expressing GfaABC1D tdTomato (magenta; STAR Methods) and neuronal structures expressing GCaMPf6 (green); dotted rectangle (inset, arrow) highlights astrocytes with axonal boutons occurring nearby. (C) Experiment diagram: 2PE imaging of the barrel cortex (S1BF) through a cranial window, with two fs lasers. LTP induction protocol uses RWS (5 Hz air-puffs for 120 s) on the contralateral side. (D) Live barrel cortex view (S1BF) through the cranial window (λx2P = 1,040 and 910 nm, single focal section). Green (GCaMPf6), heatmap of axonal signals firing in response to RWS; magenta (tdTomato), local astroglia; circles, examples of ROIs for PAP VF readout in proximity to RWS-responding thalamocortical axons (green; Figures S7A and S7B). (E) Example, a thalamocortical axon in S1BF (GCaMP6f, green) crossing astroglial territory (tdTomato, magenta), with boutons responding to an RWS test (3 Hz, 5 s) with Ca2+ elevations (middle panel). (F) Time course of Ca2+ signal (GCaMP6f) at five axonal boutons (green traces) shown in (E); black line, average. (G) PAP VF change (%, mean ± SEM), during RWS LTP induction protocol (arrow, onset), near axonal boutons responding to contralateral RWS (orange, n = 5 cells, 3 animals), and in during ipsilateral RWS (n = 12 cells, 4 animals). (H) Summary of experiments in (G): PAP VF change (%, mean ± SEM) over 15–30 min after the RWS LTP protocol onset; dots, data from individual cells; p < 0.04 (t test, df = 15 for two-sample comparison).
Figure 8
Figure 8
LTP Induction Boosts NMDAR-Mediated Inter-synaptic Cross-Talk (A) Inset diagram, experiment design to test NMDAR-mediated cross-talk between two afferent pathways (green and orange lightning) (Scimemi et al., 2004) (Figure S8A; STAR Methods). Plot, relative EPSC amplitude (mean ± SEM, n = 13), with single stimuli, 20 s apart, applied alternately to the two pathways (green and orange). AMPAR EPSCs are recorded for 12–15 min (Vm = −70 mV; left ordinate), then NMDAR EPSCs for ~5 min (10 μM NBQX, Vm = −20 mV; right ordinate). Once MK801 is added, NMDAR EPSCs are recorded in active (green) pathway only. Resuming stimulation in the silent (orange) pathway reveals little change in the NMDAR EPSC amplitude compared to baseline (dotted line). (B) Experiment as in (A) but with LTP induced in the active pathway (red arrow; n = 7). Reduced NMDAR EPSCs in the silent (orange) pathway upon resumed stimulation (arrow, cross-talk) point to NMDAR activation by glutamate escaping from the active (green) pathway. (C) Summary of experiments in (A) and (B). The degree of cross-talk (percentage of one-pathway NMDARs activated by glutamate discharges at the other pathway; mean ± SEM), in control (Cntrl, n = 13), with LTP induced either in one (LTP-one, n = 10) or both (LTP-both, n = 11; Figures S8C and S8D) pathways, prior to NMDAR EPSC recordings; p < 0.05 (df = 21 for Cntrl versus LTP-one), ∗∗p < 0.01 (df = 22), ∗∗∗p < 0.005. (D) Proposed changes in PAPs after LTP induction. In baseline conditions (left), PAPs restrict glutamate action to the synaptic cleft and some extrasynaptic NMDARs (red dots). After LTP induction (right), some PAPs withdraw, widening the pool of activated extrasynaptic NMDARs, including neighboring synapses. (E) Diagram, candidate cellular mechanisms of LTP-driven PAP withdrawal. LTP induction activates postsynaptic NMDARs and engages GLT1 transporters. This generates an extracellular K+ hotspot, activating the NKCC1-cofilin-1 pathway that engages, in a pH-sensitive manner, actin polymerization responsible for morphogenesis.

Similar articles

Cited by

References

    1. Adamsky A., Kol A., Kreisel T., Doron A., Ozeri-Engelhard N., Melcer T., Refaeli R., Horn H., Regev L., Groysman M. Astrocytic activation generates de novo neuronal potentiation and memory enhancement. Cell. 2018;174:59–71. - PubMed
    1. Aizawa H., Wakatsuki S., Ishii A., Moriyama K., Sasaki Y., Ohashi K., Sekine-Aizawa Y., Sehara-Fujisawa A., Mizuno K., Goshima Y., Yahara I. Phosphorylation of cofilin by LIM-kinase is necessary for semaphorin 3A-induced growth cone collapse. Nat. Neurosci. 2001;4:367–373. - PubMed
    1. Anders S., Minge D., Griemsmann S., Herde M.K., Steinhäuser C., Henneberger C. Spatial properties of astrocyte gap junction coupling in the rat hippocampus. Philos. Trans. R. Soc. Lond. B Biol. Sci. 2014;369:20130600. - PMC - PubMed
    1. Araque A., Carmignoto G., Haydon P.G., Oliet S.H., Robitaille R., Volterra A. Gliotransmitters travel in time and space. Neuron. 2014;81:728–739. - PMC - PubMed
    1. Arizono M., Inavalli V.V.G.K., Panatier A., Pfeiffer T., Angibaud J., Levet F., Ter Veer M.J.T., Stobart J., Bellocchio L., Mikoshiba K. Structural basis of astrocytic Ca2+ signals at tripartite synapses. Nat. Commun. 2020;11:1906. - PMC - PubMed

Publication types