. 2020 Oct 12;38(4):567-583.e11.
doi: 10.1016/j.ccell.2020.08.015. Epub 2020 Sep 24.

Cholesterol Pathway Inhibition Induces TGF-β Signaling to Promote Basal Differentiation in Pancreatic Cancer

Affiliations

Cholesterol Pathway Inhibition Induces TGF-β Signaling to Promote Basal Differentiation in Pancreatic Cancer

Linara Gabitova-Cornell et al. Cancer Cell. .

Abstract

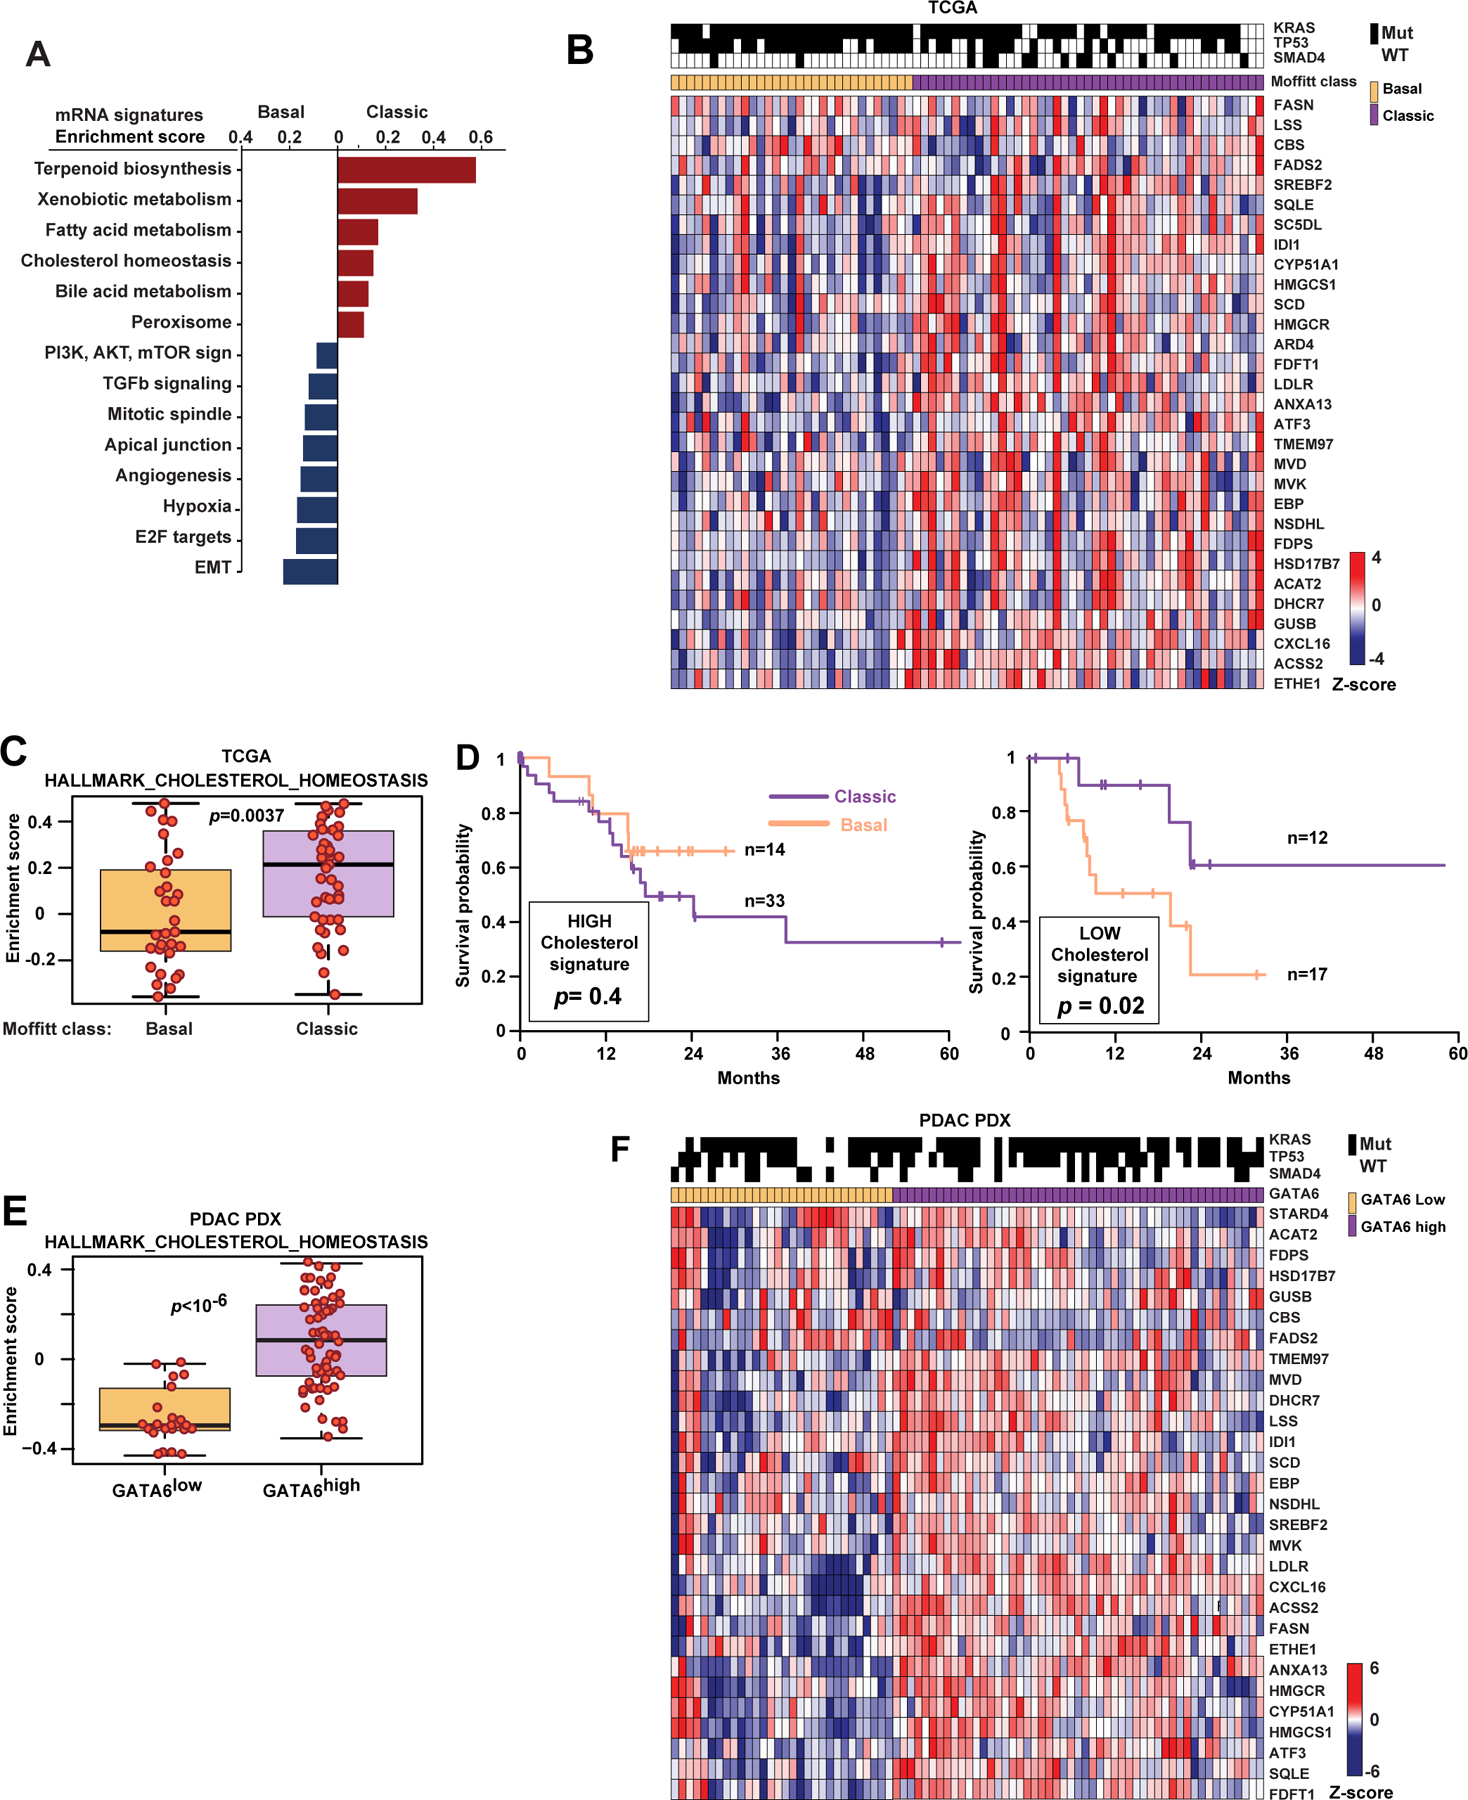
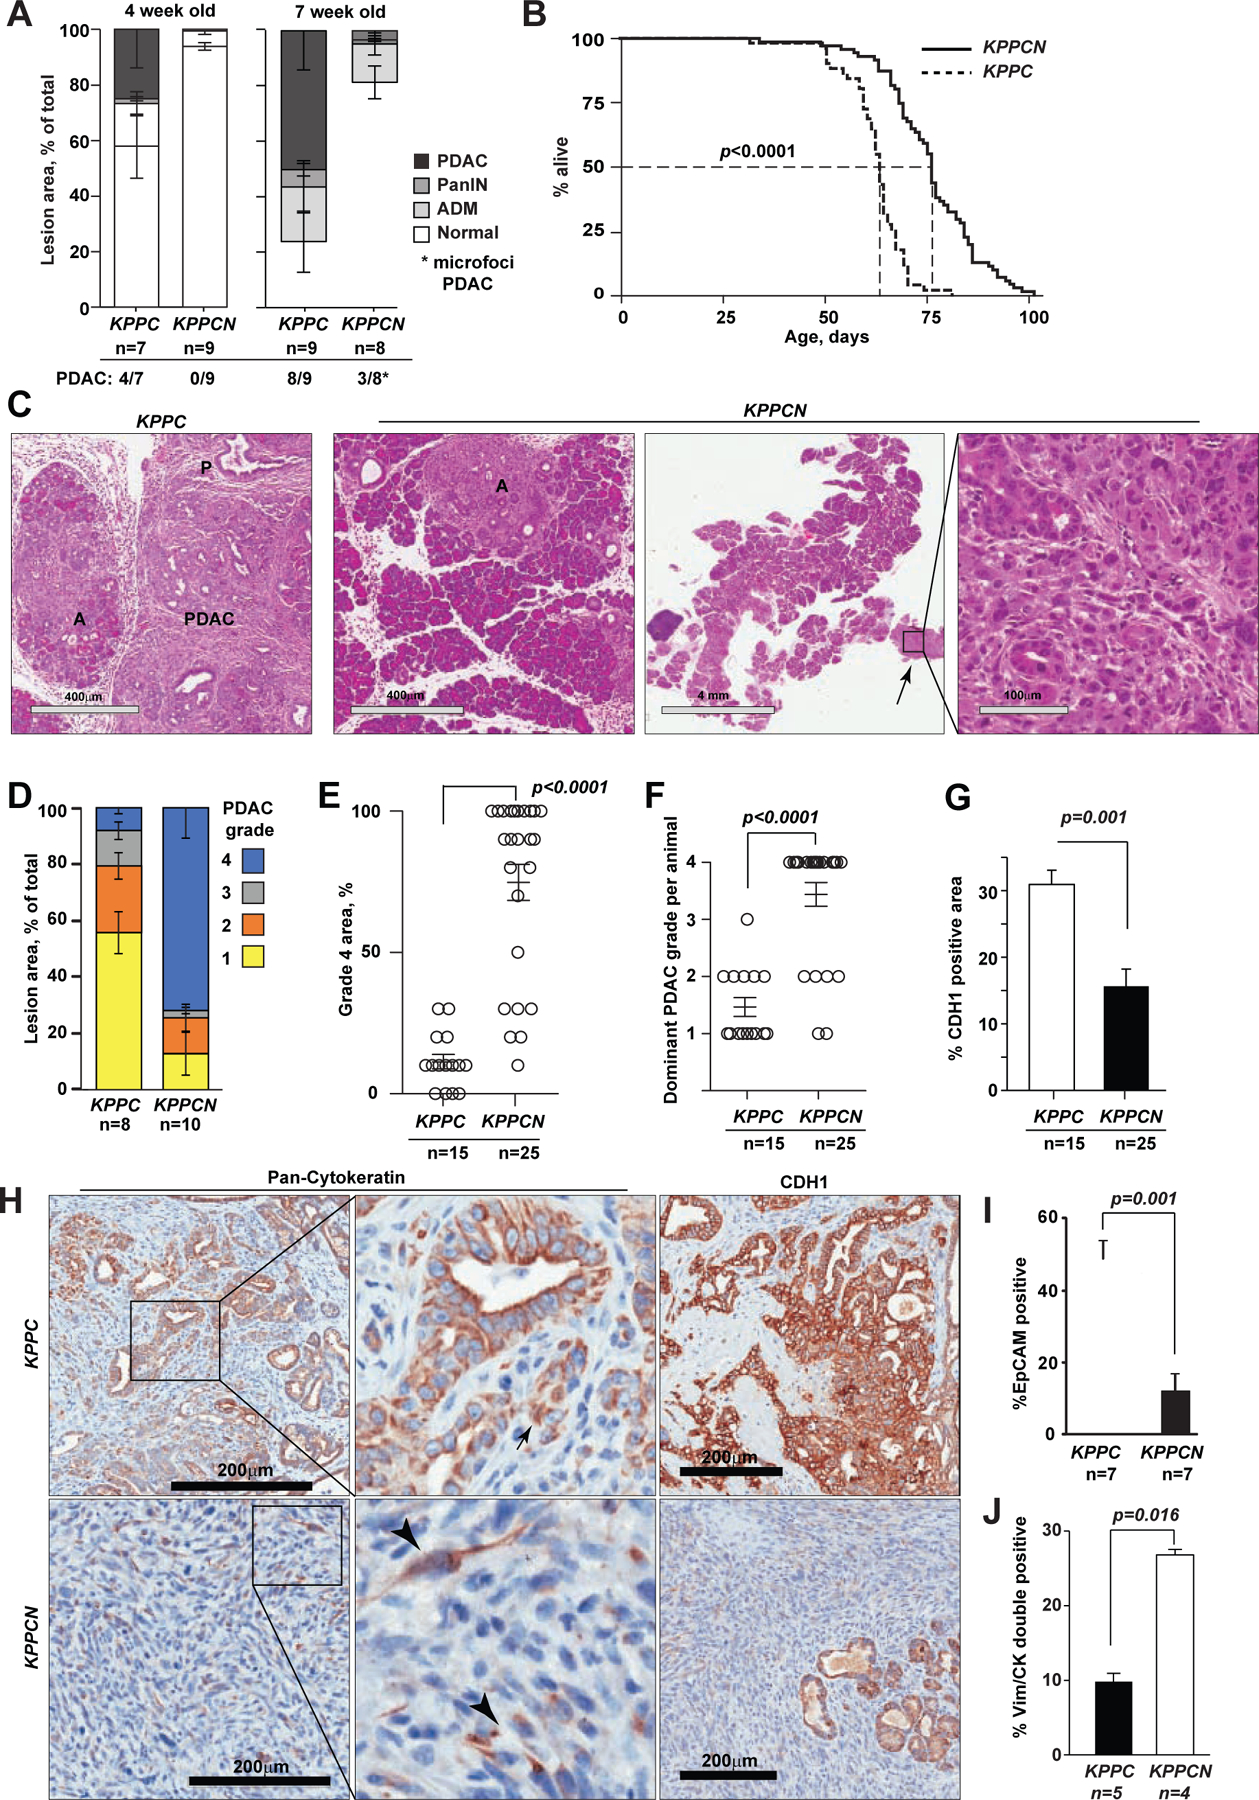
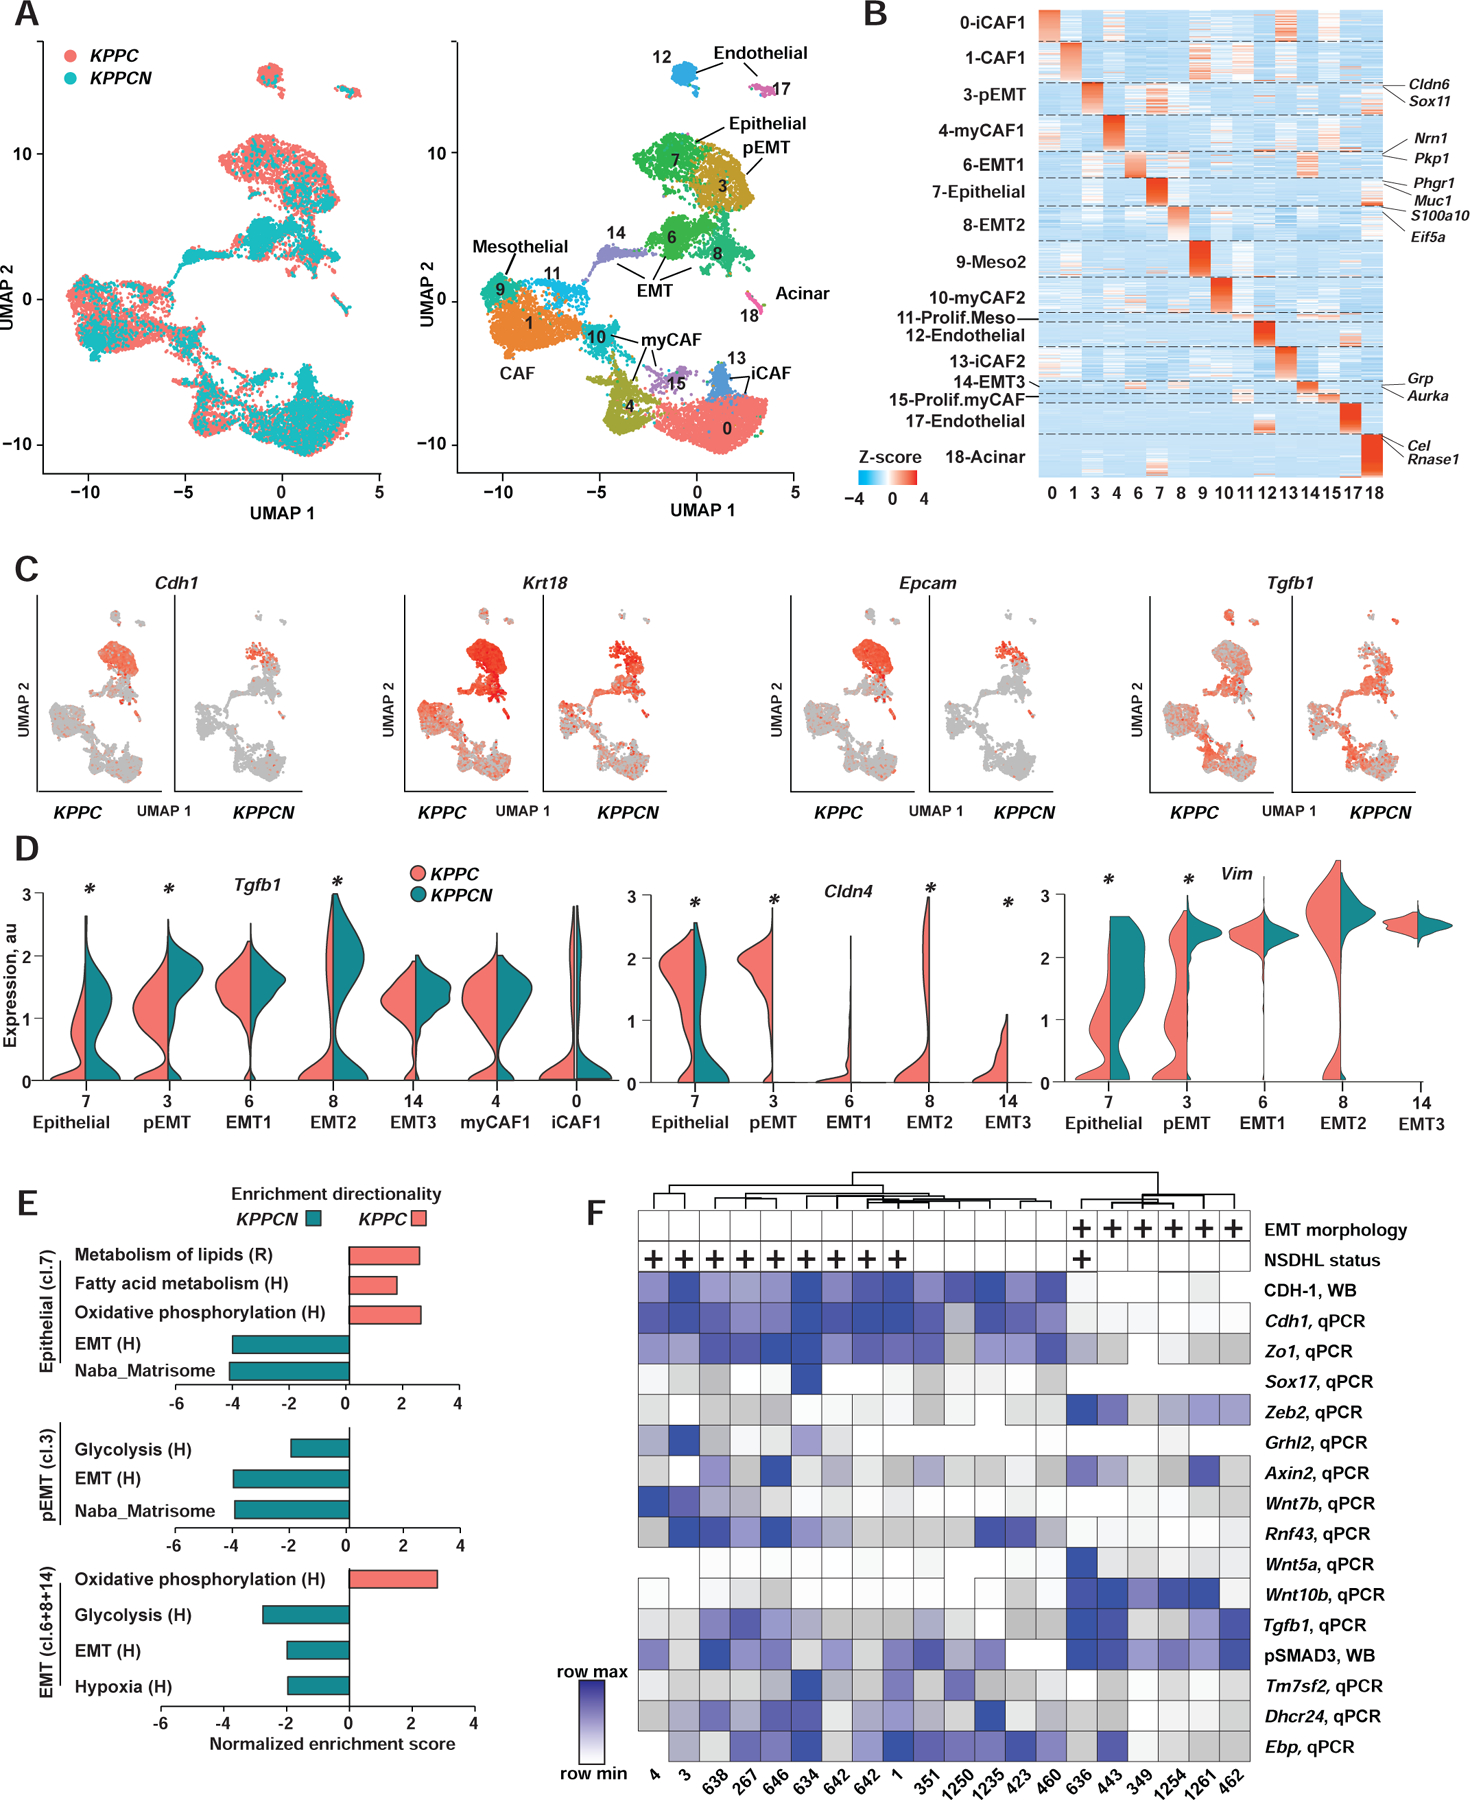
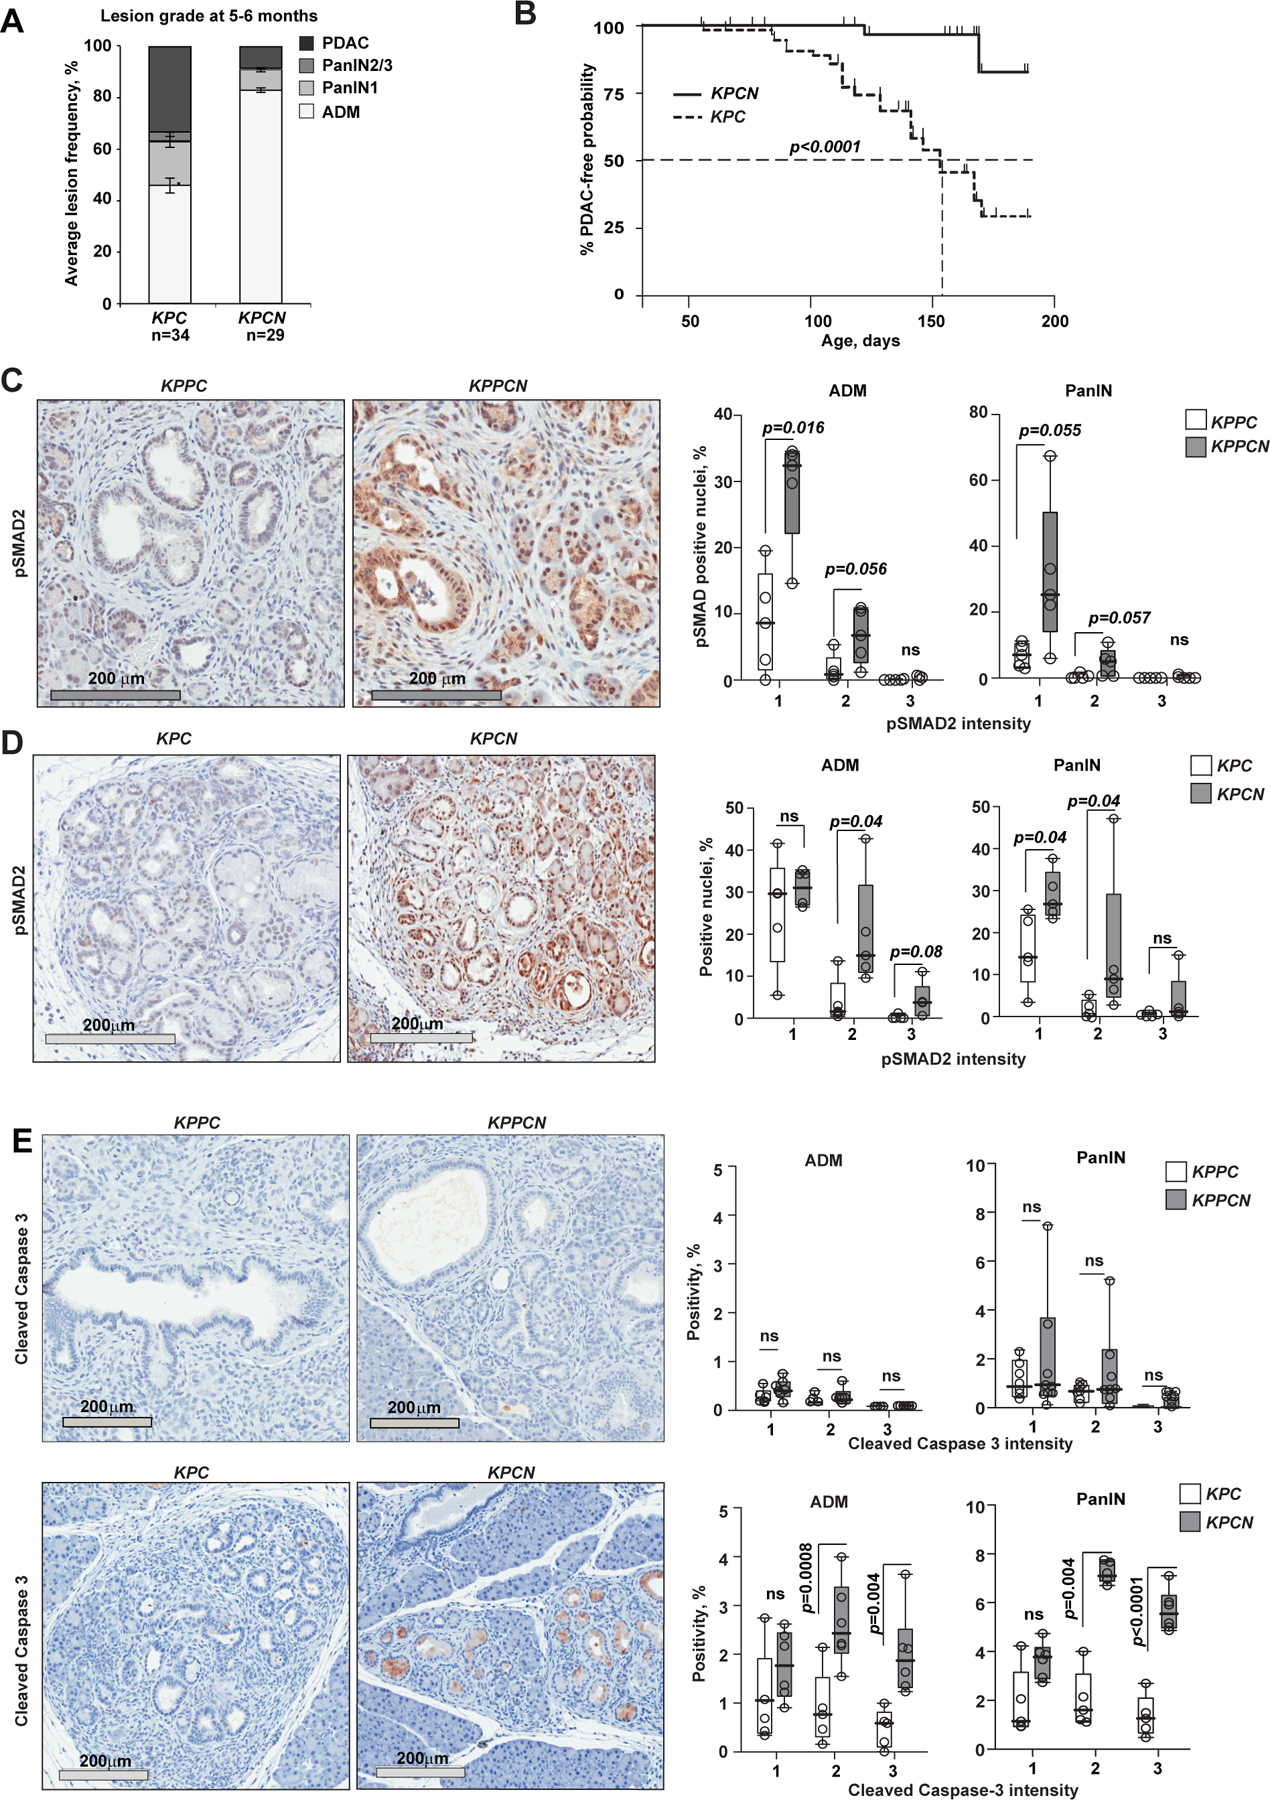
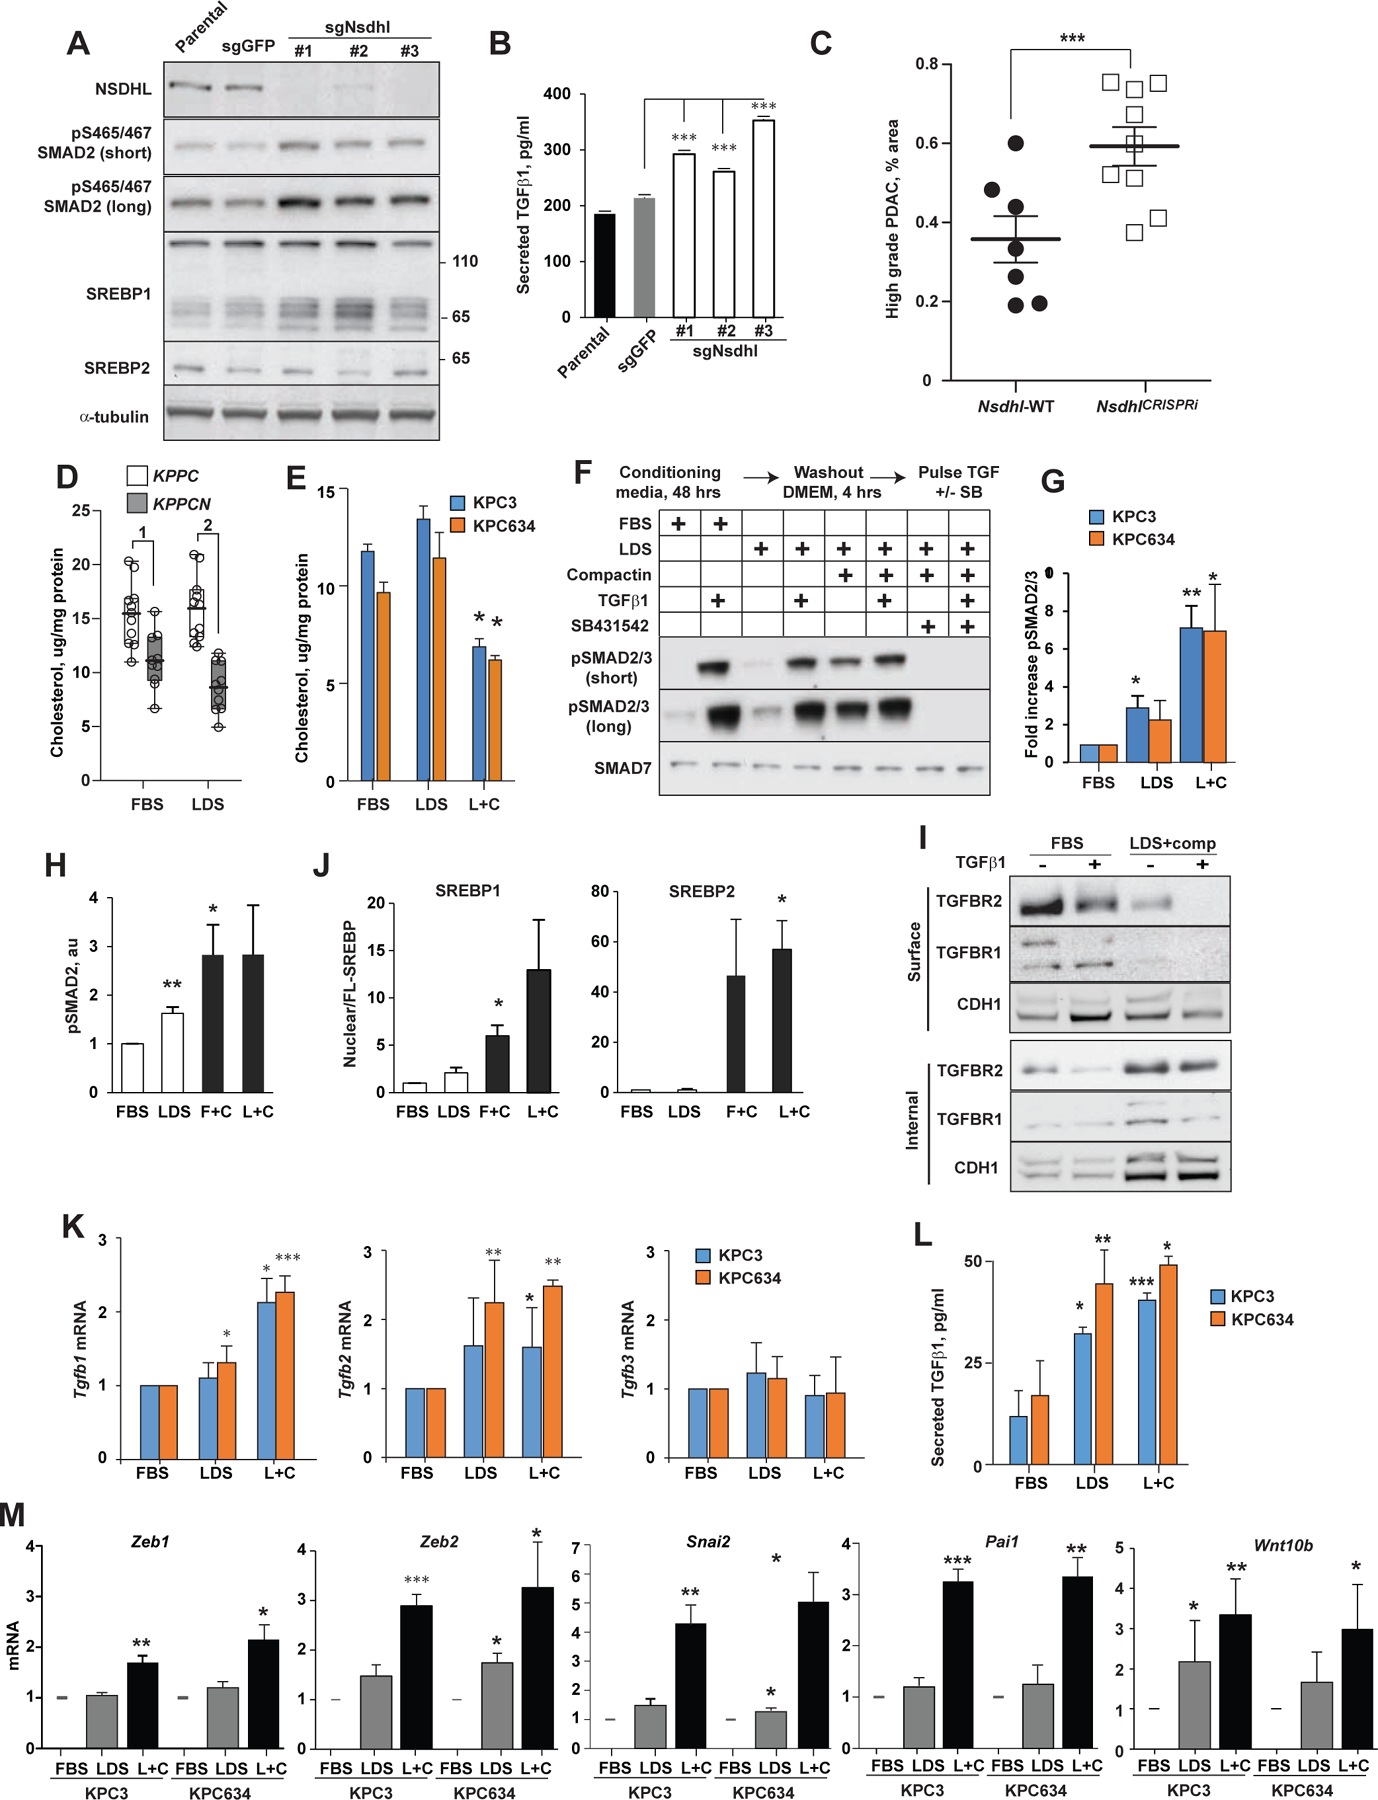
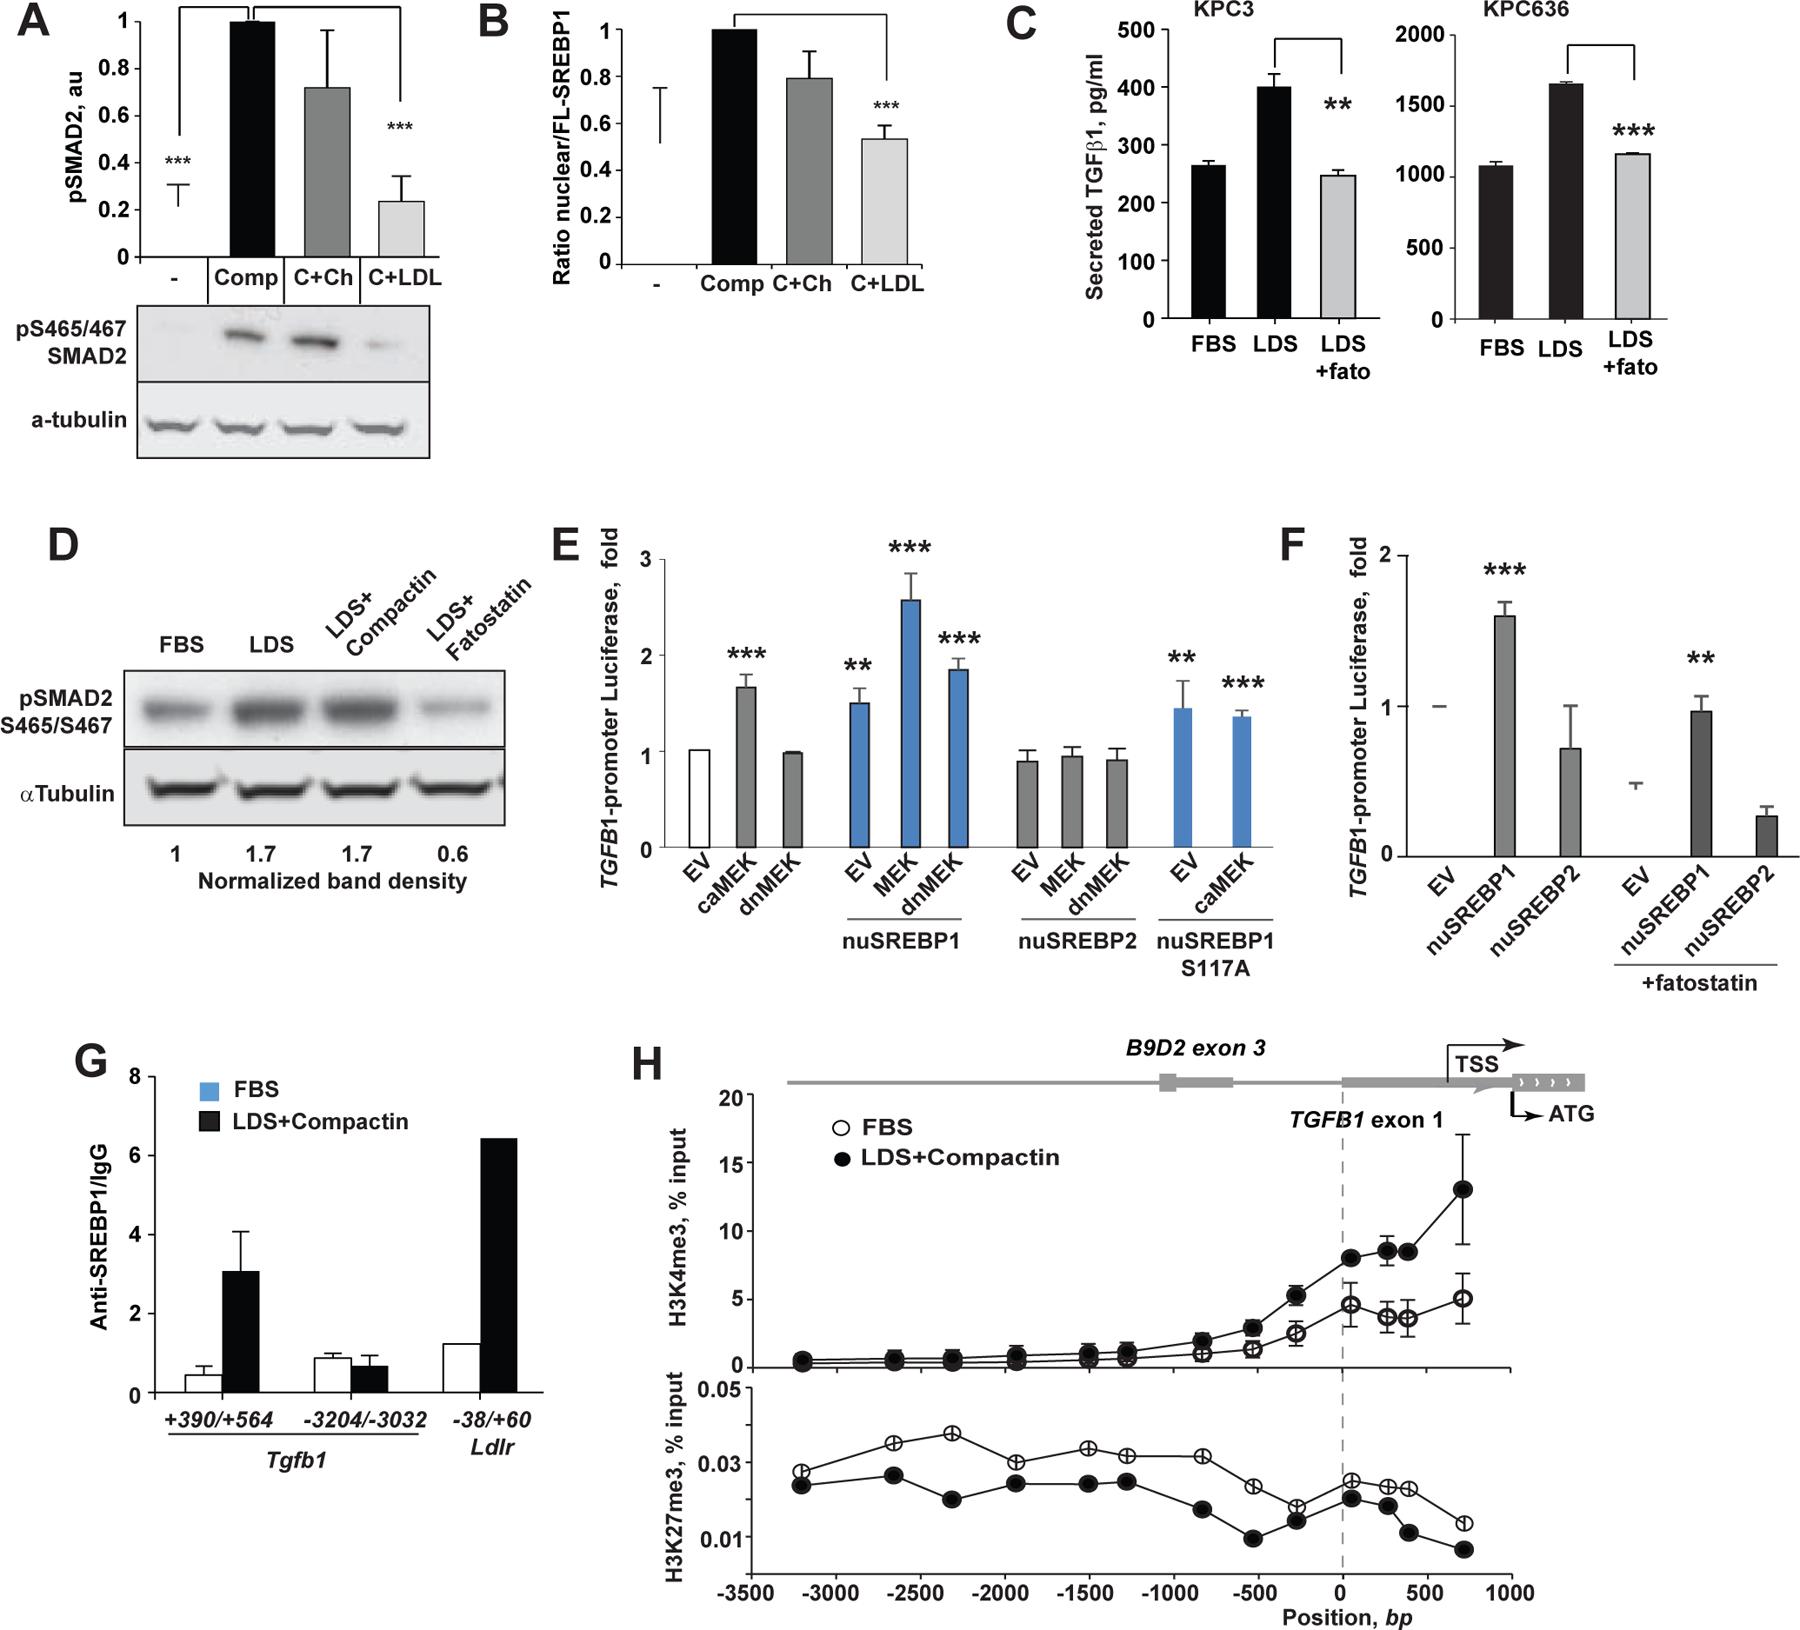
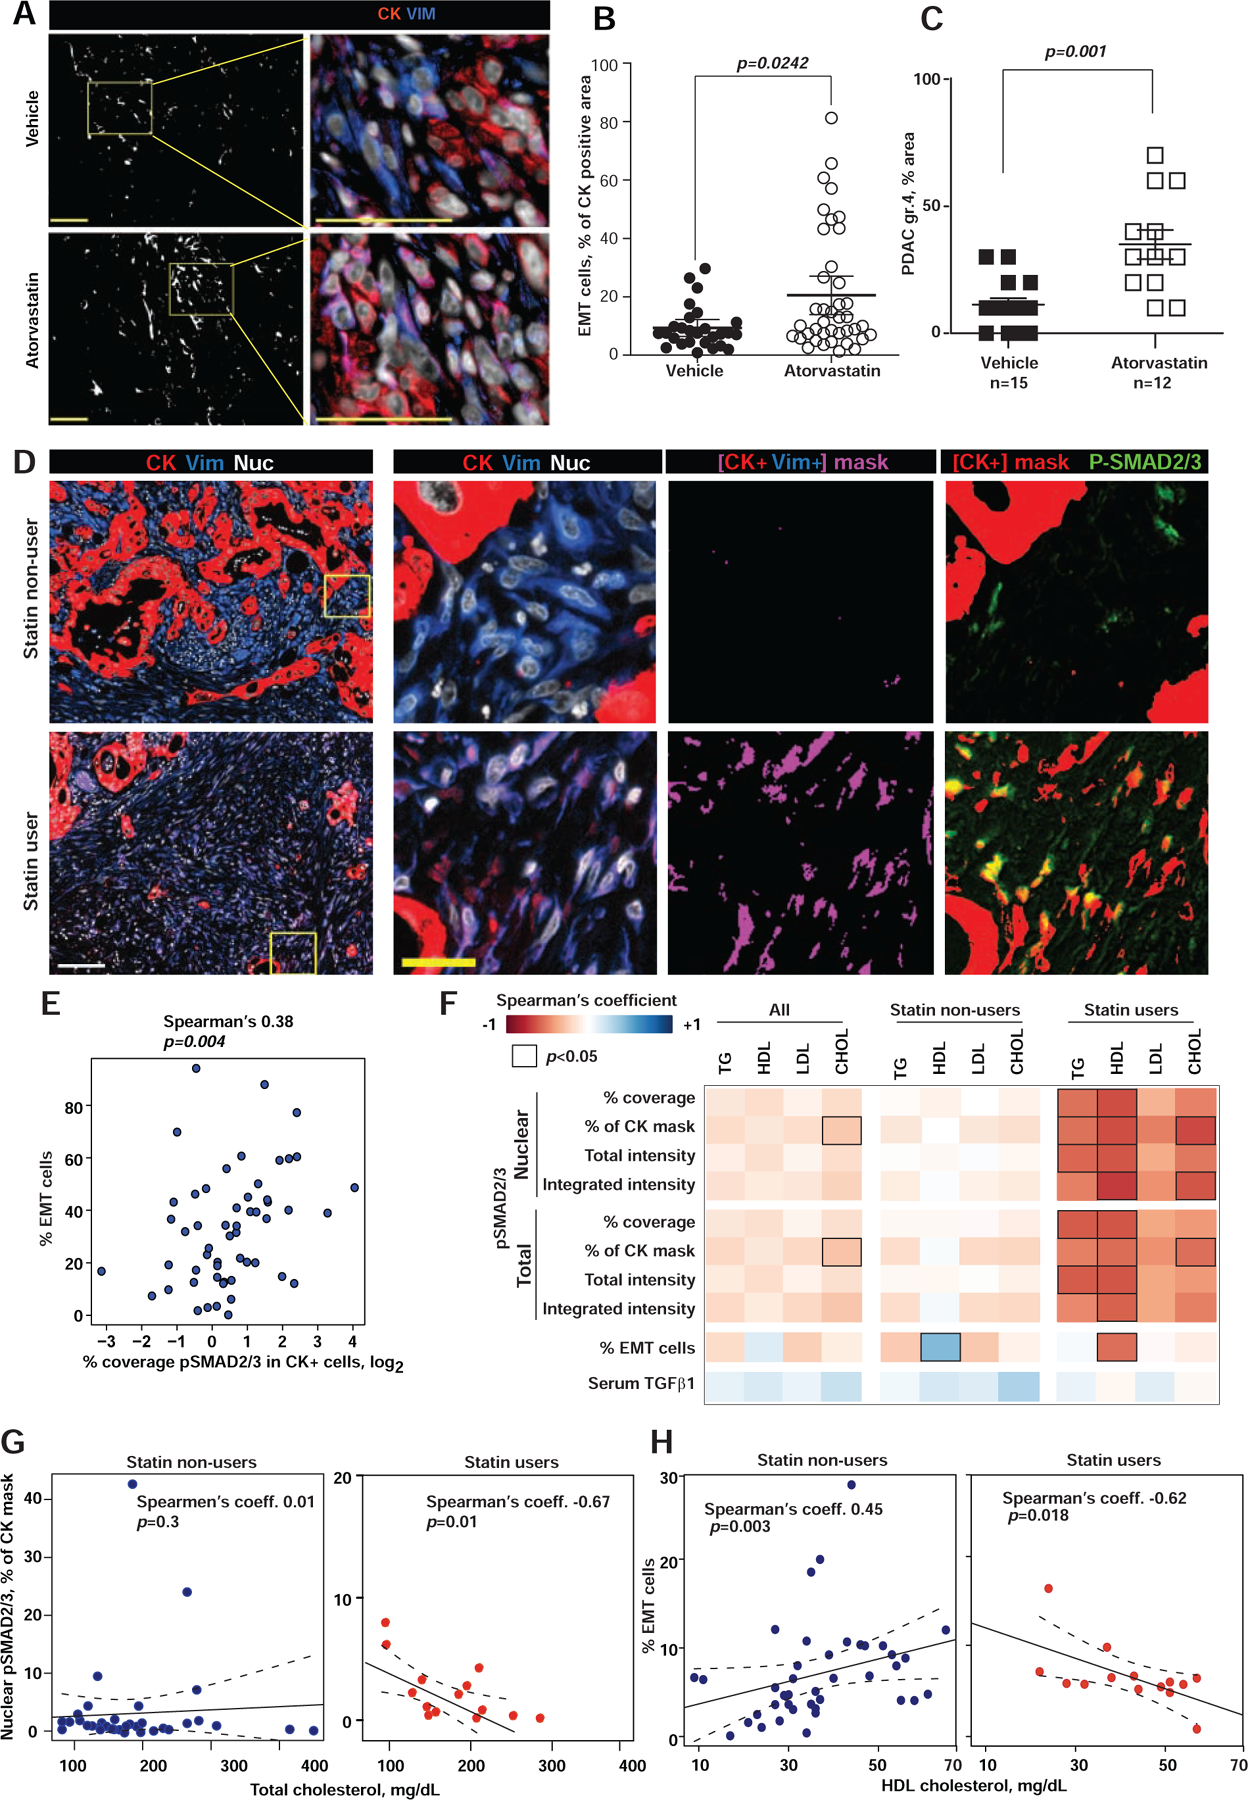
Oncogenic transformation alters lipid metabolism to sustain tumor growth. We define a mechanism by which cholesterol metabolism controls the development and differentiation of pancreatic ductal adenocarcinoma (PDAC). Disruption of distal cholesterol biosynthesis by conditional inactivation of the rate-limiting enzyme Nsdhl or treatment with cholesterol-lowering statins switches glandular pancreatic carcinomas to a basal (mesenchymal) phenotype in mouse models driven by KrasG12D expression and homozygous Trp53 loss. Consistently, PDACs in patients receiving statins show enhanced mesenchymal features. Mechanistically, statins and NSDHL loss induce SREBP1 activation, which promotes the expression of Tgfb1, enabling epithelial-mesenchymal transition. Evidence from patient samples in this study suggests that activation of transforming growth factor β signaling and epithelial-mesenchymal transition by cholesterol-lowering statins may promote the basal type of PDAC, conferring poor outcomes in patients.

Keywords: TGF-β signaling; cholesterol metabolism; epithelial-to-mesenchymal transition; pancreatic cancer.


Conflict of interest statement

Declaration of Interests I.A. served as a consultant for Caris Life Sciences, Inc.

Figures

Figure 1.
Figure 1.. A cholesterol homeostasis gene signature differentiates classic versus basal human PDAC.
(A) Comparison of Hallmark mRNA transcriptional signatures (p-values <0.01; Molecular Signature Database (Liberzon et al., 2015)) between classic and basal PDAC among 76 TCGA cases with an estimated tumor cell fraction greater than 30%. (B) Heat map of normalized expression of representative genes in the “hallmark cholesterol homeostasis” signature for TCGA cases. (C) Comparison of “hallmark cholesterol homeostasis” gene signature in 76 PDAC cases from TCGA. (D) Kaplan-Meier survival of classic and basal PDAC in the TCGA cohorts stratified by high (left) or low (right) enrichment for “hallmark cholesterol homeostasis” mRNA signature. (E) Comparison of “hallmark cholesterol homeostasis” signature, and (F) a heat map of normalized expression of representative genes in the “hallmark cholesterol homeostasis” signature in 85 patient-derived xenografts stratified by expression of human GATA6 mRNA (shown as Z-score above or below zero). In C and E, y-axes illustrate positive and negative enrichment scores comparing basal and classic subtypes of PDAC. Boxplots represent median (black bar) and range (colored panel, 25–75th percentile) of enrichment scores for individual cases shown as red dots for each sample in that subtype. In B and F, Z-scores calculated for each gene are plotted on a red (higher expression) and blue (low expression) scale. Top color bar, subtype of PDAC; mutations, shown as black lines if present. See also Figure S1 and Tables S1–2.
Figure 2.
Figure 2.. Effects of NSDHL deficiency on pancreatic adenocarcinoma development.
(A) Histological grading of pancreatic epithelial lesion in KPPC and KPPCN mice at 4 and 7 weeks of age; p<0.02 for comparisons of PDAC and normal areas. (B) Kaplan-Meier survival of KPPC (n=64) and KPPCN (n=76) mice; p<0.0001, Logrank test. (C) Hematoxylin and eosin stained pancreas sections of KPPC and KPPCN mice at 7 weeks of age. Small foci of grade 4 PDAC (arrow) are seen on the background of nearly normal KPPCN pancreatic tissue with ADM (A) and early PanIN (P) lesions. Scale bars, as shown. (D) Histological grading of pancreatic adenocarcinoma; p<0.01 for grades 1, 3 and 4. (E) Comparison of per cent of grade 4 PDAC areas; p<0.0001. (F) Histological grades of predominant PDAC per animal; p=0.0009. (G) Quantification of CDH1 expression as percent of positive areas per section; p=0.001. (H) Representative pan-cytokeratin (CK) and E-cadherin (CDH1) staining of pancreatic tumor tissues. Arrows, CK-positive PDAC cells. Scale bars, 200 μm. (I) Percentage of EPCAM-positive epithelial cells assessed by FACS in primary KPPC and KPPCN tumors; p=0.0012. (J) Quantification of CK+/VIM+ double positive cells by simultaneous multi-channel immunofluorescence (see images in Figure S2); p=0.016. In all graphs, data are represented as mean±SEM, p-values by Wilcoxon test. See also Figure S2 and Table S3.
Figure 3.
Figure 3.. Conditional knockout of Nsdhl promotes epithelial-to-mesenchymal transition (EMT) switch in mouse pancreatic adenocarcinoma.
(A) UMAP-embedding of transcriptomes of 16,832 single cells isolated from 3 KPPC and 2 KPPCN advanced tumors. Eighteen cell types were identified by graph-based clustering are indicated by color (T-, B- and myeloid cells excluded). (B) Heat map of differentially expressed genes. Z-score normalized expression of the enriched genes for each cluster is shown as a log2-fold change in cells within a cluster relative to all other cells in the dataset. Representative genes are highlighted for each cluster. iCAF, inflammatory cancer associated fibroblasts; myCAF, myofibroblasts; pEMT, partial EMT; Meso, mesothelial. (C) UMAP-embedding with color proportionate to the Log2-normalized expression of indicated gene transcripts. (D) Violin plot of normalized expression of Tgfb1, Cldn4 and Vim in indicated clusters of carcinoma cells; * false discovery rate-adjusted p<10−10 are indicated for significant differences. Y-axis, normalized expression; violin width, cell density in each population. (E) Gene Set Enrichment Analysis (GSEA) of differentially expressed gene signatures in carcinoma cell from clusters 7, 3 and combined EMT (clusters 6,8, and 14). Sources of signatures: H (Hallmark, (Liberzon et al., 2015)); R, www.Reactome.org. Shown are selected signatures with family-wise error rate, FWER<1%. (F) Unsupervised hierarchical clustering of quantified expression of indicated genes. qPCR, quantitative reverse transcription PCR; WB, Western blot. Positive mesenchymal morphology in vitro (EMT) and NSDHL status is indicated above the heatmap by (+). See also Figure S3 and Table S4.
Figure 4.
Figure 4.. NSDHL deficiency protects from pancreatic adenocarcinoma development in Trp53+/− heterozygotes.
(A) Enumeration of pancreatic epithelial lesion by grade per section in KPC and KPCN mice aged 5–6 months; p=0.035 for PDAC (Fisher’s exact test); p=0.02 for PanIN2/3; p=0.0006 for ADM, Wilcoxon rank-sum test; error bars, SEM. (B) Kaplan-Meier representation of PDAC-free survival of KPC (n=34) and KPCN (n=37) mice. p<0.0001, logrank test. (C, D) Activated TGFβ pathway signaling in NSDHL-deficient pancreatic lesions with homozygous (C) and heterozygous (D) Trp53 knockout as assessed by phosphorylated SMAD2 immunohistochemistry. Top, 5–6 months old KPC and KPCN mice; bottom, 5 week old KPPC and KPPCN pancreatic lesions. Right panel, quantification of pSMAD2-positive nuclei in acinar-to-ductal metaplasia (ADM) and pancreatic intraepithelial neoplasm (PanIN) lesions. (E) Cleaved caspase 3 in pancreatic ADM and PanIN lesions. In C-E, staining intensity was quantified separately in ADM and PanIN lesions; p-values are calculated by Wilcoxon test; ns, not significant; data are represented as boxplots: median (black bar), box (25% to 75% confidence interval), whiskers (full range of measurements). See also Figure S4.
Figure 5.
Figure 5.. Cholesterol depletion activates TGFβ pathway signaling in PDAC cells.
(A) NSDHL inactivation in well-differentiated KPC3 PDAC cells by CRISPRi is confirmed by absence of NSDHL band on Western blot of total cellular lysates; KPC3 parental cells and GFP-targeted gRNA used as controls. (B) Secreted TGFB1 as determined by ELISA using 48 hour supernatants. Shown, averaged results from 3 independent repeats; error bars, SEM. (C) Histological grading of glandular (grades 1–2) versus solid (grades 3–4) tumor areas in tumors generated via orthotopic implantation of KPC3wt or KPC3 NsdhlCRISPRi cells; p=0.007, two-way Student t-test. Symbols represent individual tumors; black bars, mean±SEM. (D) Cholesterol level in KPPC (n=10) and KPPCN (n=10) clones grown for 48 hours in FBS or LDS media; (1) p=0.004; (2) p=0.0001, Wilcoxon test. Boxplots represent median (black bar) and full range of measurements. (E) Cholesterol levels in PDAC cells conditioned for 48 hours as indicated; L+C, 5%LDS with 1 μM compactin. (F) Representative Western blot of phosphorylated pSMAD2 (Ser465/467) and pSmad3 (Ser423/425) in KPC3 cells cultured for 48 hours in fetal bovine serum (FBS), lipid depleted serum (LDS), or LDS with 1 μM of compactin (L+C) followed by incubation in serum-free DMEM for 4 hours. Indicated samples were treated with TGFβ1 at 10 ng/ml for 30 minutes, and/or SB431542 at 25 μM for 1 hour. (G) Summary results of levels of phosphorylated pSMAD2(Ser465/467) and pSmad3 (Ser423/425) in cholesterol depleted PDAC cells. Results from 3 independent experiments normalized to α-tubulin are shown. (H) Phosphorylated pSMAD2(Ser465/467) in human Capan-2 carcinoma cells conditioned for 48 hours in FBS, LDS with or without 1 μM compactin. Summary results from 3 independent experiments normalized to α-tubulin are shown. (J) Increased nuclear SREBP1 and SREBP2 in Capan-2 cells as in H. (I) Surface versus internalized pools of TGFBR1 and TGFBR2 in KPC3 cells conditioned for 48 hours in 5% FBS or in 5% LDS with 1 μM compactin. Biotinylated (surface) and non-biotinylated (internalized) proteins were affinity separated using streptavidin-agarose beads. (K) Levels of Tgfb1, Tgfb2 and Tgfb3 mRNA as assessed by qRT-PCR, in cells grown in indicated media for 48 hrs. (L) ELISA measurement of secreted TGFβ1 in supernatants of KPC3 cells conditioned in indicated media for 48 hrs; (M) Expression of Zeb2, Tgfb1 and Wnt10b mRNA as assessed by qRT-PCR in KPC3 and KPC634 PDAC cells cultured for 48 hours in media supplemented with FBS, LDS or LDS+compactin (1 μM). In graphs B, E, G-J and K-M, statistical p-values by two-way Student t-test are indicated as: *, <0.05, **, <0.01, ***, <0.001. See also Figure S5.
Figure 6.
Figure 6.. Cholesterol-sensitive transcription factor SREBP1 regulates Tgfb1 expression.
(A) Supplementation of serum-free KPC3 cultures with LDL (100 μg/ml), but not with 50 μM ethanol-solubilized cholesterol, reverses pSMAD2 induction by compactin. Shown are results of 3 independent repeats and a representative panel below. (B) Compactin-induced activation of SREBP1 is reversed by addition of LDL quantified as ratio of nuclear and full length (FL) protein. (C) Secreted TGFβ1 suppression by SREBP inhibitor. Fatostatin (20 μM) was added to KPC3 cells grown in the indicated media for 48 hours. Averaged results of 3 independent ELISA assays are shown. (D) Representative Western blot of pSMAD2 of cellular lysates corresponding to (C). (E) Human TGFB1 promoter-dependent luciferase reporter activity following co-transfection into HEK293T cells with plasmids expressing nuclear fragments of SREBP1 (aa 1–480), SREBP2 (aa 1–473), constitutively active MEK1 (S218D/S222D), or dominant negative MEK1 mutant (S218A/S222A). Empty vectors (EV) were used as negative controls. (F) TGFB1-luciferase reporter activity in human PDAC cells MiaPaCa2 co-transfected with nuclear SREBP1 or SREBP2. Fatostatin at 10 μM was used to block the endogenous SREBP activation. (G) Chromatin immunoprecipitation and quantitative PCR (ChIP-qPCR) determination of genomic Tgfb1 DNA binding (amplicon +390 bp to +564 bp) by the endogenous SREBP1 in KPC3 cells conditioned for 48 hours in FBS, or LDS+ 1 μM compactin. Amplicon −3204 bp to −3032 bp distant to TSS served as negative control, whereas a canonical SREBP1 binding site in Ldlr promoter (−38 bp to +60 bp) served as a positive control for SREBP1 activity. (H) Increased association of open chromatin (H3K4me3) and reduced association of repressed chromatin marks (H3K27me3) with the proximal Tgfb1 promoter of cholesterol-depleted KPC3 cells as determined by ChIP-qPCR. The map of genomic Tgfb1 locus is drawn to scale. Data were pooled from two independent experiments. In all figures, data are represented as mean±SEM, p-values determined by independent two-sample Student t-test: *, p<0.05; **, p<0.01, ***, p<0.001. See also Figure S6.
Figure 7.
Figure 7.. Inhibition of cholesterol biosynthesis with statins promotes basal PDAC development.
(A) Epithelial (cytokeratin, CK, red) and mesenchymal (vimentin, VIM, blue) compartments in murine pancreatic KPPC tumors. Digital mask in white corresponds to CK+/Vim+ areas, used to quantify EMT cells (magenta). Nuclei are in gray. Scale bars = 100 μm. (B) Graph shows EMT areas (dot represent single images). (C) Percent area with grade 4 PDAC in KPPC mice treated with atorvastatin (open symbols) or vehicle (closed symbols). (D) From left to right, first column shows Epithelial (CK, red), mesenchymal (VIM, blue) and nuclei (grey) compartments in human PDAC tissue. The following three columns correspond to magnifications of the yellow boxed regions. Third column depicts EMT areas (i.e., CK+/Vim+ in magenta masks). Last column includes CK+ masks in red, which were overplayed with immunofluorescent pSMAD2/3 (Green) to highlight co-localization areas (yellow). Scale bars: white=100 μm, yellow=25 μm. (E) Spearman’s correlations of pSMAD2/3 and the percent of CK+/VIM+ cells (EMT-PDAC cells). (F) Heat map of Spearman’s correlation coefficient for nuclear and total pSMAD2/3 and serum lipids, correlations with p<0.05 are outlined. (G, H) Correlation of total serum cholesterol with nuclear pSMAD2/3 expression in PDAC cells (G) and percent of EMT-PDAC cells (H) in statin users. In figures B and C, data are represented as mean±SEM, p-values determined by Mann-Whitney test with indicated p-values. See also Figure S7.

Comment in

References

    1. Adams CM, Reitz J, De Brabander JK, Feramisco JD, Li L, Brown MS, and Goldstein JL (2004). Cholesterol and 25-hydroxycholesterol inhibit activation of SREBPs by different mechanisms, both involving SCAP and Insigs. The Journal of biological chemistry 279, 52772–52780. - PubMed
    1. Adams CR, Htwe HH, Marsh T, Wang AL, Montoya ML, Subbaraj L, Tward AD, Bardeesy N, and Perera RM (2019). Transcriptional control of subtype switching ensures adaptation and growth of pancreatic cancer. eLife 8. - PMC - PubMed
    1. Aiello NM, Brabletz T, Kang Y, Nieto MA, Weinberg RA, and Stanger BZ (2017). Upholding a role for EMT in pancreatic cancer metastasis. Nature 547, E7–E8. - PMC - PubMed
    1. Anders S, Pyl PT, and Huber W (2015). HTSeq--a Python framework to work with high-throughput sequencing data. Bioinformatics 31, 166–169. - PMC - PubMed
    1. Aung KL, Fischer SE, Denroche RE, Jang GH, Dodd A, Creighton S, Southwood B, Liang SB, Chadwick D, Zhang A, et al. (2018). Genomics-Driven Precision Medicine for Advanced Pancreatic Cancer: Early Results from the COMPASS Trial. Clinical cancer research : an official journal of the American Association for Cancer Research 24, 1344–1354. - PMC - PubMed

Publication types

MeSH terms

Substances