. 2020 Dec 7;30(23):4563-4578.e4.
doi: 10.1016/j.cub.2020.08.092. Epub 2020 Sep 24.

A Putative Bet-Hedging Strategy Buffers Budding Yeast against Environmental Instability

Affiliations

A Putative Bet-Hedging Strategy Buffers Budding Yeast against Environmental Instability

Laura E Bagamery et al. Curr Biol. .

Abstract

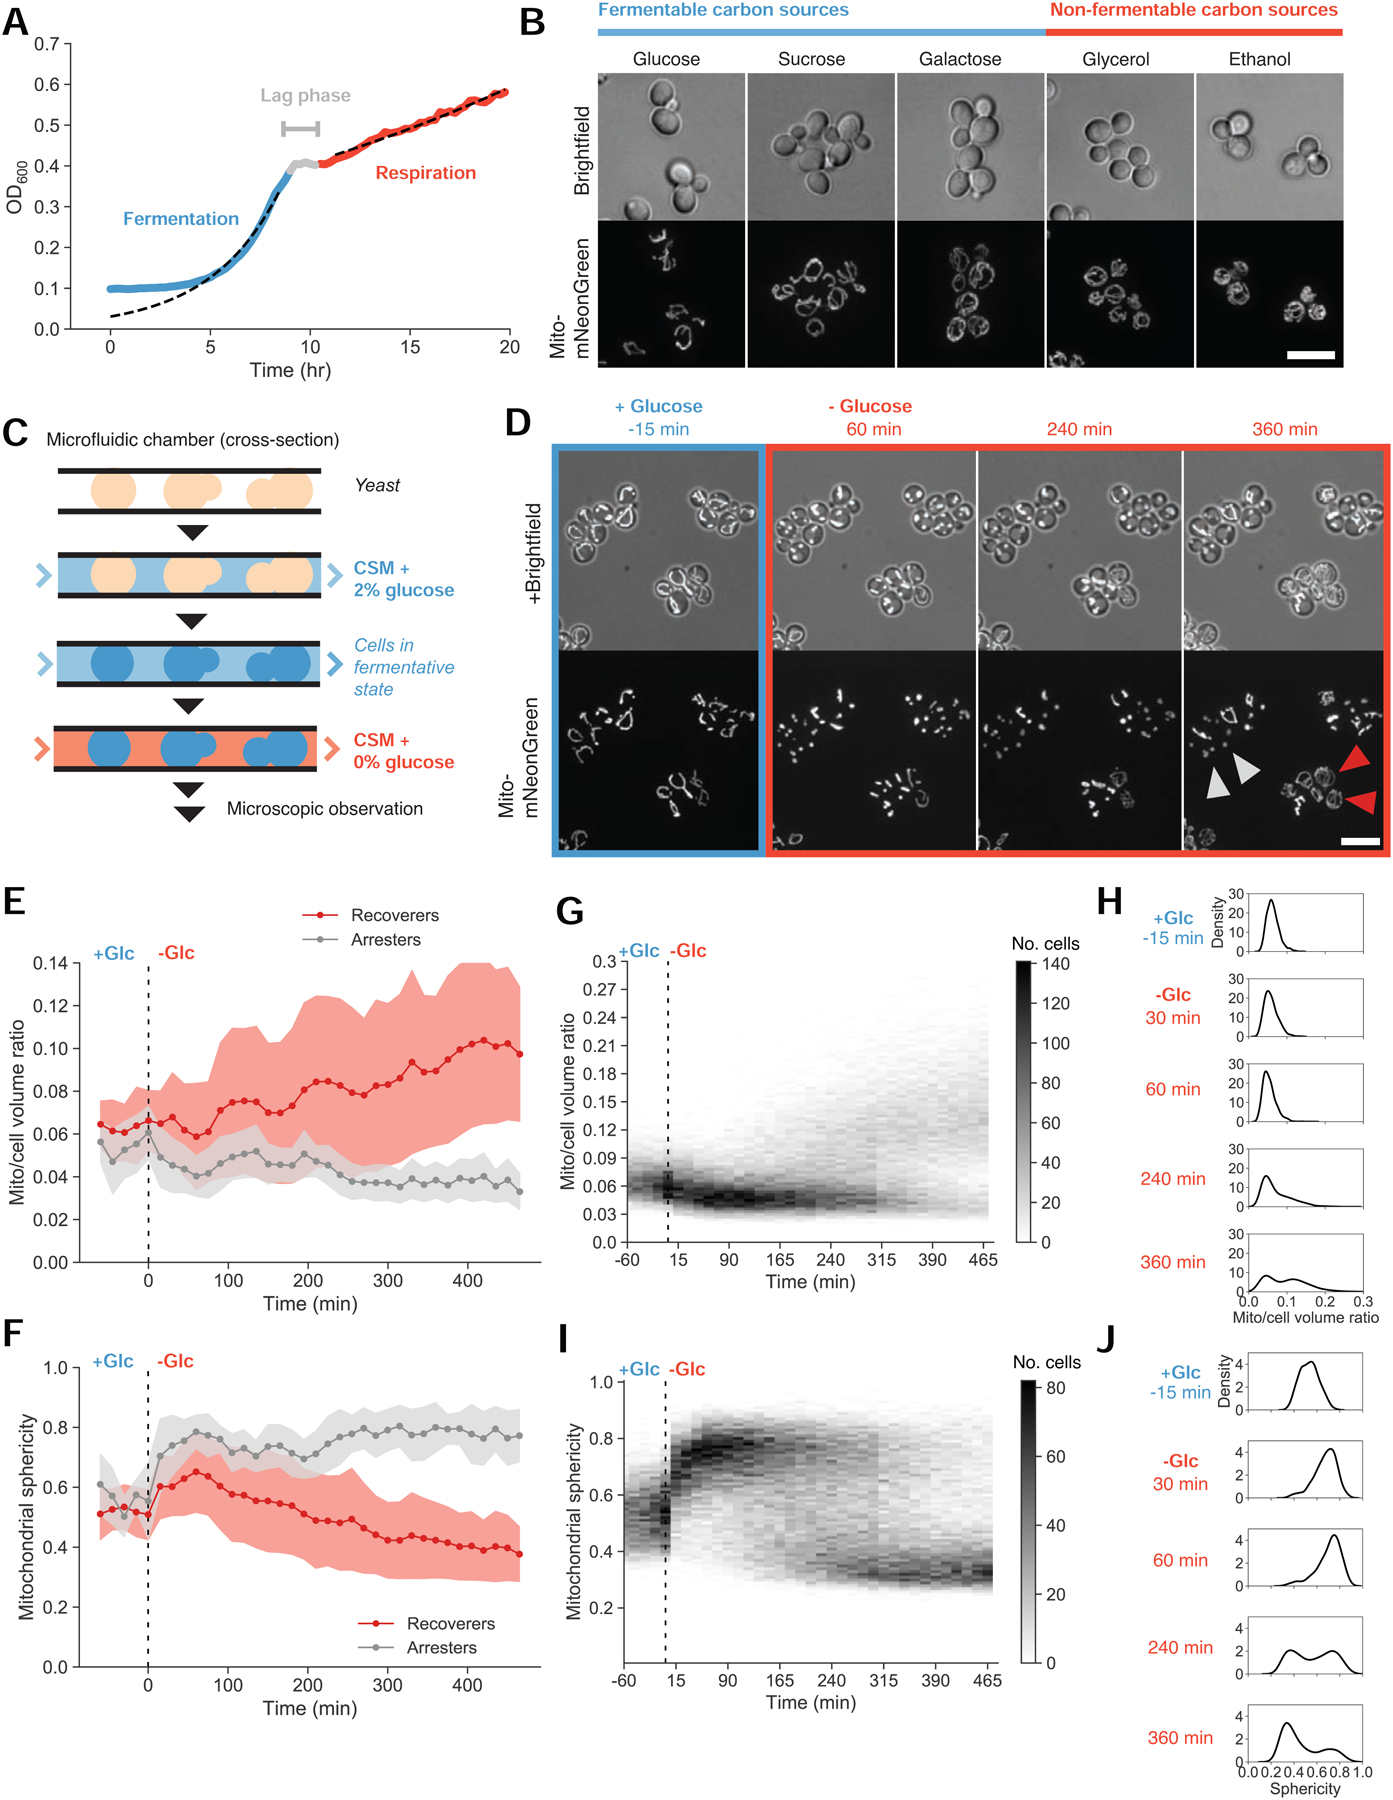
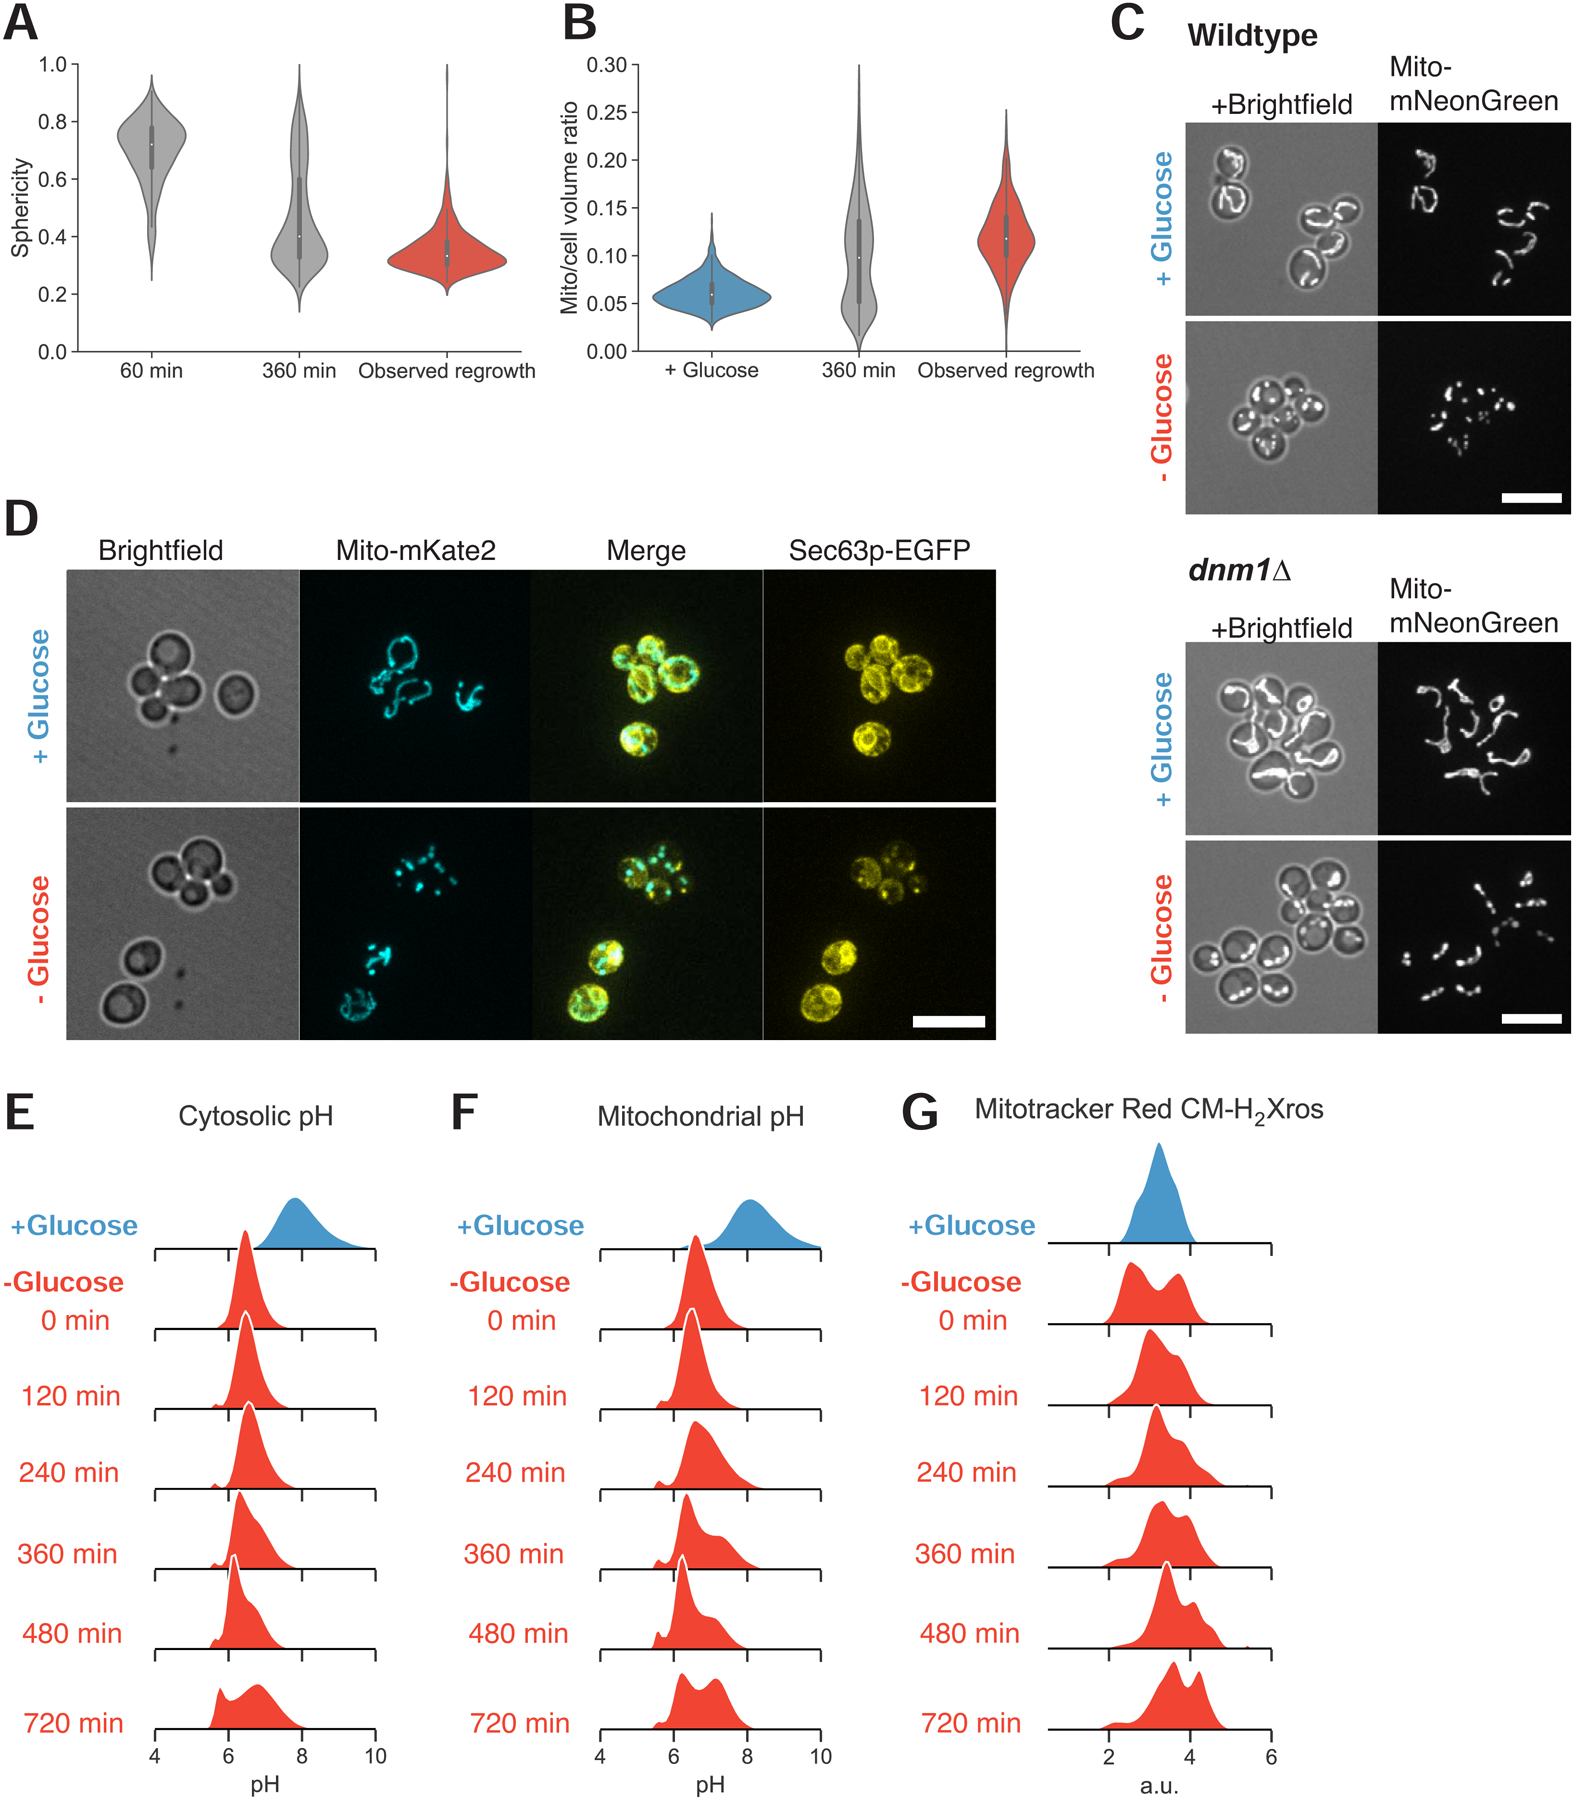
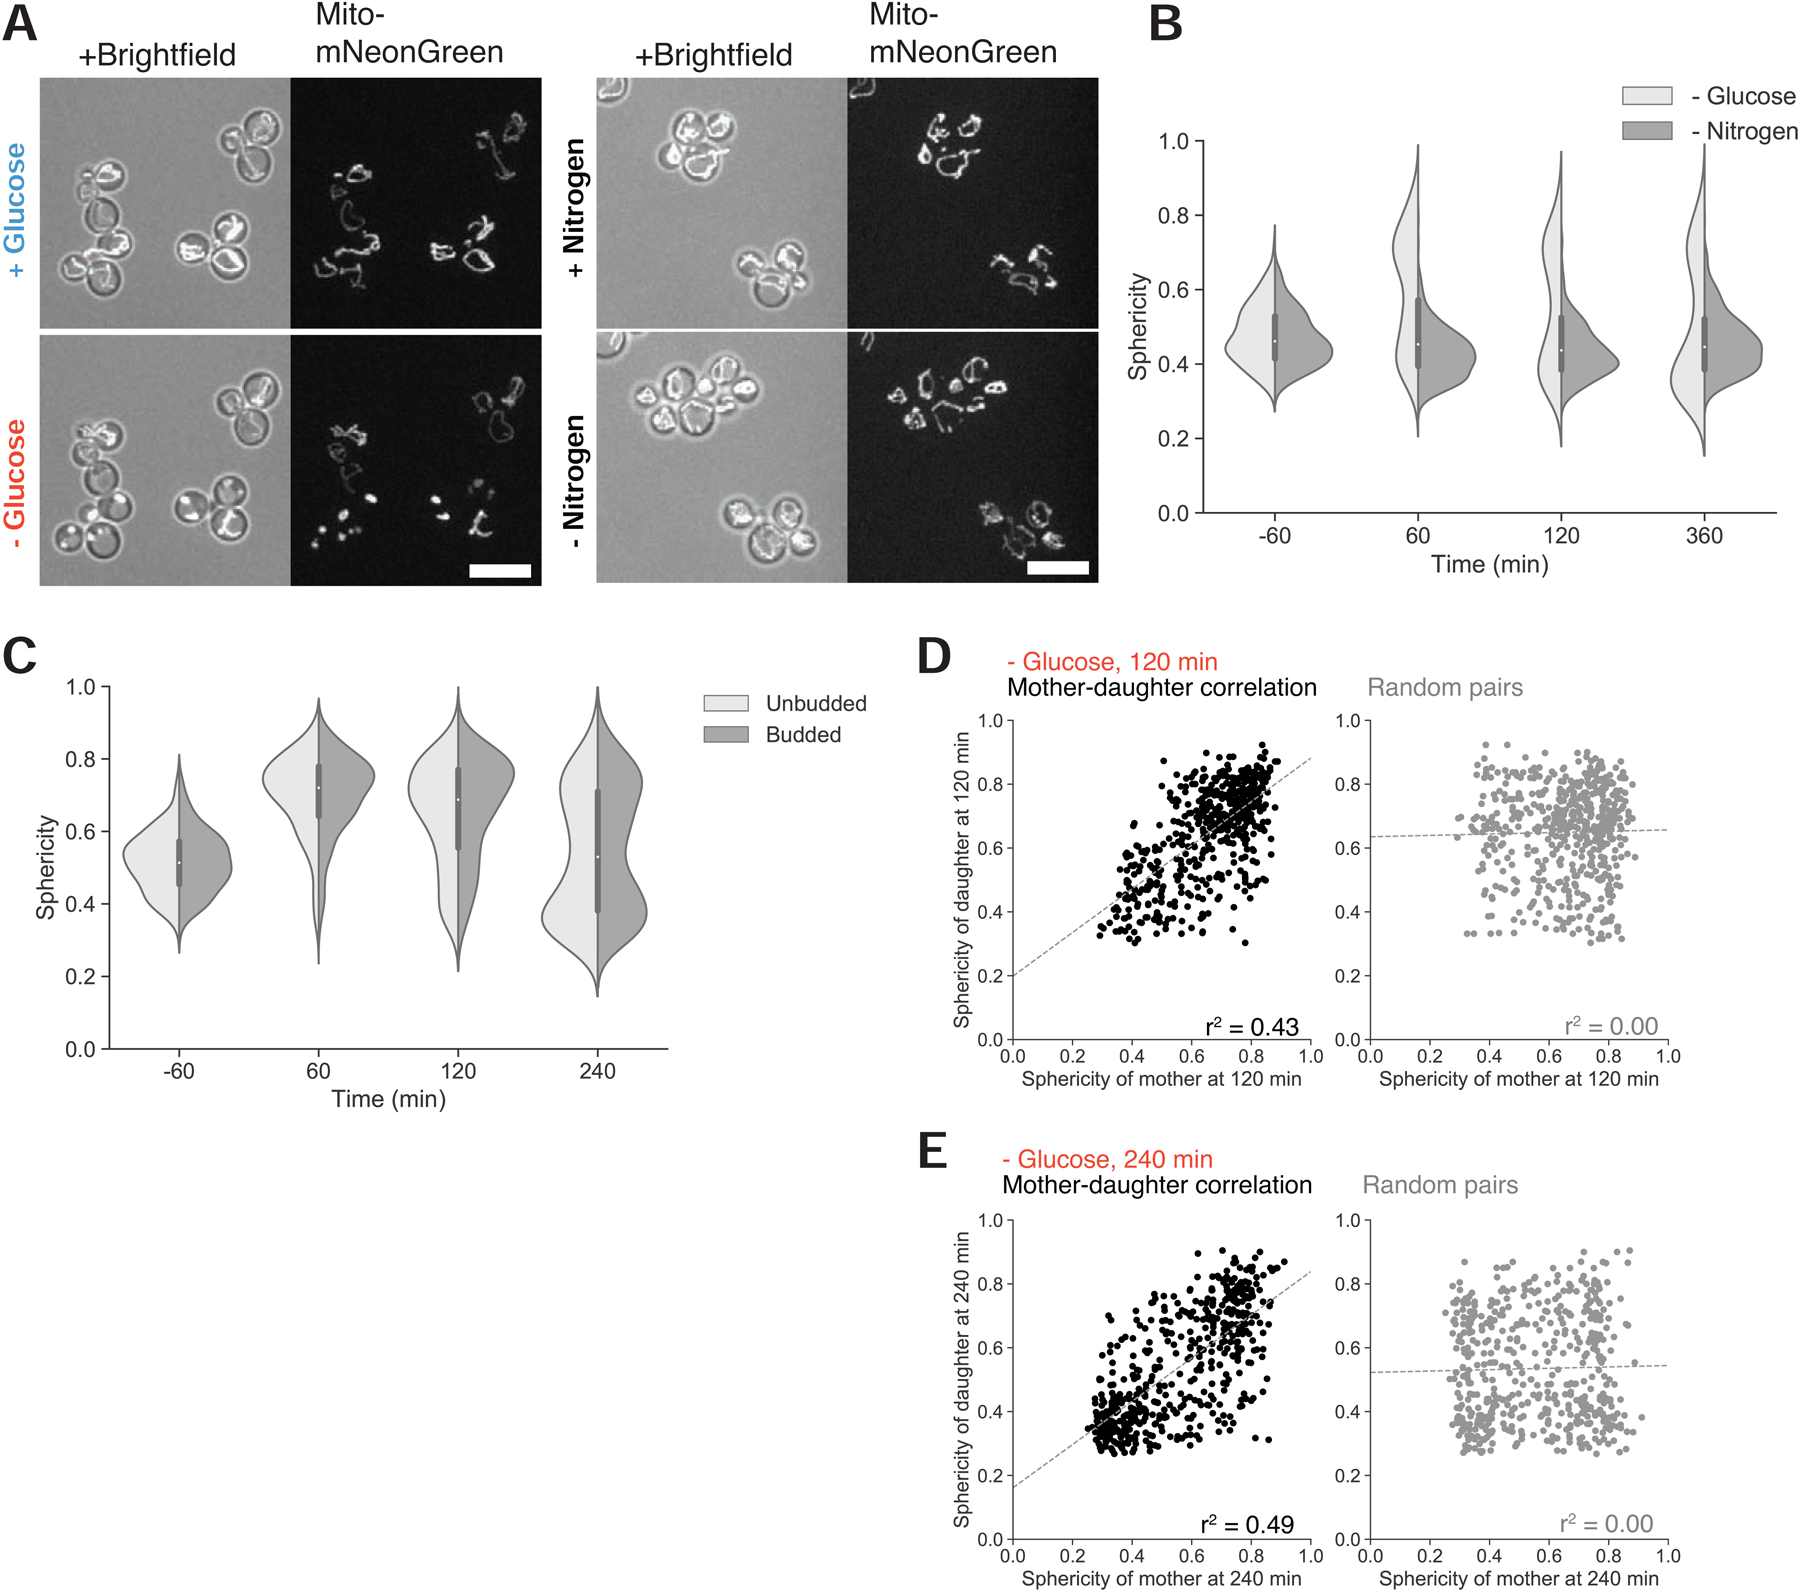
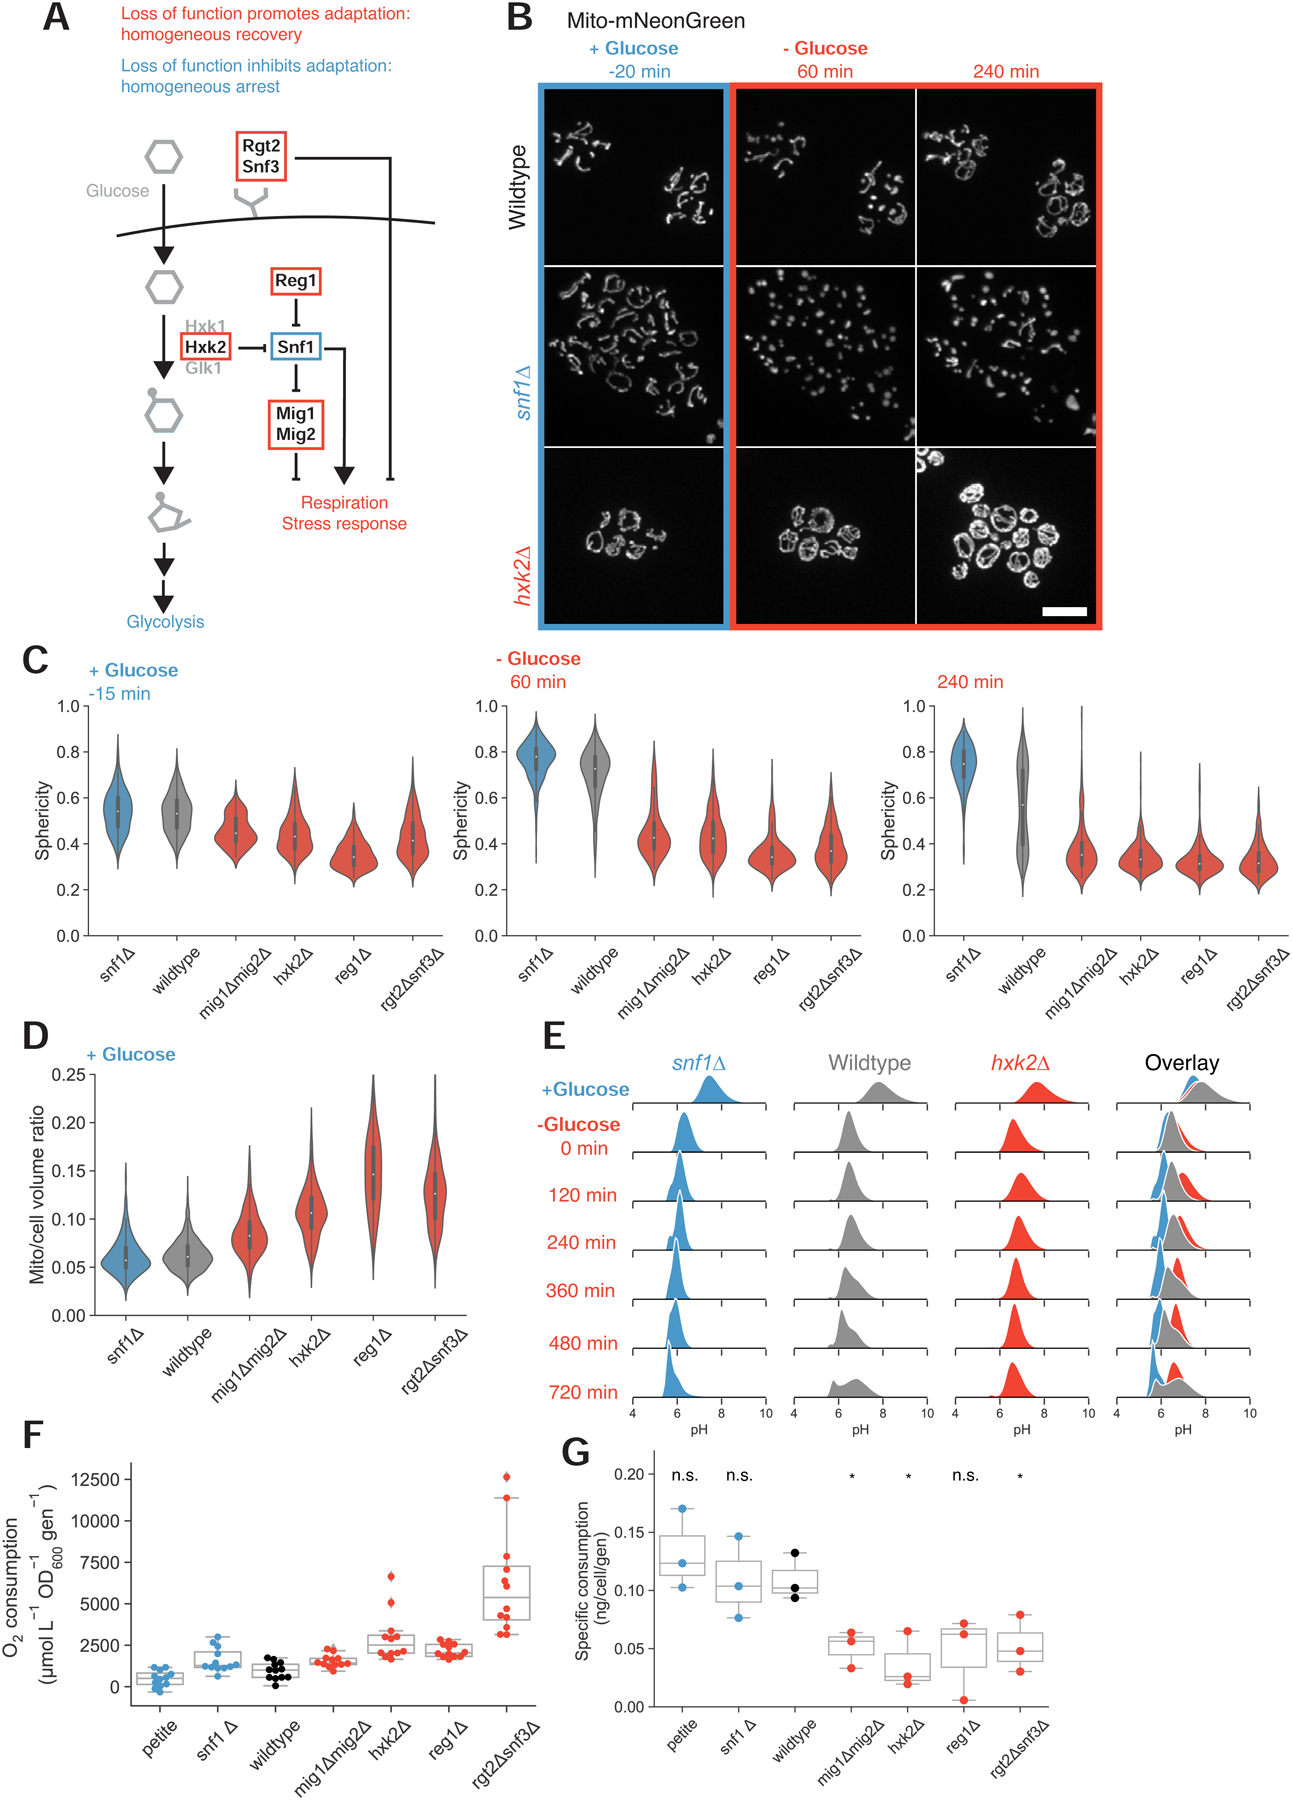
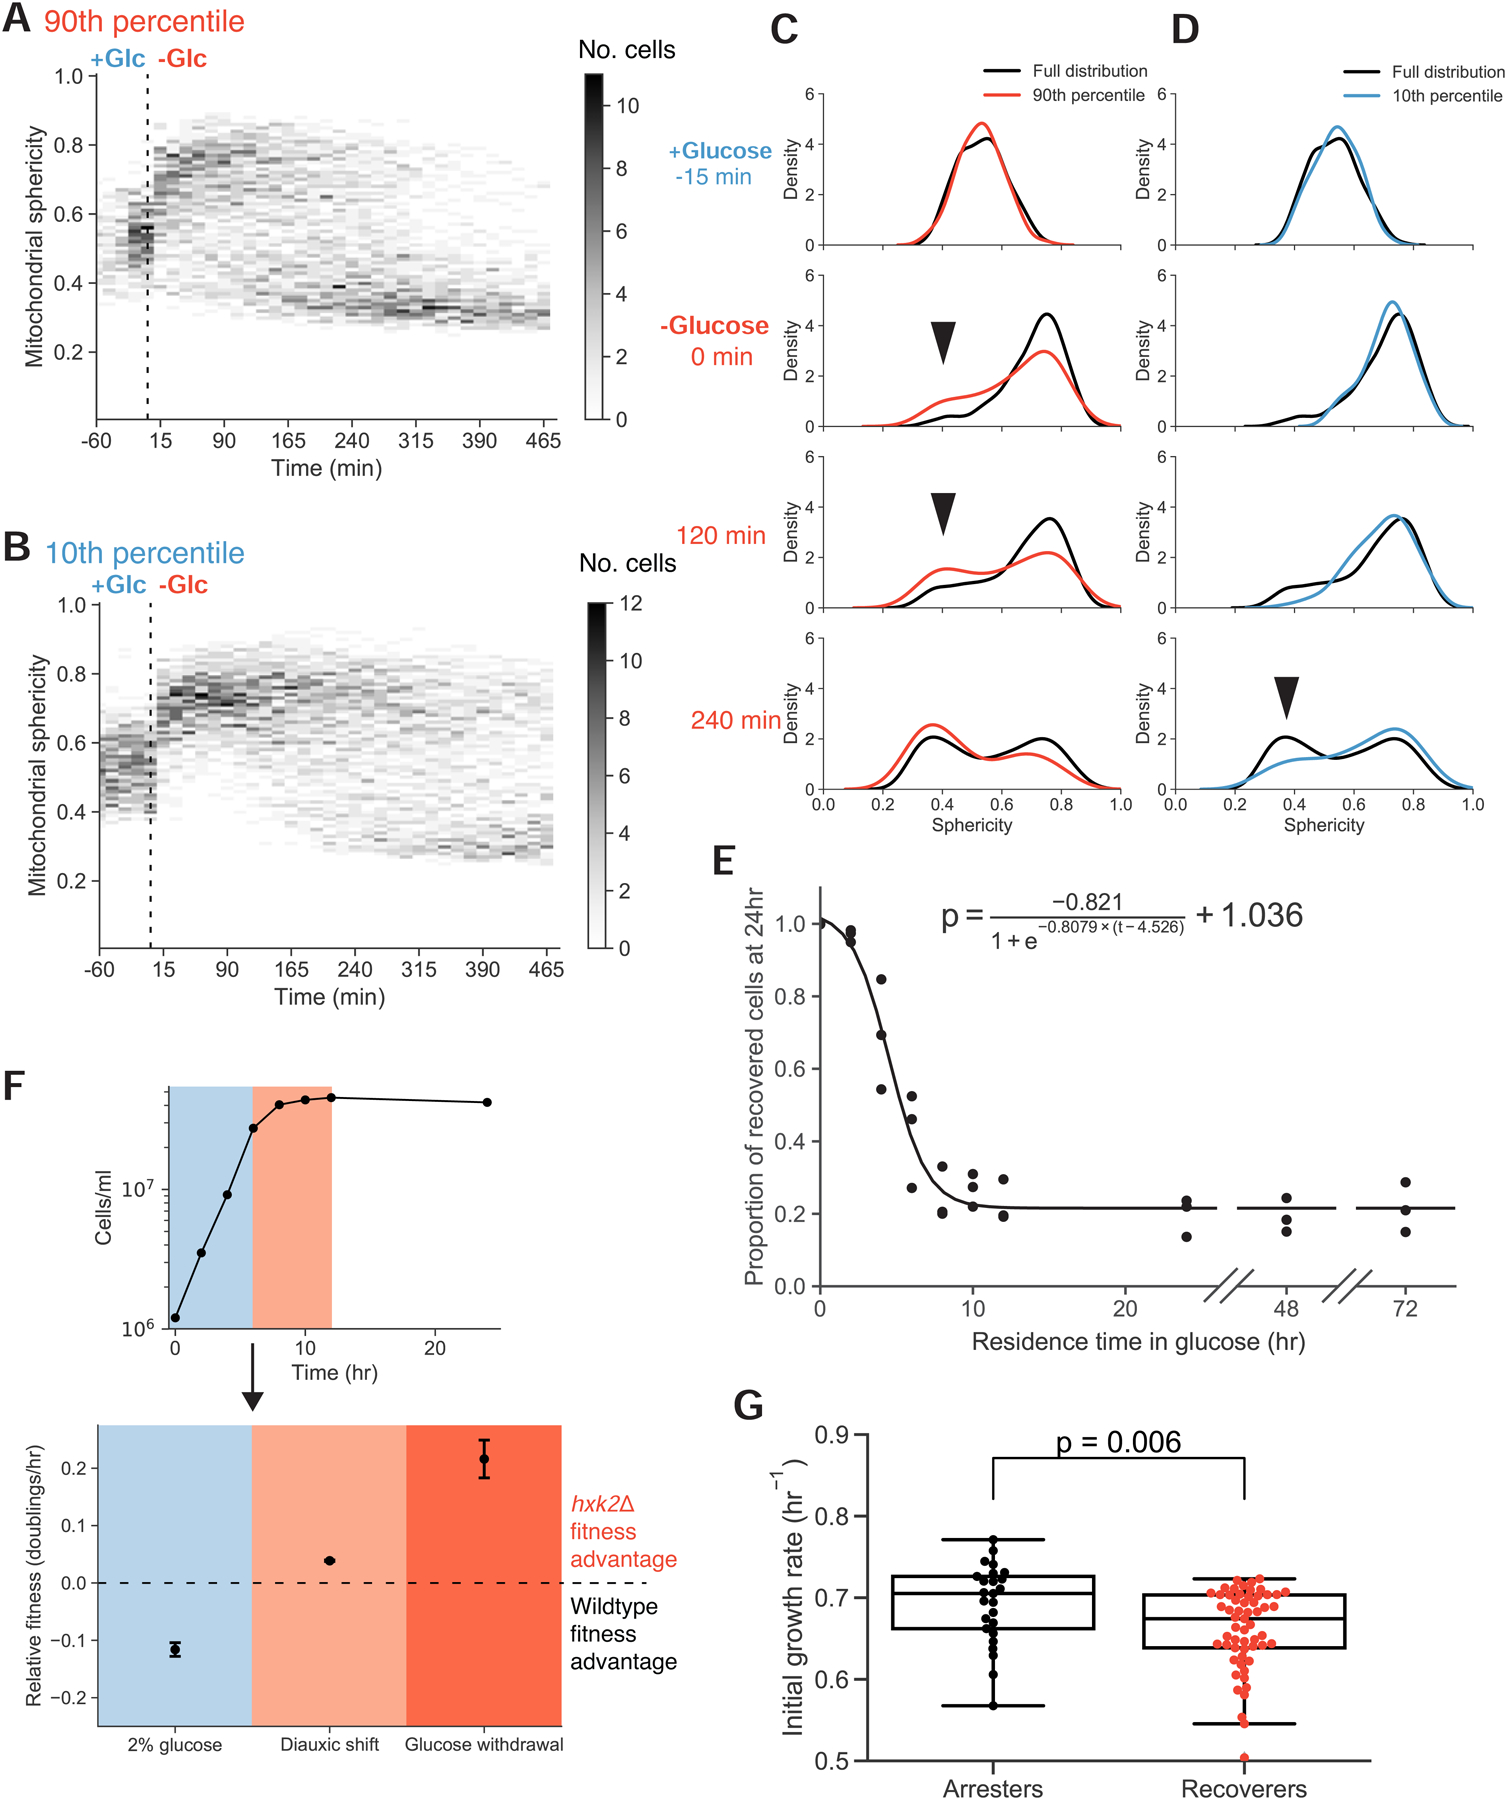
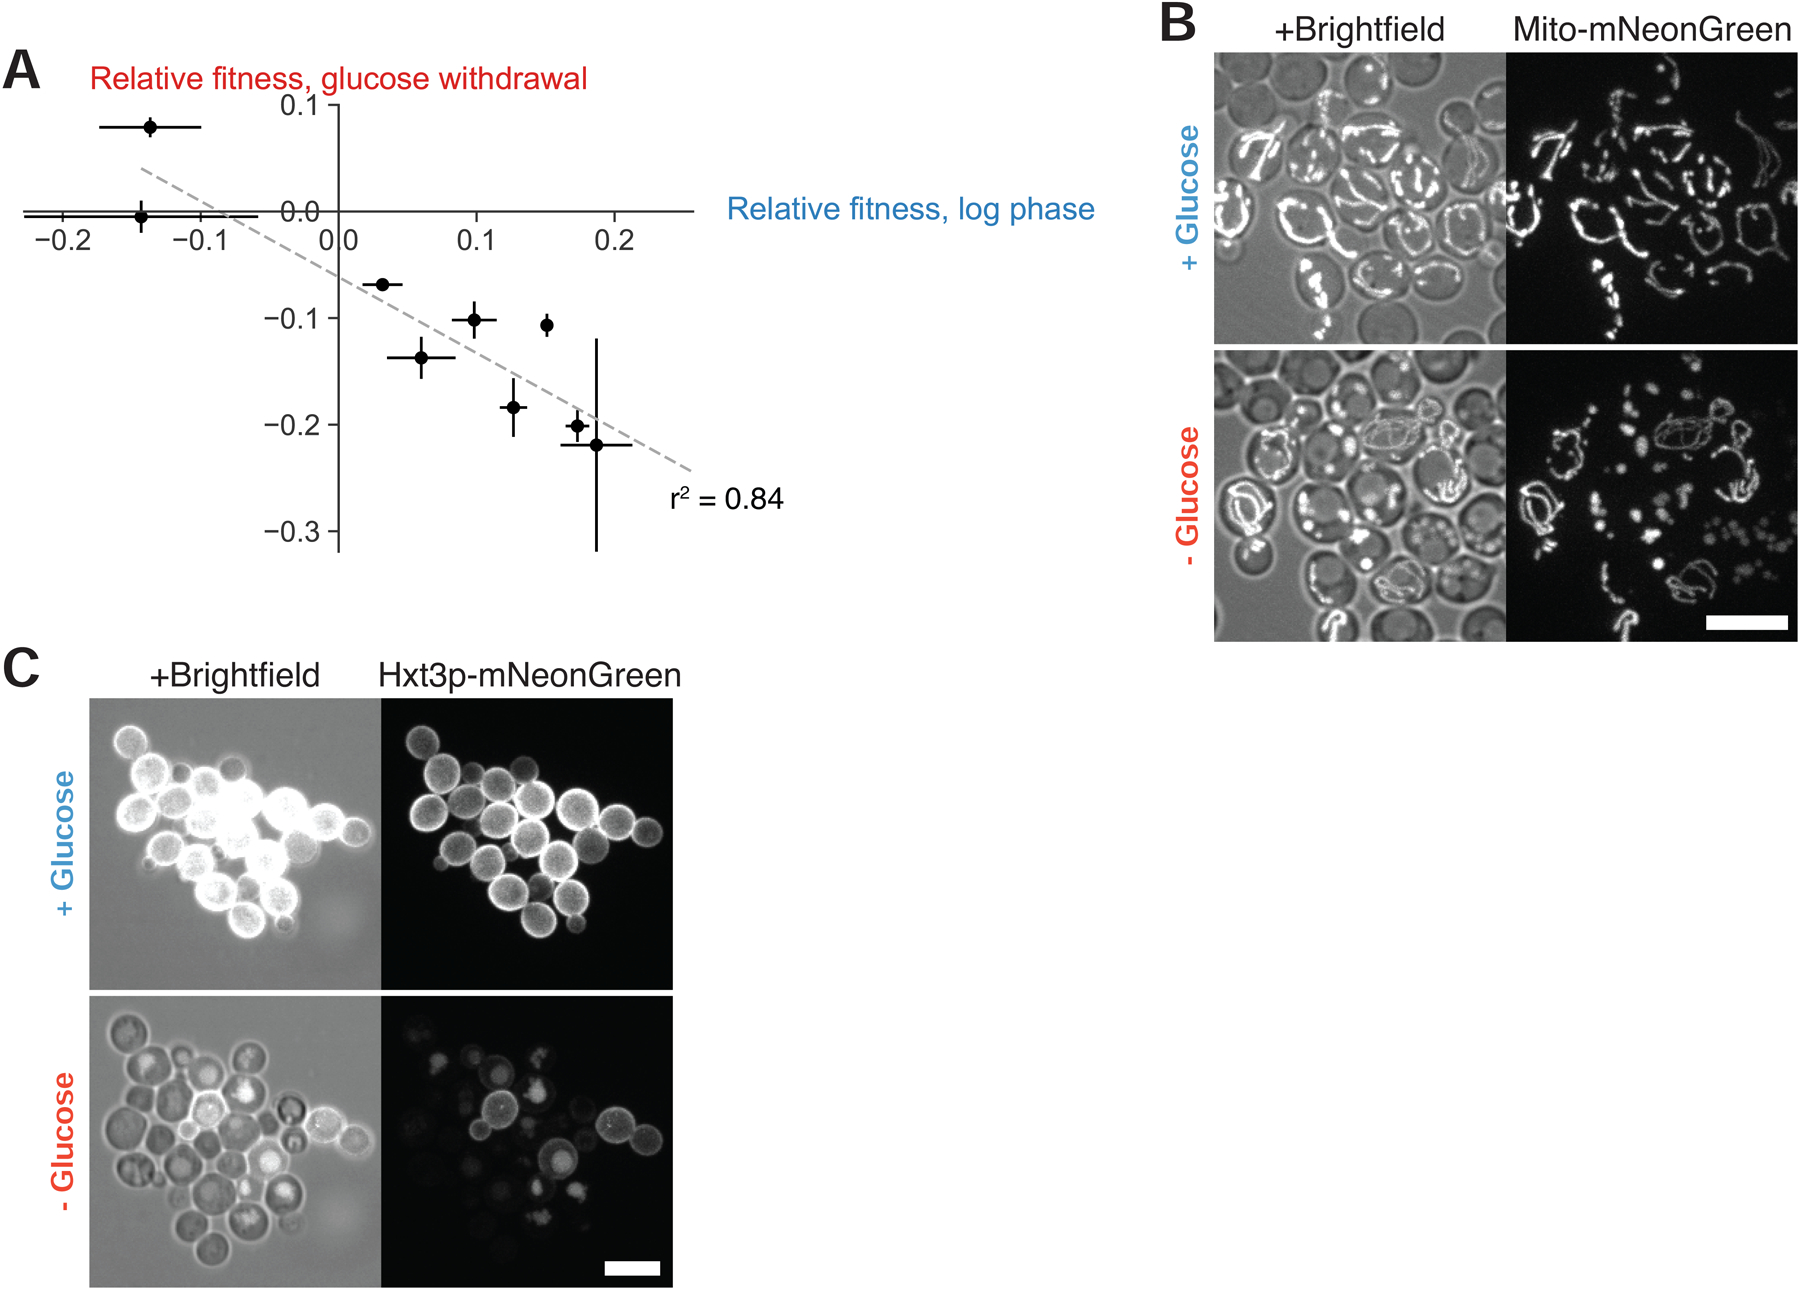
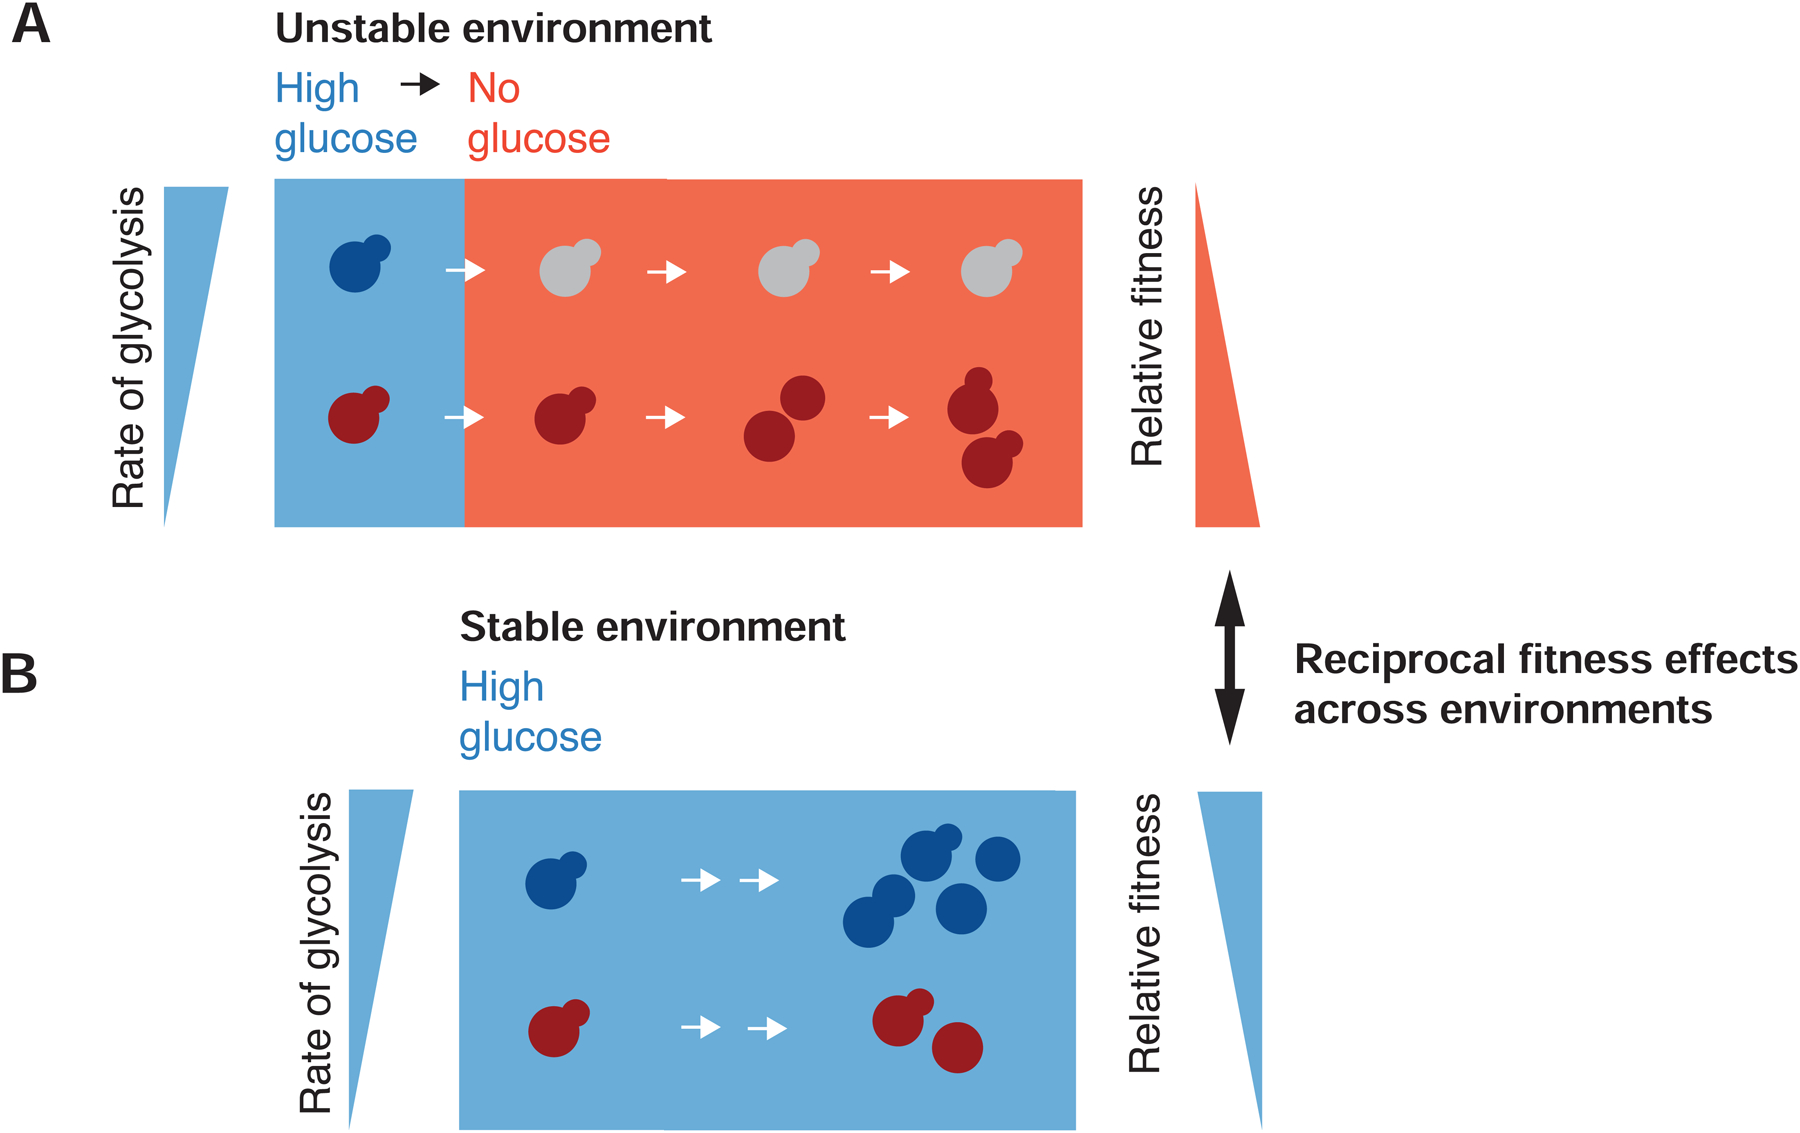
To grow and divide, cells must extract resources from dynamic and unpredictable environments. Many organisms use different metabolic strategies for distinct contexts. Budding yeast can produce ATP from carbon sources by mechanisms that prioritize either speed (fermentation) or yield (respiration). Withdrawing glucose from exponentially growing cells reveals variability in their ability to switch from fermentation to respiration. We observe two subpopulations of glucose-starved cells: recoverers, which rapidly adapt and resume growth, and arresters, which enter a shock state characterized by deformation of many cellular structures, including mitochondria. These states are heritable, and on high glucose, arresters grow and divide faster than recoverers. Recoverers have a fitness advantage during a carbon source shift but are less fit in a constant, high-glucose environment, and we observe natural variation in the frequency of the two states across wild yeast strains. These experiments suggest that bet hedging has evolved in budding yeast.

Keywords: bet hedging; bimodality; budding yeast; fermentation; metabolism; mitochondria; respiration.


Conflict of interest statement

Declaration of Interests The authors declare no competing interests.

Figures

Figure 1.
Figure 1.. Heterogeneity in mitochondrial size scaling and structural integrity track with growth stalling during fermentative-to-respiratory transitions.
(A) Typical yeast fermentative and respiratory growth dynamics, expressed as the optical density of a batch yeast culture (yLB126) measured on a plate reader with continuous shaking. Dotted lines depict exponential fits to the indicated blue and red regions. (B) Mitochondrial networks visualized by matrix-targeted mNeonGreen fluorescent protein (mito-mNeonGreen) (yLB126) in exponentially-growing yeast cells in synthetic media with indicated carbon sources. Scale bar, 10 μm. (C) Experimental setup. Cells were immobilized in microfluidic plates and supplied with synthetic medium containing 2% glucose by continuous perfusion, promoting glucose repression and permitting fermentative growth. Cells were observed by microscopy during this pregrowth period and following abrupt replacement of the source medium with synthetic medium containing 0% glucose. (D) Representative images of mito-mNeonGreen (yLB126) in high glucose and followed by abrupt switch to glucose-free medium. Labeled cells indicate examples of recoverer cells, which adapt and perform mitochondrial biogenesis (red arrows), and arrester cells, with extended mitochondrial collapse (gray arrows). Scale bar, 10 μm. (E) Distributions of the ratio of mitochondrial to total cell volume for phenotypic classes above for all cells in the field of view in (D). Filled bands indicate one standard deviation from the mean. These sample trajectories are representative of 13 independent experiments as displayed in (G) and (H). (F) Distributions of mitochondrial sphericity index (ratio of surface area of hypothetical sphere with the same volume as a mitochondrion to its actual surface area) for phenotypic classes in (D), in a given sample field of view. Filled bands indicate one standard deviation. (G) and (H) Time-resolved heat maps of mitochondrial/cell volume ratio (G) and mitochondrial sphericity (H) in N = 1,329 cells, collected across 13 independent experiments, before and during acute glucose starvation beginning at 0 min. Intensity reflects absolute number of cells within the binning area. (I) and (J) Histograms of mitochondrial/cell volume ratio (I) and sphericity (J) at the indicated time points from (G) and (H) displaying bimodality in mitochondrial morphology following glucose withdrawal. See also Figure S1 and Videos S1 and S2.
Figure 2.
Figure 2.. Mitochondrial structural collapse is accompanied by internal pH drop and other intracellular aggregation
(A) Distributions of mitochondrial sphericity index following 1 and 6 hr acute glucose starvation and in a subpopulation of recovering cells at the time they resumed growth as determined by observable cell volume increase and/or budding. N ≥ 357 cells. (B) Distributions of mitochondrial to total cell volume ratio in cells growing in synthetic media containing high glucose, cells starved of glucose for 6 hr, and starving cells at the first detectable resumption of growth. (C) Mitochondrial matrix marker in wild-type (yLB126) and mitochondrial fission-defective dnm1Δ mutants (yLB134), in synthetic medium containing high glucose and following abrupt glucose withdrawal. Scale bars, 10 μm. (D) Co-expression of mito-mNeptune and the endoplasmic reticulum marker Sec63pmNeonGreen (yLB41) during exponential growth in synthetic medium containing high glucose and following glucose washout. Scale bar, 10 μm. (E)-(F) Dynamics of intracellular pH (E) and mitochondrial pH (F) in cells growing in high glucose and during starvation, detected by constitutively-expressed pHluorin2 localized to the cytosol or mitochondrial matrix, respectively (yLB397 and yLB219). (G) Relative potential across the inner mitochondrial membrane before and following glucose starvation, measured in cells (yLB1) stained with potential-sensitive MitoTracker Red CM-H2-Xros. All distributions consist of three biological replicates of n = 40,000 cells. See also Figure S2.
Figure 3.
Figure 3.. Glucose specificity and heritability of mitochondrial structural collapse
(A) Mitochondrial matrix fluorescent marker in prototrophic cells growing in synthetic medium lacking amino acids, in the presence of high glucose and 1 hr following glucose withdrawal (left), or in the same synthetic medium, before and 1 hr following nitrogen (ammonium sulfate) withdrawal (right panel). Scale bars, 10 μm. (B) Distribution of mitochondrial sphericity in cells that were acutely deprived of glucose or nitrogen at time 0 min, N ≥ 360 cells. (C) Mitochondrial sphericity in cells before and following glucose washout at time 0 min, partitioned by budded or unbudded state at the moment of glucose withdrawal. N ≥ 404 cells per type. (D)-(E). Correlation between mitochondrial sphericity in mother-daughter pairs following starvation for 120 min (D) and 240 min (E), contrasted with correlation between mother and daughter cells when paired at random. Dotted lines depict regression fits calculated by least-squares method. N = 617 mother-daughter cell pairs. See also Figure S3.
Figure 4.
Figure 4.. Glucose signaling and utilization pathways modulate starvation behavior
(A) Simplified depiction of selected glucose sensing and signaling pathways in budding yeast. Red boxes indicate gene products for which loss of function results in rapid, homogeneous adaptation during acute glucose starvation. The blue box identifies a gene product whose loss results in a homogeneous inability to adapt following glucose withdrawal. (B) Mitochondrial matrix marker in wild-type (yLB126), hxk2Δ (yLB146), and snf1Δ (yLB168) cells, growing in synthetic medium containing high glucose and following abrupt removal of glucose by washout. Scale bar, 10 μm. (C) Distribution of mitochondrial sphericity in snf1Δ (yLB168), wild-type (yLB126), mig1Δmig2Δ (yLB180), hxk2Δ (yLB146), reg1Δ (yLB196), and rgt2Δsnf3Δ (yLB233) strains growing in high glucose (left panel) and 60 min and 240 min post-glucose withdrawal. Mutants in red display relatively low sphericity and no increase during starvation. The snf1Δ mutant in blue initially resembles wild-type but uniformly fails to adapt during starvation. N ≥ 142 cells per genotype. (D) Pre-starvation mitochondrial to cell volume ratios for the strains in (C). N ≥ 142 cells per genotype. (E) Cytosolic pH in wild-type (yLB397), hxk2Δ (yLB416), and snf1Δ (yLB412) cells expressing ratiometric pHluorin2, prior to and following glucose starvation. All distributions consist of three biological replicates of N = 40,000 cells each. (F) Oxygen consumption rates, normalized by optical density and growth rate, for petite (yLB73), snf1Δ (yLB167), wild-type (yLB1), mig1Δmig2Δ (yLB181), hxk2Δ (yLB145), reg1Δ (yLB194), and rgt2Δsnf3Δ (yLB232) strains growing in synthetic media containing high glucose. Data consist of three biological replicates, each comprised of four technical replicates. All Student’s two-tailed independent t test p-values against wild-type < 0.05. (G) Glucose uptake rates, normalized by cell number and growth rate, for strains in (F). Distributions consist of three biological replicates. Student’s two-tailed independent t-test p-values ≥ 0.05 (marked “n.s.” for “not significant) against wild-type for petite (p = 0.38), snf1Δ (p = 0.99), and reg1Δ (p = 0.06). P-values < 0.05 for mig1Δmig2Δ (p = 0.02), hxk2Δ (p = 0.02), and rgt2Δsnf3Δ (p = 0.04) genotypes compared to wild-type. See also Figure S4 and Video S3.
Figure 5.
Figure 5.. Starvation adaptation is associated with preparatory activity that imposes a short-term fitness cost
(A)-(B) Time-resolved heat maps of mitochondrial sphericity in the presence of high glucose and during acute glucose starvation for cells with the top 10% (A) and bottom 10% (B) mitochondrial to total cell volume ratios immediately prior to glucose washout (N = 133 and N = 132, respectively). Intensity reflects the absolute number of cells with a mitochondrial sphericity index within the given bin. (C)-(D) Histograms of selected timepoints from (A) and (B), relative to the entire distribution. Arrows highlight discrepancies in relative subpopulation sizes. (E) Adaptation probability as a function of residence time in media containing high glucose prior to glucose disappearance. Cells expressing Hxt3p-mNeonGreen (yLB432) were grown in synthetic medium lacking amino acids and containing non-fermentable potassium acetate as a carbon source, then switched into otherwise identical medium containing high glucose for the specified number of hours prior to sudden glucose starvation. Recovery was scored as the presence or absence of Hxt3p-mNeonGreen signal by flow cytometry. The solid line represents the logistic function, displayed above, calculated from the data by non-linear least squares fit. Three biological replicates, N = 40,000 cells for each time point. (F) Upper panel: cell density of a culture initiated with equal proportions of wild-type (yLB365) and hxk2Δ (yLB373) in synthetic medium containing high glucose. Blue and red shaded regions indicate exponential and diauxic growth phases, respectively. Lower panel: relative fitness of wild-type and hxk2Δ mutants during exponential phase growth and after the diauxic shift (as in upper panel) calculated as the relative rates of cell doublings/hr and measured by the changes in the ratios of the two genotypes by flow cytometry. Equivalent fitness measurement, in rates of cell number increase in the first 8 hours following sudden glucose deprivation, is displayed in darker red. Error bars, one standard deviation. Three biological replicates, N = 40,000 cells analyzed by flow cytometry for all time points of all conditions. (G) Distribution of growth rates of single-lineage microcolonies in the presence of high glucose, partitioned by the failure or success of lineages to complete one doubling in the 12 hr following glucose starvation (arresters and recoverers, respectively). Mann-Whitney U test p-value = 0.006. See also Figure S5.
Figure 6.
Figure 6.. Bimodal starvation behavior obeys a fitness tradeoff in natural yeast strains
(A) Relative fitnesses of diploid derivatives of YJM978 (yLB463), CEN.PK (yLB467), DBVPG1373 (yLB470), L-1374 (yLB474), BC187 (yLB478), Y12 (yLB486), K11 (yLB492), YPS606 (yLB494), and UWOPS83–787.3 (yLB496) expressing mNeptune under the ACT1 promoter, measured against a common referance, YS2 (yLB480), when assayed in pairwise competitions, both in exponential phase growth in the presence of abundant glucose and following abrupt glucose deprivation. Three independent biological replicates measured for all competitions. Error bars, one standard deviation. (B)-(C) Microscopic images revealing bimodality in mitochondrial matrix morphology (B) and Hxt3p-mNeonGreen (C) in diploid BC187 derivative (yLB453), in synthetic medium containing high glucose and 7 hr following abrupt glucose withdrawal. Scale bars, 10 μm.
Figure 7.
Figure 7.. A model of mitochondria and metabolic transitions
(A) A clonal population of yeast growing in the presence of abundant glucose (blue background) is composed of cells in two distinct metabolic states in which the relative rate of glycolysis is either high or low (blue and red cells, respectively). Upon sudden glucose starvation (red background), cells with high glycolytic activity arrest indefinitely, while those with low activity adapt and ultimately resume growth. Lower initial rates of glycolysis result in a fitness advantage during starvation. (B) In stable, high-glucose conditions, maximizing the rate of glycolysis (blue cells) can sustain a higher growth rate and thus produce a fitness advantage.

References

    1. Johnston M, and Carlson M (1992). Carbon regulation in Saccharomyces. Molecular and Cellular Biology of the Yeast Saccharomyces, Broach JR, Pringle JR, Jones EW (eds) Cold Spring Harbor, NY: Cold Spring Harbor Laboratory Press.
    1. Zaman S, Lippman SI, Zhao X, and Broach JR (2008). How Saccharomyces responds to nutrients. Annu. Rev. Genet 42, 27–81. - PubMed
    1. Wang J, Atolia E, Hua B, Savir Y, Escalante-Chong R, and Springer M (2015). Natural variation in preparation for nutrient depletion reveals a cost-benefit tradeoff. PLoS Biol. 13, e1002041. - PMC - PubMed
    1. Kayikci Ö, and Nielsen J (2015). Glucose repression in Saccharomyces cerevisiae. FEMS Yeast Res. 15 Available at: 10.1093/femsyr/fov068. - DOI - PMC - PubMed
    1. Yotsuyanagi Y (1962). [Study of yeast mitochondria. I. Variations in mitochondrial ultrastructure during the aerobic growth cycle]. J. Ultrastruct. Res 7, 121–140. - PubMed

Publication types

MeSH terms

LinkOut - more resources