

High-resolution metabolic imaging of high-grade gliomas using 7T-CRT-FID-MRSI
- PMID: 32977210
- PMCID: PMC7511769
- DOI: 10.1016/j.nicl.2020.102433
High-resolution metabolic imaging of high-grade gliomas using 7T-CRT-FID-MRSI
Abstract
Objectives: Successful neurosurgical intervention in gliomas depends on the precision of the preoperative definition of the tumor and its margins since a safe maximum resection translates into a better patient outcome. Metabolic high-resolution imaging might result in improved presurgical tumor characterization, and thus optimized glioma resection. To this end, we validated the performance of a fast high-resolution whole-brain 3D-magnetic resonance spectroscopic imaging (MRSI) method at 7T in a patient cohort of 23 high-grade gliomas (HGG).
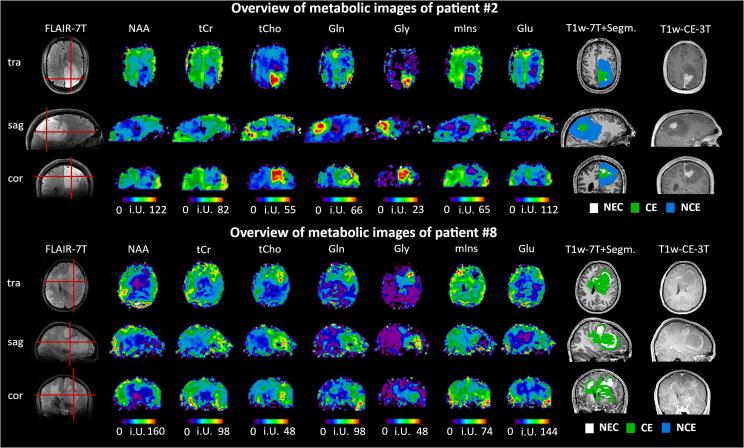
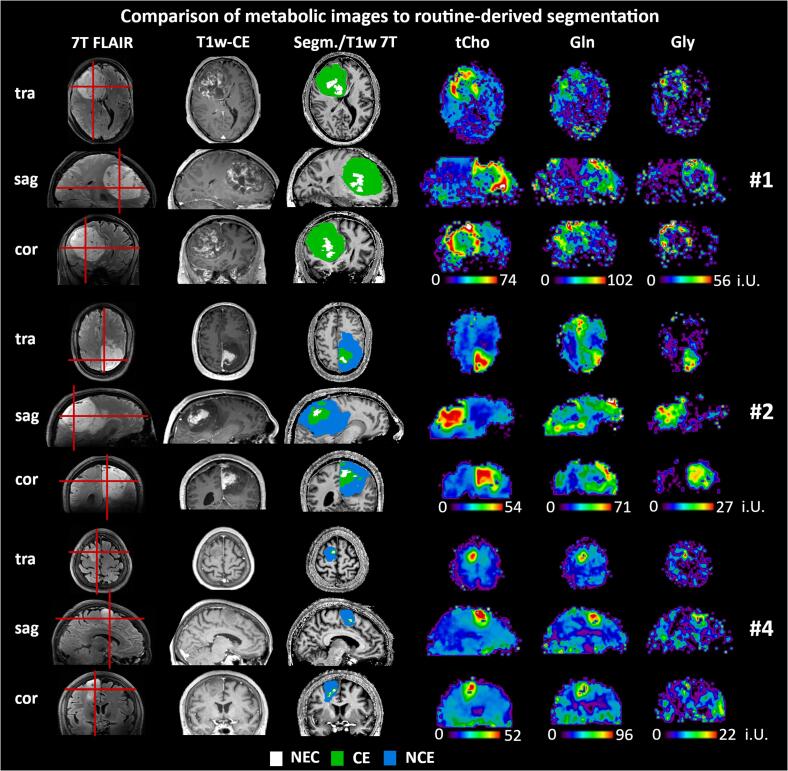
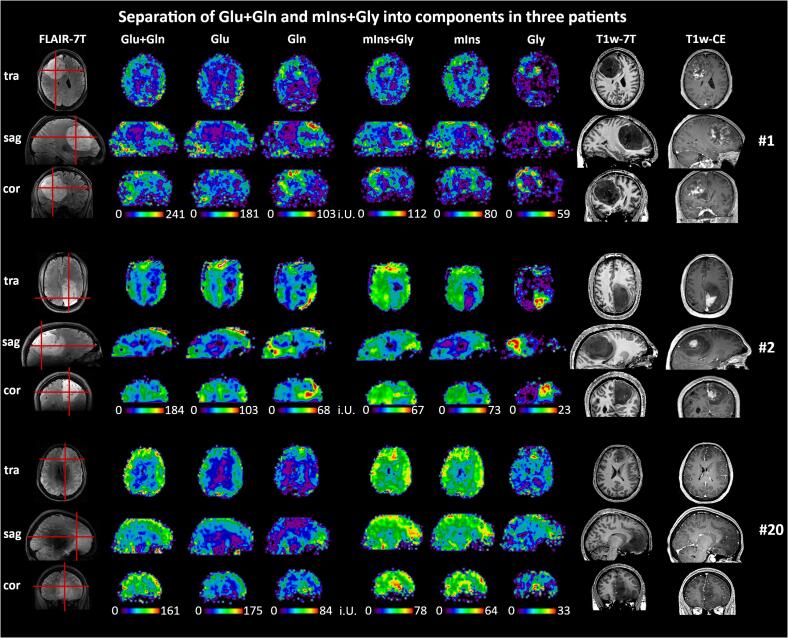
Materials and methods: We preoperatively measured 23 patients with histologically verified HGGs (17 male, 8 female, age 53 ± 15) with an MRSI sequence based on concentric ring trajectories with a 64 × 64 × 39 measurement matrix, and a 3.4 × 3.4 × 3.4 mm3 nominal voxel volume in 15 min. Quantification used a basis-set of 17 components including N-acetyl-aspartate (NAA), total choline (tCho), total creatine (tCr), glutamate (Glu), glutamine (Gln), glycine (Gly) and 2-hydroxyglutarate (2HG). The resultant metabolic images were evaluated for their reliability as well as their quality and compared to spatially segmented tumor regions-of-interest (necrosis, contrast-enhanced, non-contrast enhanced + edema, peritumoral) based on clinical data and also compared to histopathology (e.g., grade, IDH-status).
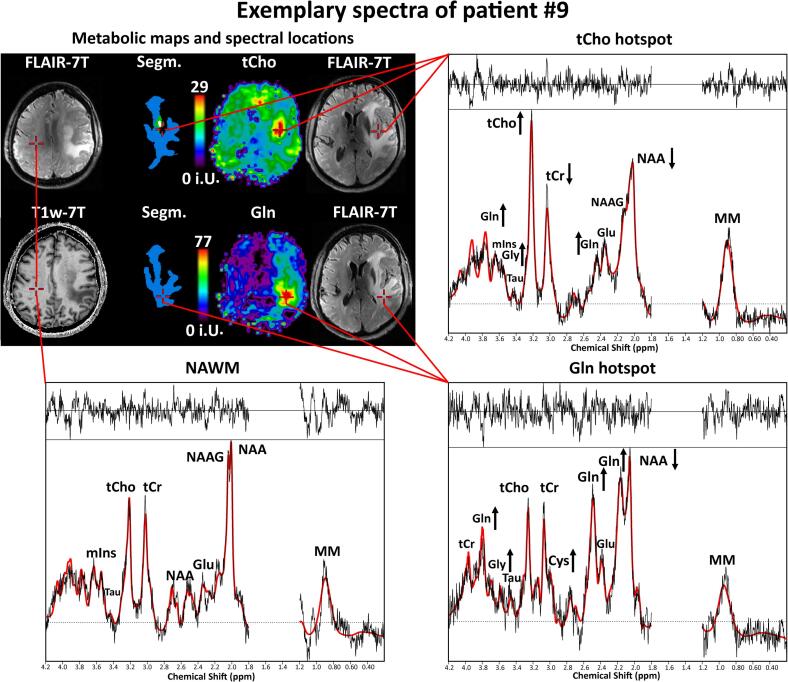
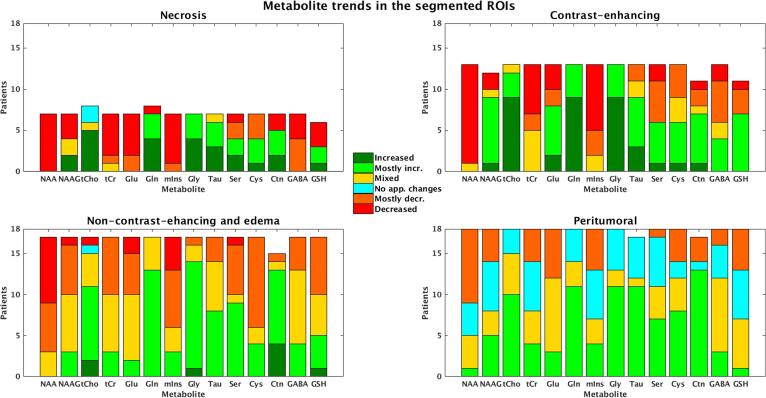
Results: Eighteen of the patient measurements were considered usable. In these patients, ten metabolites were quantified with acceptable quality. Gln, Gly, and tCho were increased and NAA and tCr decreased in nearly all tumor regions, with other metabolites such as serine, showing mixed trends. Overall, there was a reliable characterization of metabolic tumor areas. We also found heterogeneity in the metabolic images often continued into the peritumoral region. While 2HG could not be satisfyingly quantified, we found an increase of Glu in the contrast-enhancing region of IDH-wildtype HGGs and a decrease of Glu in IDH1-mutant HGGs.
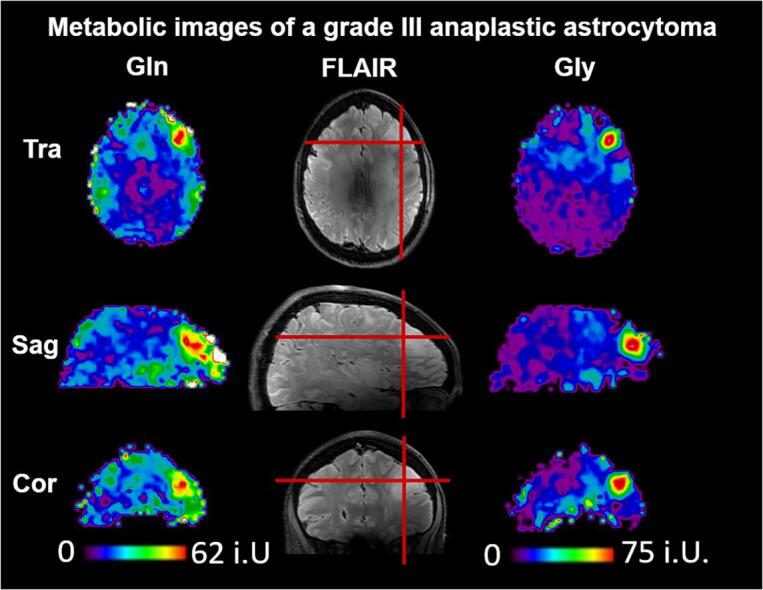
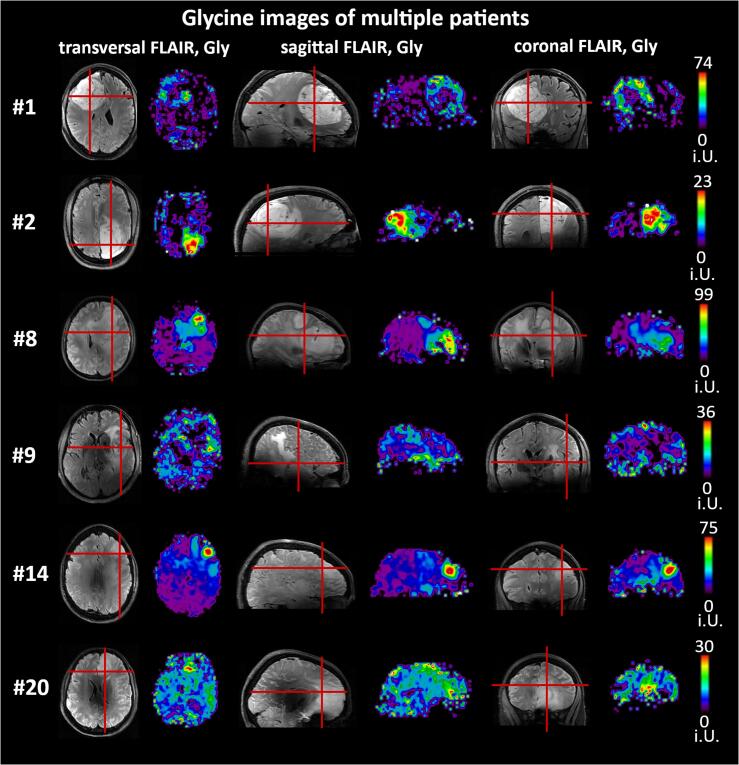
Conclusions: We successfully demonstrated high-resolution 7T 3D-MRSI in HGG patients, showing metabolic differences between tumor regions and peritumoral tissue for multiple metabolites. Increases of tCho, Gln (related to tumor metabolism), Gly (related to tumor proliferation), as well as decreases in NAA, tCr, and others, corresponded very well to clinical tumor segmentation, but were more heterogeneous and often extended into the peritumoral region.
Keywords: 7 Tesla; Concentric circle trajectories; Glycine; High-grade glioma; Magnetic resonance spectroscopic imaging; Metabolic imaging.
Copyright © 2020 The Authors. Published by Elsevier Inc. All rights reserved.
Conflict of interest statement
MP has received honoraria for lectures, consultation or advisory board participation from the following for-profit companies: Bayer, Bristol-Myers Squibb, Novartis, Gerson Lehrman Group (GLG), CMC Contrast, GlaxoSmithKline, Mundipharma, Roche, BMJ Journals, MedMedia, Astra Zeneca, AbbVie, Lilly, Medahead, Daiichi Sankyo, Sanofi, Merck Sharp & Dome, Tocagen. The following for-profit companies have supported clinical trials and contracted research conducted by MP with payments made to his institution: Böhringer-Ingelheim, Bristol-Myers Squibb, Roche, Daiichi Sankyo, Merck Sharp & Dome, Novocure, GlaxoSmithKline, AbbVie.
Figures
References
-
- Andronesi O.C., Arrillaga-Romany I.C., Ly K.I., Bogner W., Ratai E.M., Reitz K., Iafrate A.J., Dietrich J., Gerstner E.R., Chi A.S., Rosen B.R., Wen P.Y., Cahill D.P., Batchelor T.T. Pharmacodynamics of mutant-IDH1 inhibitors in glioma patients probed by in vivo 3D MRS imaging of 2-hydroxyglutarate. Nat. Commun. 2018;9:1474. doi: 10.1038/s41467-018-03905-6. - DOI - PMC - PubMed
-
- Berrington A., Voets N.L., Larkin S.J., de Pennington N., Mccullagh J., Stacey R., Schofield C.J., Jezzard P., Clare S., Cadoux-Hudson T., Plaha P., Ansorge O., Emir U.E. A comparison of 2-hydroxyglutarate detection at 3 and 7 T with long-TE semi-LASER. NMR Biomed. 2018;31 doi: 10.1002/nbm.3886. - DOI - PubMed
Publication types
MeSH terms
Grants and funding
LinkOut - more resources
Full Text Sources
Medical
Research Materials
Miscellaneous
