

Novel Mechanistic PBPK Model to Predict Renal Clearance in Varying Stages of CKD by Incorporating Tubular Adaptation and Dynamic Passive Reabsorption
- PMID: 32977369
- PMCID: PMC7577018
- DOI: 10.1002/psp4.12553
Novel Mechanistic PBPK Model to Predict Renal Clearance in Varying Stages of CKD by Incorporating Tubular Adaptation and Dynamic Passive Reabsorption
Abstract
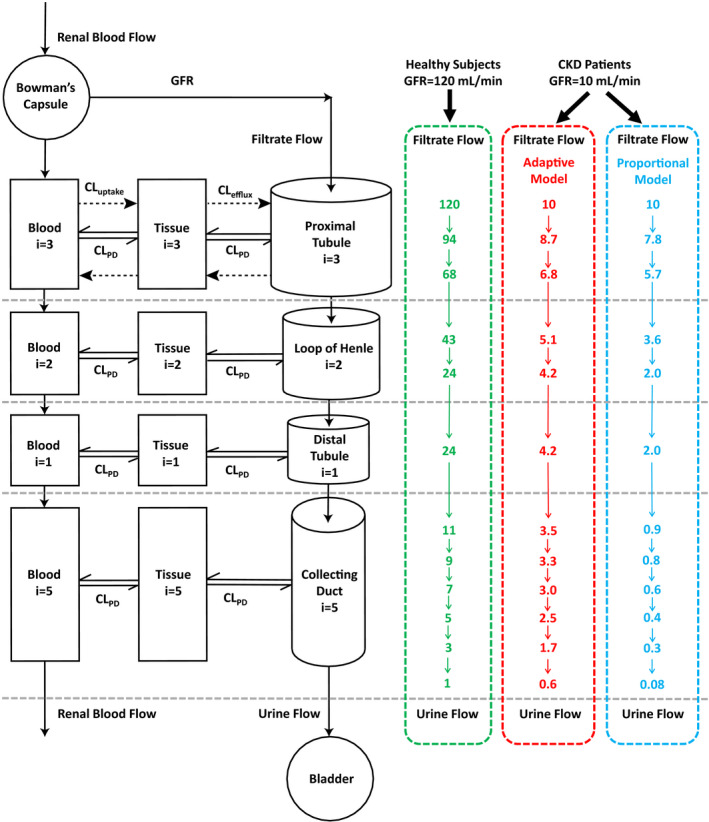
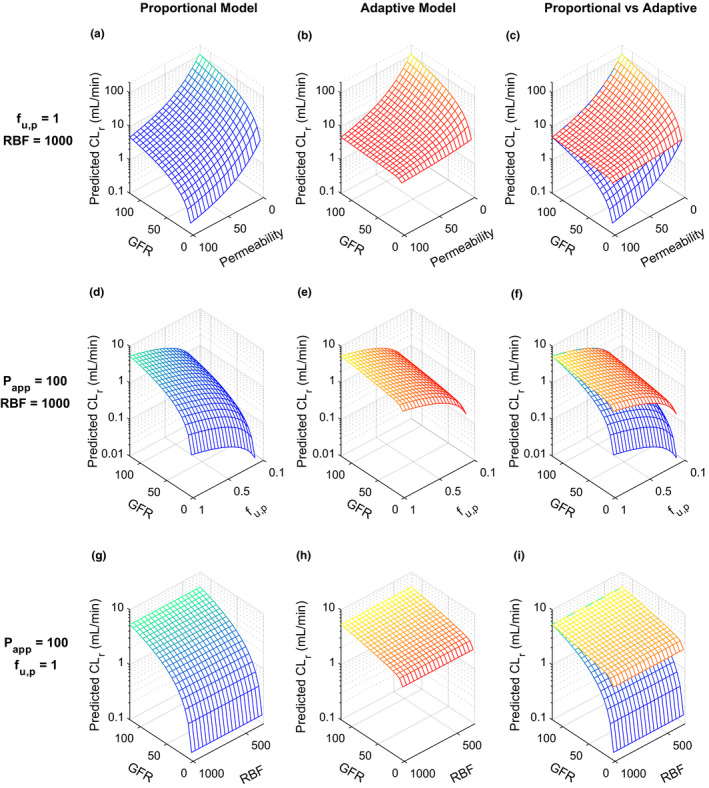
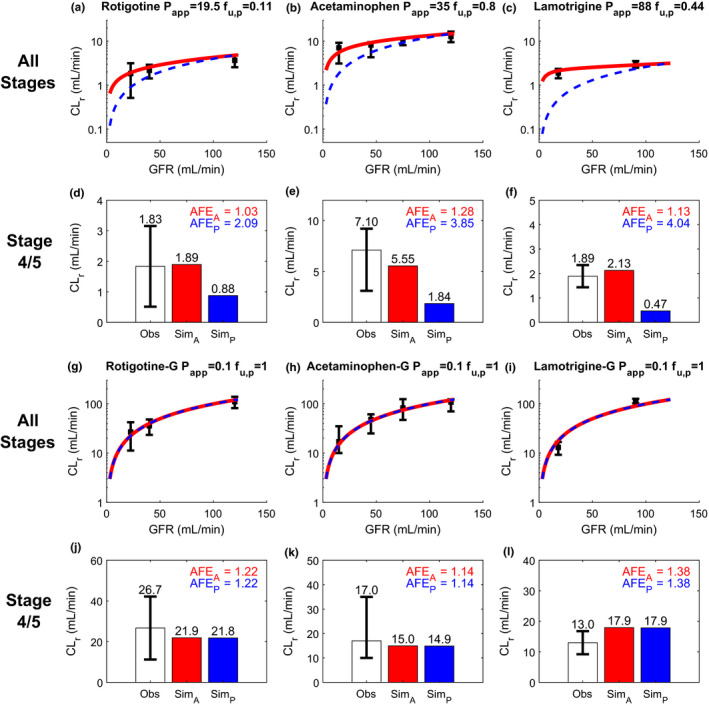
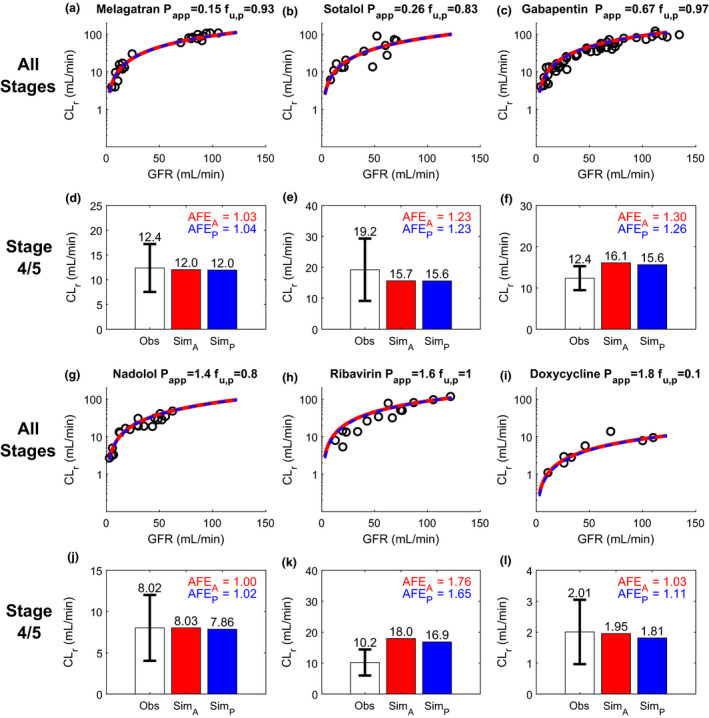
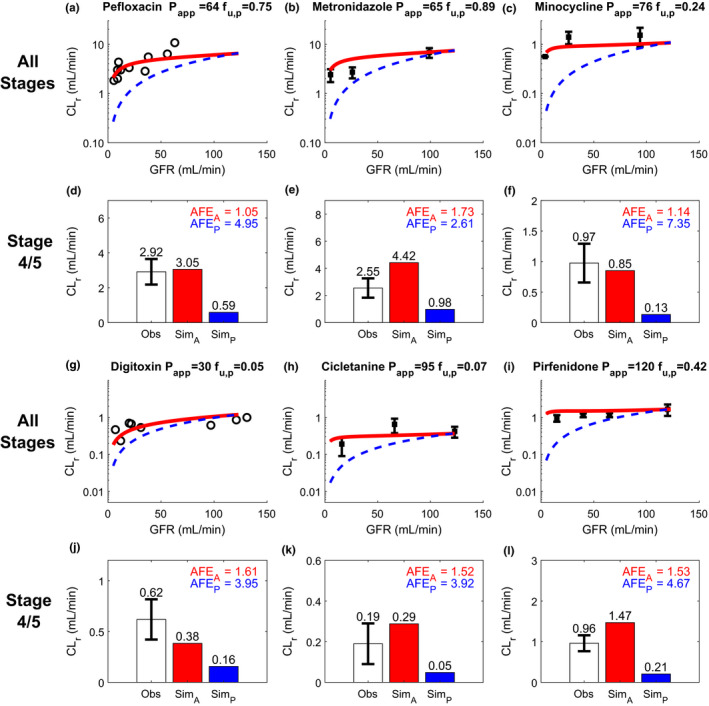
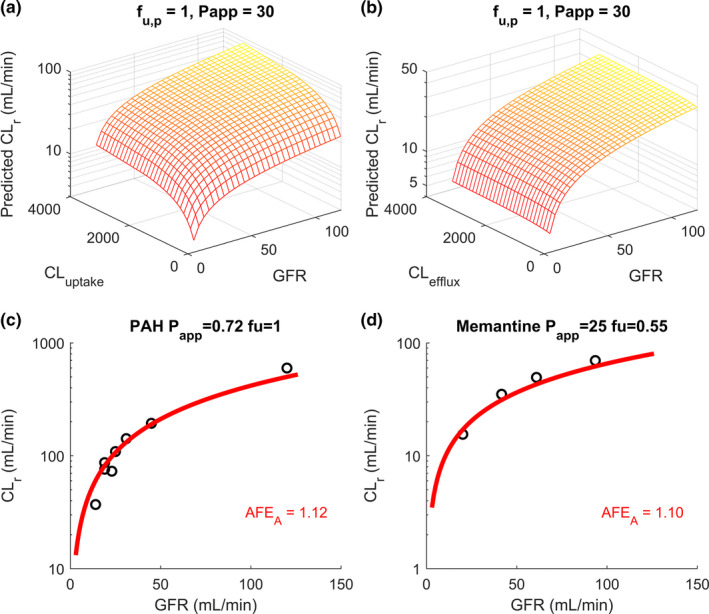
Chronic kidney disease (CKD) has significant effects on renal clearance (CLr ) of drugs. Physiologically-based pharmacokinetic (PBPK) models have been used to predict CKD effects on transporter-mediated renal active secretion and CLr for hydrophilic nonpermeable compounds. However, no studies have shown systematic PBPK modeling of renal passive reabsorption or CLr for hydrophobic permeable drugs in CKD. The goal of this study was to expand our previously developed and verified mechanistic kidney model to develop a universal model to predict changes in CLr in CKD for permeable and nonpermeable drugs that accounts for the dramatic nonlinear effect of CKD on renal passive reabsorption of permeable drugs. The developed model incorporates physiologically-based tubular changes of reduced water reabsorption/increased tubular flow rate per remaining functional nephron in CKD. The final adaptive kidney model successfully (absolute fold error (AFE) all < 2) predicted renal passive reabsorption and CLr for 20 permeable and nonpermeable test compounds across the stages of CKD. In contrast, use of proportional glomerular filtration rate reduction approach without addressing tubular adaptation processes in CKD to predict CLr generated unacceptable CLr predictions (AFE = 2.61-7.35) for permeable compounds in severe CKD. Finally, the adaptive kidney model accurately predicted CLr of para-amino-hippuric acid and memantine, two secreted compounds, in CKD, suggesting successful integration of active secretion into the model, along with passive reabsorption. In conclusion, the developed adaptive kidney model enables mechanistic predictions of in vivo CLr through CKD progression without any empirical scaling factors and can be used for CLr predictions prior to assessment of drug disposition in renal impairment.
© 2020 The Authors. CPT: Pharmacometrics & Systems Pharmacology published by Wiley Periodicals LLC on behalf of the American Society for Clinical Pharmacology and Therapeutics.
Conflict of interest statement
Both authors declared no competing interests for this work.
Figures
Similar articles
-
Novel minimal physiologically-based model for the prediction of passive tubular reabsorption and renal excretion clearance.Eur J Pharm Sci. 2016 Oct 30;94:59-71. doi: 10.1016/j.ejps.2016.03.018. Epub 2016 Mar 28. Eur J Pharm Sci. 2016. PMID: 27033147 Free PMC article.
-
Is the GFR-based scaling approach adequate for predicting pediatric renal clearance of drugs with passive tubular reabsorption? Insights from PBPK modeling.CPT Pharmacometrics Syst Pharmacol. 2025 Jan;14(1):152-163. doi: 10.1002/psp4.13254. Epub 2024 Oct 15. CPT Pharmacometrics Syst Pharmacol. 2025. PMID: 39403008 Free PMC article.
-
Delineating the Role of Various Factors in Renal Disposition of Digoxin through Application of Physiologically Based Kidney Model to Renal Impairment Populations.J Pharmacol Exp Ther. 2017 Mar;360(3):484-495. doi: 10.1124/jpet.116.237438. Epub 2017 Jan 5. J Pharmacol Exp Ther. 2017. PMID: 28057840 Free PMC article.
-
A review of physiologically based pharmacokinetic modeling of renal drug disposition.Drug Metab Dispos. 2025 Mar;53(3):100042. doi: 10.1016/j.dmd.2025.100042. Epub 2025 Jan 21. Drug Metab Dispos. 2025. PMID: 40048993 Review.
-
Prediction of human pharmacokinetics - renal metabolic and excretion clearance.J Pharm Pharmacol. 2007 Nov;59(11):1463-71. doi: 10.1211/jpp.59.11.0002. J Pharm Pharmacol. 2007. PMID: 17976256 Review.
Cited by
-
Population pharmacokinetic and pharmacodynamic model of evogliptin: Severe uremia increases the bioavailability of evogliptin.CPT Pharmacometrics Syst Pharmacol. 2025 Feb;14(2):246-256. doi: 10.1002/psp4.13263. Epub 2024 Oct 28. CPT Pharmacometrics Syst Pharmacol. 2025. PMID: 39465597 Free PMC article.
-
The Trends and Future Prospective of In Silico Models from the Viewpoint of ADME Evaluation in Drug Discovery.Pharmaceutics. 2023 Nov 12;15(11):2619. doi: 10.3390/pharmaceutics15112619. Pharmaceutics. 2023. PMID: 38004597 Free PMC article. Review.
-
Physiologically based pharmacokinetic modelling and simulation to predict the plasma concentration profile of schaftoside after oral administration of total flavonoids of Desmodium styracifolium.Front Pharmacol. 2022 Dec 14;13:1073535. doi: 10.3389/fphar.2022.1073535. eCollection 2022. Front Pharmacol. 2022. PMID: 36588682 Free PMC article.
-
3D cell culture models: Drug pharmacokinetics, safety assessment, and regulatory consideration.Clin Transl Sci. 2021 Sep;14(5):1659-1680. doi: 10.1111/cts.13066. Epub 2021 Jun 16. Clin Transl Sci. 2021. PMID: 33982436 Free PMC article. Review.
-
Prediction of higher ceftazidime-avibactam concentrations in the human renal interstitium compared with unbound plasma using a minimal physiologically based pharmacokinetic model developed in rats and pigs through microdialysis.Antimicrob Agents Chemother. 2025 Mar 5;69(3):e0151824. doi: 10.1128/aac.01518-24. Epub 2025 Feb 6. Antimicrob Agents Chemother. 2025. PMID: 39912660 Free PMC article.
References
-
- Levey, A.S. & Coresh, J. Chronic kidney disease. Lancet 379, 165–180 (2012). - PubMed
-
- Zoccali, C. et al The systemic nature of CKD. Nat. Rev. Nephrol. 13, 344–358 (2017). - PubMed
-
- Bricker, N.S. , Morrin, P.A.F. & Kime, S.W. The pathologic physiology of chronic Bright’s disease. Am. J. Med. 28, 77–98 (1960). - PubMed
-
- KDIGO 2012 clinical practice guideline for the evaluation and management of chronic kidney disease. Kidney Int. 3, 19–62 (2013). - PubMed
Publication types
MeSH terms
Substances
Grants and funding
LinkOut - more resources
Full Text Sources
Medical
