

Growth Differentiation Factor 15 Ameliorates Anti-Glomerular Basement Membrane Glomerulonephritis in Mice
- PMID: 32977372
- PMCID: PMC7583818
- DOI: 10.3390/ijms21196978
Growth Differentiation Factor 15 Ameliorates Anti-Glomerular Basement Membrane Glomerulonephritis in Mice
Abstract
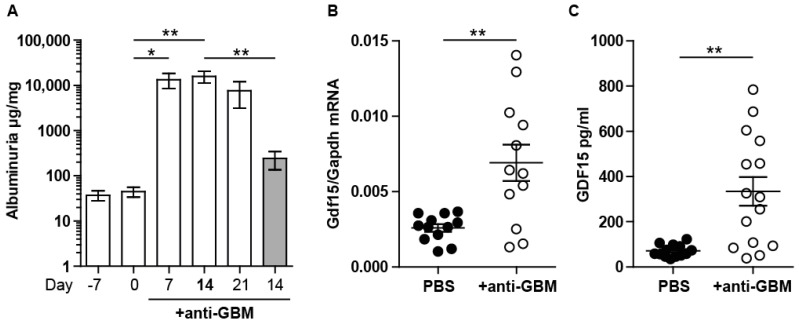
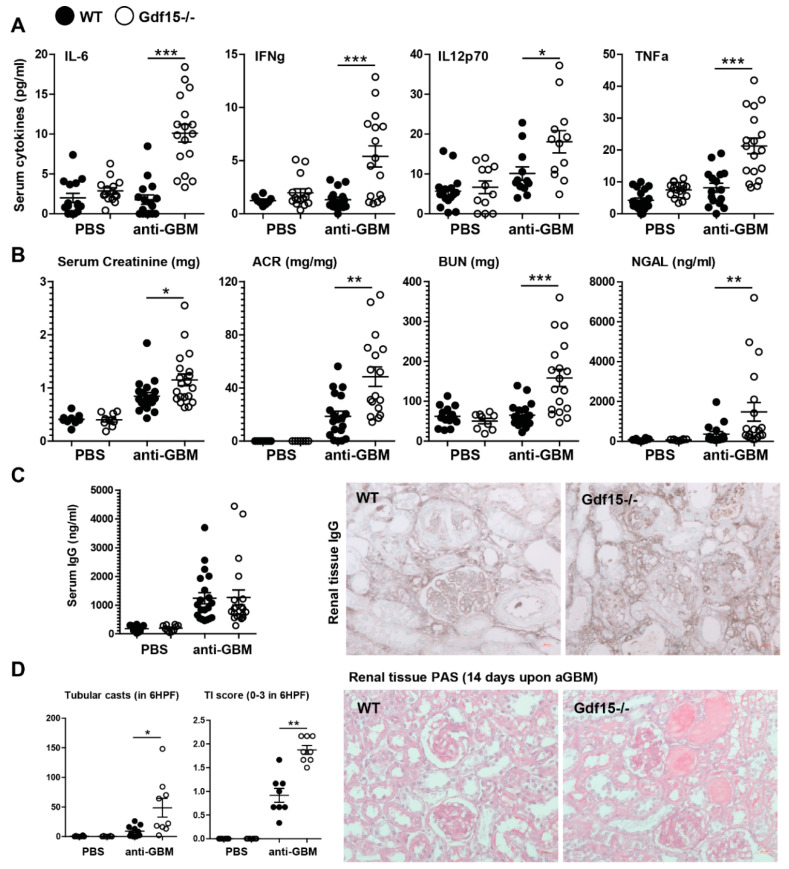
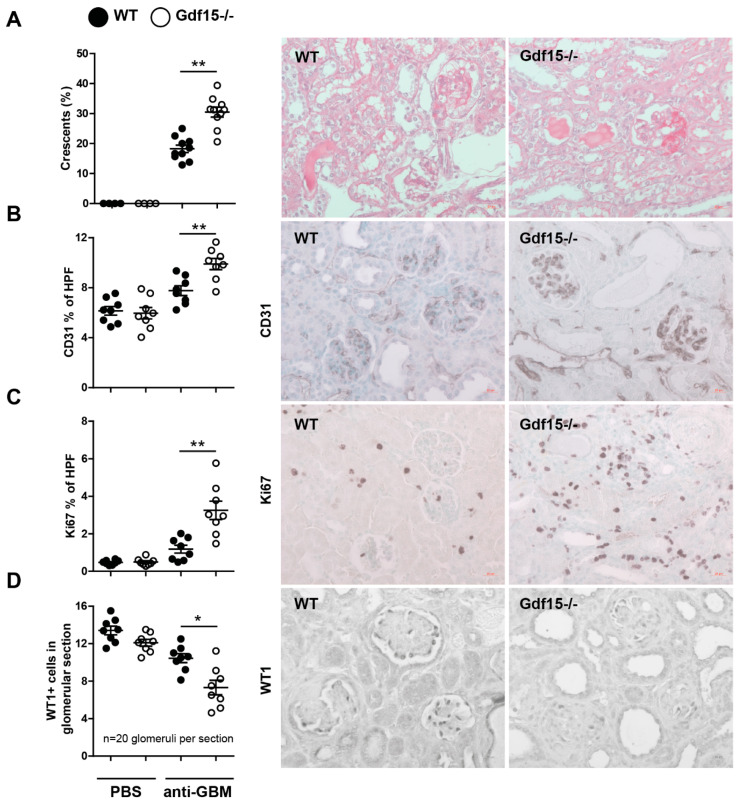
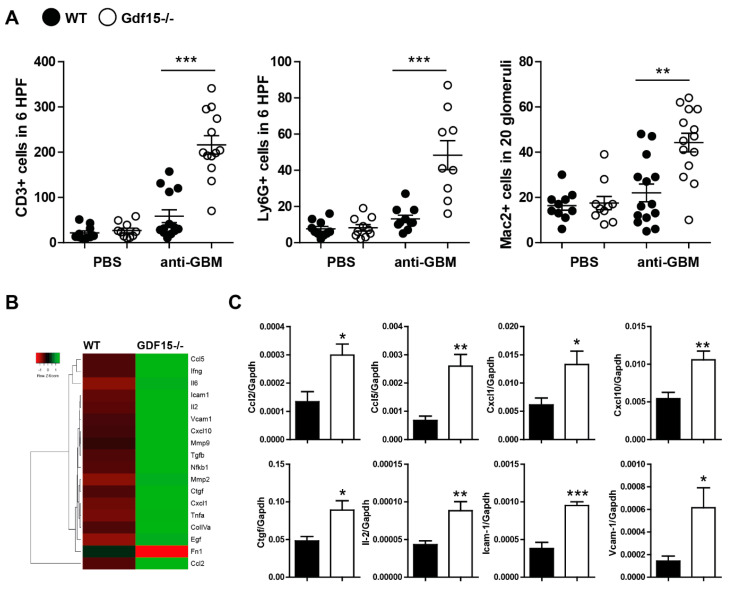
Growth differentiation factor 15 (GDF15) is a member of the transforming growth factor-β (TGF-β) cytokine family and an inflammation-associated protein. Here, we investigated the role of GDF15 in murine anti-glomerular basement membrane (GBM) glomerulonephritis. Glomerulonephritis induction in mice induced systemic expression of GDF15. Moreover, we demonstrate the protective effects for GDF15, as GDF15-deficient mice exhibited increased proteinuria with an aggravated crescent formation and mesangial expansion in anti-GBM nephritis. Herein, GDF15 was required for the regulation of T-cell chemotactic chemokines in the kidney. In addition, we found the upregulation of the CXCR3 receptor in activated T-cells in GDF15-deficient mice. These data indicate that CXCL10/CXCR3-dependent-signaling promotes the infiltration of T cells into the organ during acute inflammation controlled by GDF15. Together, these results reveal a novel mechanism limiting the migration of lymphocytes to the site of inflammation during glomerulonephritis.
Keywords: T cells; chemokines; glomerulonephritis; inflammation; innate immunity.
Conflict of interest statement
The authors declare no conflict of interest. The funders had no role in the design of the study; collection, analyses, or interpretation of data; writing of the manuscript, or decision to publish the results.
Figures
Similar articles
-
Crucial Role of Mesangial Cell-derived Connective Tissue Growth Factor in a Mouse Model of Anti-Glomerular Basement Membrane Glomerulonephritis.Sci Rep. 2017 Feb 13;7:42114. doi: 10.1038/srep42114. Sci Rep. 2017. PMID: 28191821 Free PMC article.
-
Latent TGF-beta1 protects against crescentic glomerulonephritis.J Am Soc Nephrol. 2008 Feb;19(2):233-42. doi: 10.1681/ASN.2007040484. Epub 2008 Jan 23. J Am Soc Nephrol. 2008. PMID: 18216320 Free PMC article.
-
Glutathione S-transferase Mu 2-transduced mesenchymal stem cells ameliorated anti-glomerular basement membrane antibody-induced glomerulonephritis by inhibiting oxidation and inflammation.Stem Cell Res Ther. 2014 Jan 30;5(1):19. doi: 10.1186/scrt408. Stem Cell Res Ther. 2014. PMID: 24480247 Free PMC article.
-
Concurrent anti-glomerular basement membrane disease and membranous glomerulonephritis: a case report and literature review.Clin Nephrol. 2006 Aug;66(2):120-7. doi: 10.5414/cnp66120. Clin Nephrol. 2006. PMID: 16939068 Review.
-
Glomerular basement membrane heparan sulfate in health and disease: A regulator of local complement activation.Matrix Biol. 2017 Jan;57-58:299-310. doi: 10.1016/j.matbio.2016.09.002. Epub 2016 Sep 6. Matrix Biol. 2017. PMID: 27609404 Free PMC article. Review.
Cited by
-
GDF15 Suppresses Lymphoproliferation and Humoral Autoimmunity in a Murine Model of Systemic Lupus Erythematosus.J Innate Immun. 2022;14(6):673-689. doi: 10.1159/000523991. Epub 2022 Apr 20. J Innate Immun. 2022. PMID: 35443244 Free PMC article.
-
Identification of a distinct cluster of GDF15high macrophages induced by in vitro differentiation exhibiting anti-inflammatory activities.Front Immunol. 2024 Apr 8;15:1309739. doi: 10.3389/fimmu.2024.1309739. eCollection 2024. Front Immunol. 2024. PMID: 38655264 Free PMC article.
-
ST2 + T-Regulatory Cells in Renal Inflammation and Fibrosis after Ischemic Kidney Injury.J Am Soc Nephrol. 2025 Jan 1;36(1):73-86. doi: 10.1681/ASN.0000000000000471. Epub 2024 Aug 26. J Am Soc Nephrol. 2025. PMID: 39186386
-
Analysis of the Expression of Neurotrophins and Their Receptors in Adult Zebrafish Kidney.Vet Sci. 2022 Jun 15;9(6):296. doi: 10.3390/vetsci9060296. Vet Sci. 2022. PMID: 35737348 Free PMC article.
-
Growth differentiation factor-15 serum concentrations reflect disease severity and anemia in patients with inflammatory bowel disease.World J Gastroenterol. 2024 Apr 7;30(13):1899-1910. doi: 10.3748/wjg.v30.i13.1899. World J Gastroenterol. 2024. PMID: 38659482 Free PMC article.
References
-
- Canney M., O’Hara P.V., McEvoy C.M., Medani S., Connaughton D.M., Abdalla A.A., Doyle R., Stack A.G., O’Seaghdha C.M., Clarkson M.R., et al. Spatial and Temporal Clustering of Anti-Glomerular Basement Membrane Disease. Clin. J. Am. Soc. Nephrol. 2016;11:1392–1399. doi: 10.2215/CJN.13591215. - DOI - PMC - PubMed
-
- Kumar S.V., Kulkarni O.P., Mulay S.R., Darisipudi M.N., Romoli S., Thomasova D., Scherbaum C.R., Hohenstein B., Hugo C., Muller S., et al. Neutrophil Extracellular Trap-Related Extracellular Histones Cause Vascular Necrosis in Severe GN. J. Am. Soc. Nephrol. 2015;26:2399–2413. doi: 10.1681/ASN.2014070673. - DOI - PMC - PubMed
MeSH terms
Substances
Grants and funding
LinkOut - more resources
Full Text Sources
Other Literature Sources
Molecular Biology Databases
