. 2020 Sep 23;10(10):1356.
doi: 10.3390/biom10101356.

Syndecan-1 Promotes Hepatocyte-Like Differentiation of Hepatoma Cells Targeting Ets-1 and AP-1

Affiliations

Syndecan-1 Promotes Hepatocyte-Like Differentiation of Hepatoma Cells Targeting Ets-1 and AP-1

Péter Hollósi et al. Biomolecules. .

Abstract

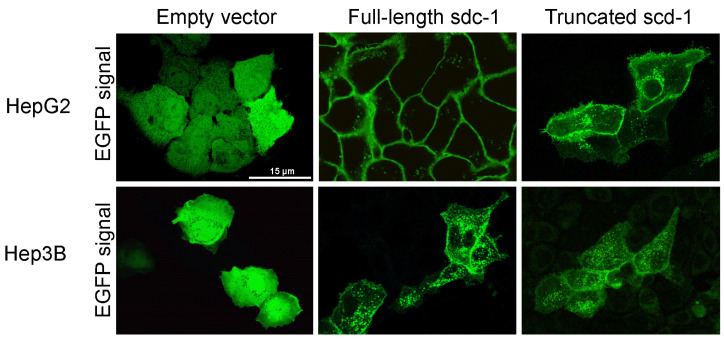
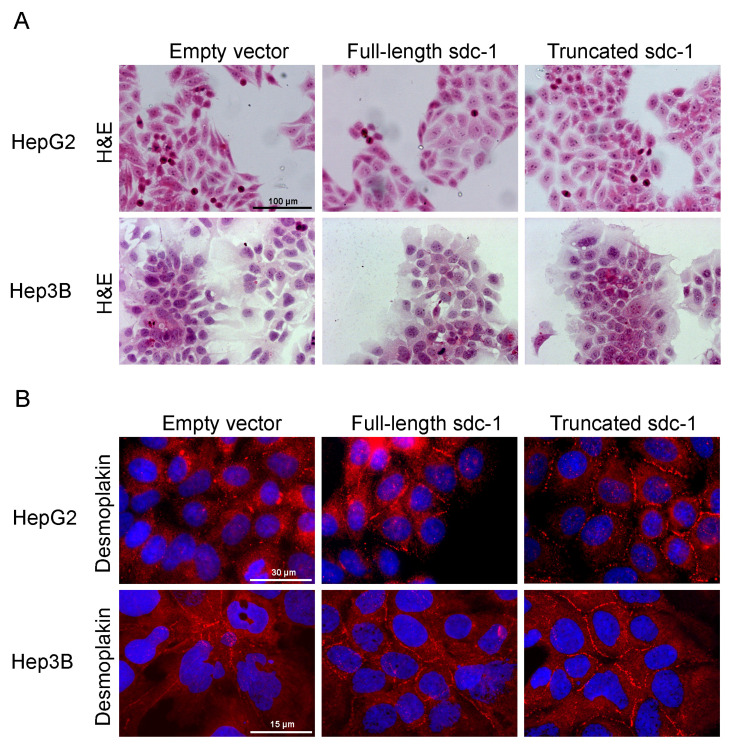
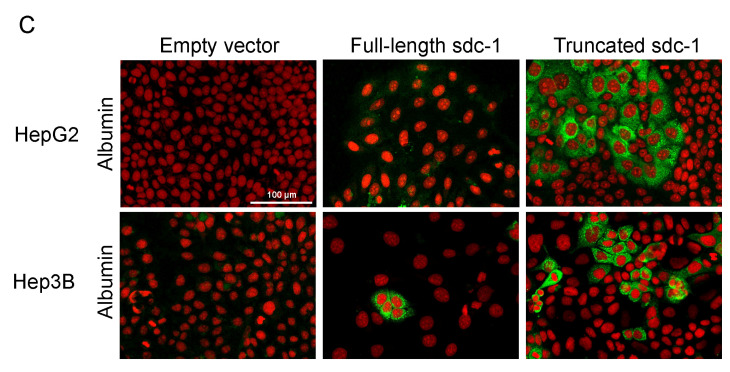
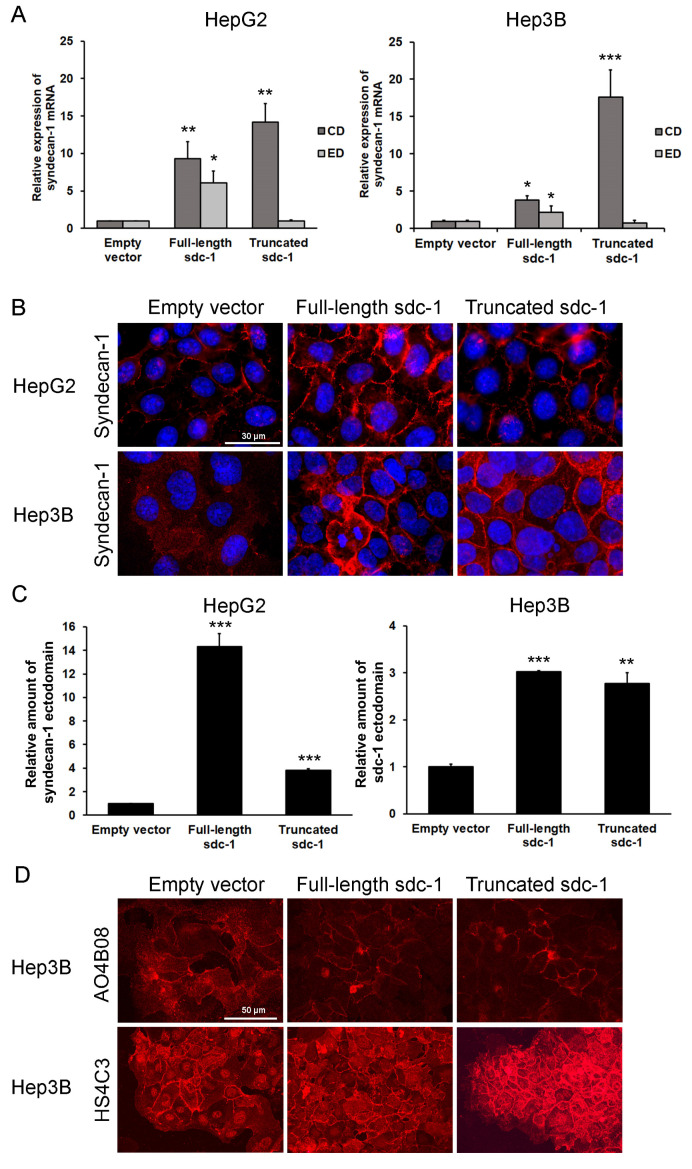
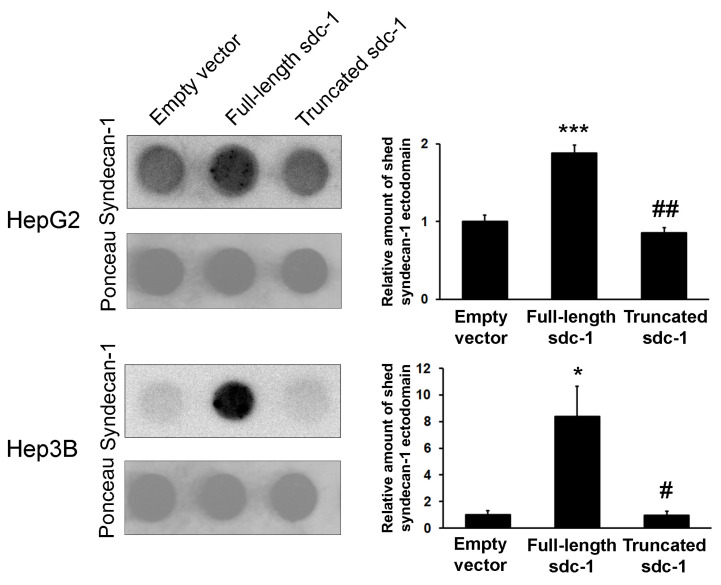
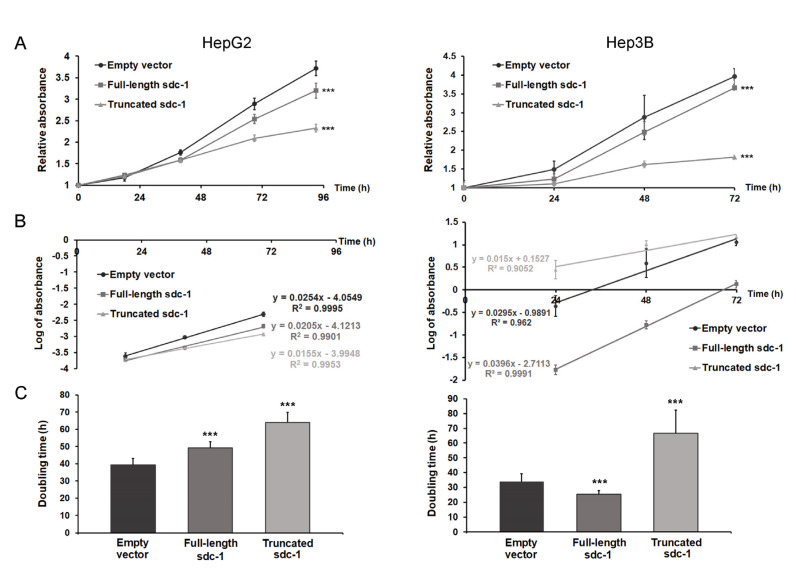
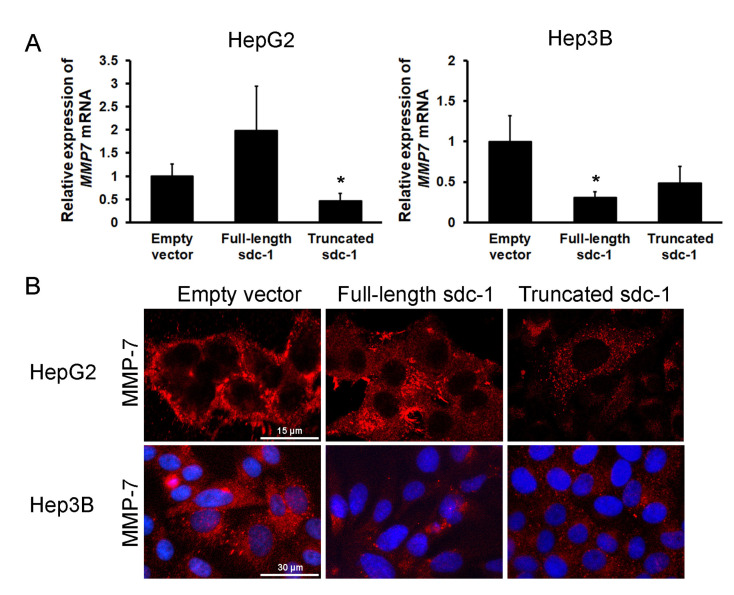
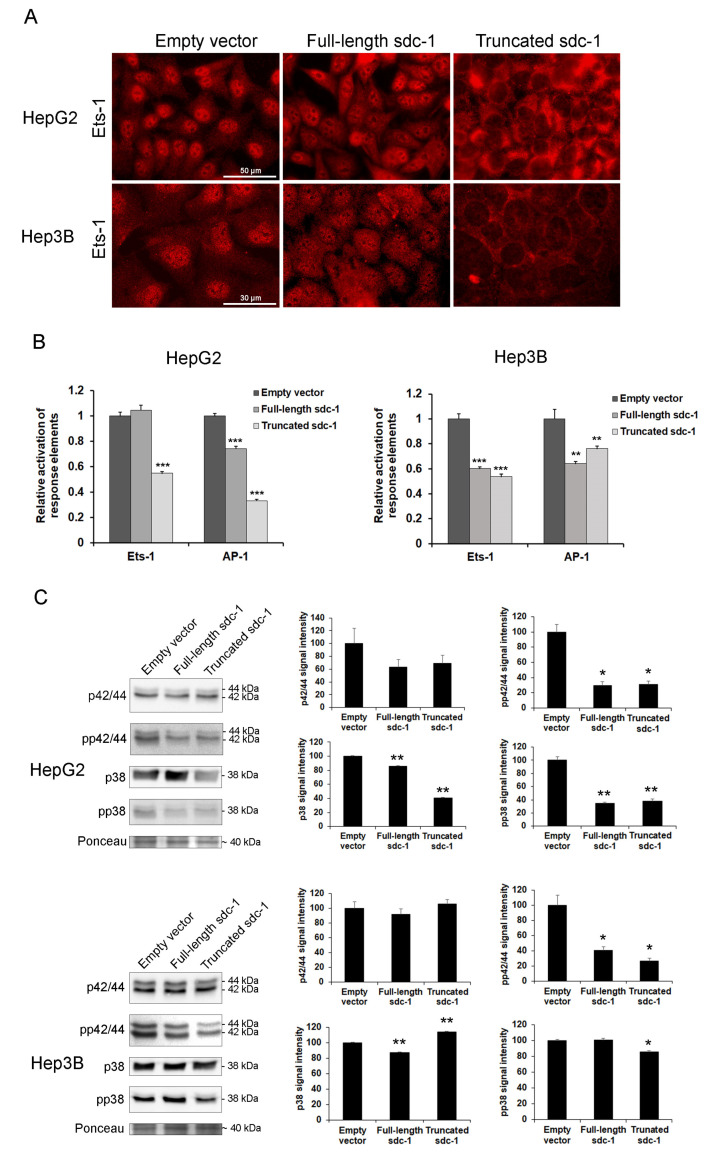
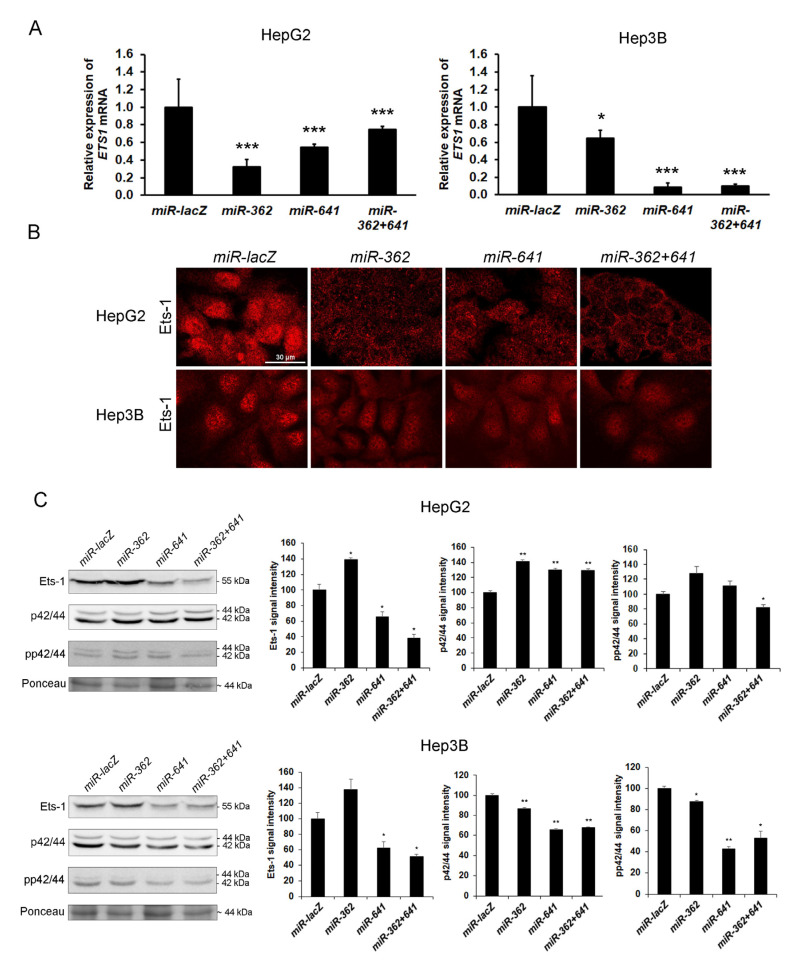
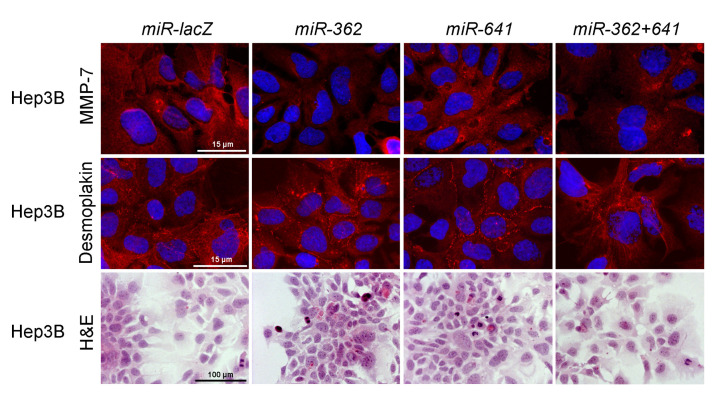
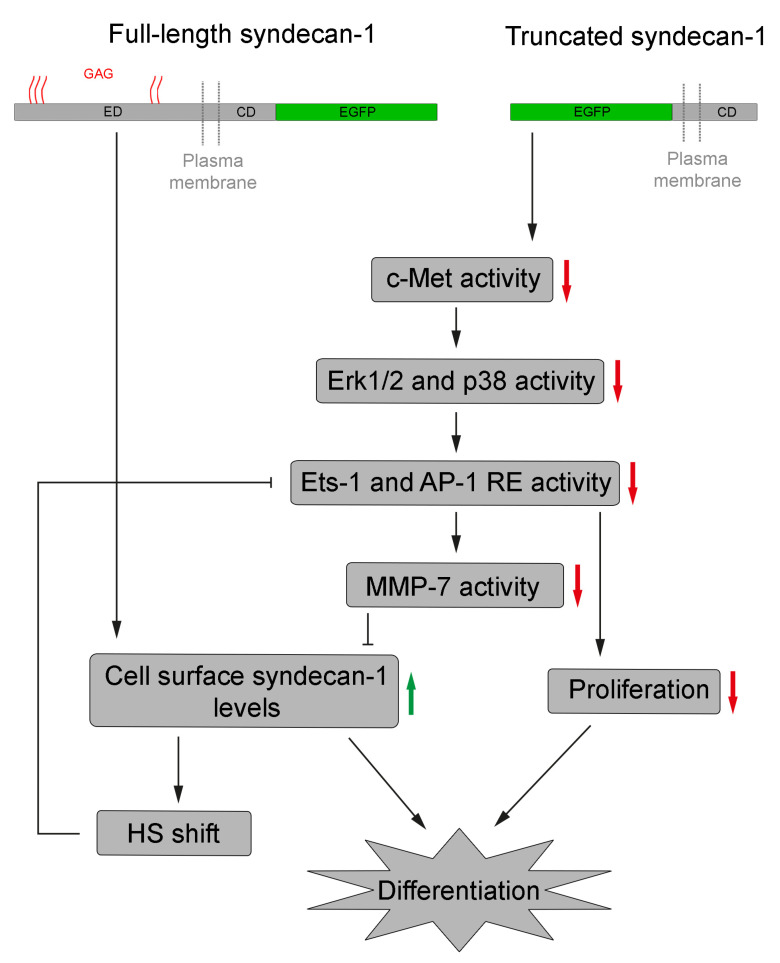
Syndecan-1 is a transmembrane heparan sulfate proteoglycan which is indispensable in the structural and functional integrity of epithelia. Normal hepatocytes display strong cell surface expression of syndecan-1; however, upon malignant transformation, they may lose it from their cell surfaces. In this study, we demonstrate that re-expression of full-length or ectodomain-deleted syndecan-1 in hepatocellular carcinoma cells downregulates phosphorylation of ERK1/2 and p38, with the truncated form exerting an even stronger effect than the full-length protein. Furthermore, overexpression of syndecan-1 in hepatoma cells is associated with a shift of heparan sulfate structure toward a highly sulfated type specific for normal liver. As a result, cell proliferation and proteolytic shedding of syndecan-1 from the cell surface are restrained, which facilitates redifferentiation of hepatoma cells to a more hepatocyte-like phenotype. Our results highlight the importance of syndecan-1 in the formation and maintenance of differentiated epithelial characteristics in hepatocytes partly via the HGF/ERK/Ets-1 signal transduction pathway. Downregulation of Ets-1 expression alone, however, was not sufficient to replicate the phenotype of syndecan-1 overexpressing cells, indicating the need for additional molecular mechanisms. Accordingly, a reporter gene assay revealed the inhibition of Ets-1 as well as AP-1 transcription factor-induced promoter activation, presumably an effect of the heparan sulfate switch.

Keywords: AP-1; Ets-1; MMP-7; differentiation; epithelium; heparan sulfate; liver cancer; shedding; syndecan-1.


Conflict of interest statement

The author (L.S.) is founder of Szilak Laboratories Bioinformatics and Molecule-Design Ltd. This founder provided the syndecan-1 constructs taking part in the design of the study. The author (P.T.) is employed by Solvo Biotechnology. The funder (Solvo Biotechnology) provided support in the form of author’s salaries for the author (P.T.), but did not have any additional role in the design of the study; in the collection, analyses, or interpretation of data; in the writing of the manuscript, or in the decision to publish the results. The remaining authors declare no conflict of interest.

Figures

Figure 1
Figure 1
Immunofluorescence images of HepG2 and Hep3B cells after transfection with empty enhanced green fluorescent protein (EGFP) vector, as well as full-length and truncated syndecan-1 EGFP constructs. A diffuse green signal was seen after transfection with the empty vector. Upon transfection with the full-length syndecan-1 construct, the fluorescent signal localized to the cell membrane. Although truncated syndecan-1 partly localized to the cytoplasm, the signal was enriched at the plasma membrane, indicating that truncated syndecan-1, lacking the extracellular domain, was sorted successfully. Representative images are at 1000× magnification (scale bar 15 μm).
Figure 2
Figure 2
Hepatocyte-like differentiation of HepG2 and Hep3B cells upon overexpression of full-length or truncated syndecan-1. (A) H&E stained empty vector transfected control cells were oval or spindle shape with prominent nuclei and high nucleus-to-cytoplasm ratio, and featured frequent cell divisions. In the syndecan-1-transfected cell lines, the numbers of poorly differentiated and dividing cells decreased, and groups of cells with a more hepatocyte-like morphology appeared. Cells showing signs of differentiation were characterized by a lower nucleus-to-cytoplasm ratio; (B) As a sign of cell differentiation, desmoplakin immunocytochemistry showed relocalization of the protein to the cell surface in syndecan-1-transfected cells. In the native hepatoma cell lines, desmoplakin mainly localized to the cytoplasm. Red, desmoplakin and blue, nuclei; (C) Numerous albumin-positive cells were detected among the truncated syndecan-1 transfectants. Green, albumin and red, nuclei. Representative images are at 1000× magnification (scale bar 15 μm), 600× magnification (scale bar 30 μm), and 200× magnification (scale bar 100 μm).
Figure 2
Figure 2
Hepatocyte-like differentiation of HepG2 and Hep3B cells upon overexpression of full-length or truncated syndecan-1. (A) H&E stained empty vector transfected control cells were oval or spindle shape with prominent nuclei and high nucleus-to-cytoplasm ratio, and featured frequent cell divisions. In the syndecan-1-transfected cell lines, the numbers of poorly differentiated and dividing cells decreased, and groups of cells with a more hepatocyte-like morphology appeared. Cells showing signs of differentiation were characterized by a lower nucleus-to-cytoplasm ratio; (B) As a sign of cell differentiation, desmoplakin immunocytochemistry showed relocalization of the protein to the cell surface in syndecan-1-transfected cells. In the native hepatoma cell lines, desmoplakin mainly localized to the cytoplasm. Red, desmoplakin and blue, nuclei; (C) Numerous albumin-positive cells were detected among the truncated syndecan-1 transfectants. Green, albumin and red, nuclei. Representative images are at 1000× magnification (scale bar 15 μm), 600× magnification (scale bar 30 μm), and 200× magnification (scale bar 100 μm).
Figure 3
Figure 3
Syndecan-1 mRNA and protein levels in the empty vector and syndecan-1 transfected HepG2 and Hep3B cell lines. (A) Transcripts coding for the extracellular domain (ED) and the cytoplasmic domain (CD) of syndecan-1 were elevated in the full-length transfectants, while the expression of the CD only was increased in the truncated transfectants, whereas that of the ectodomain-coding transcript remained unchanged; (B) High amounts of full-length (ectodomain-containing) syndecan-1 protein were detected on the surface of both full-length and truncated syndecan-1 transfectants by immunofluorescence using an ectodomain-specific antibody; (C) ELISA confirmed elevation of full-length syndecan-1 in both transfectants; (D) A comparison with the empty vector-transfected cells, shows that the abundance of AO4B08-reactive (internal 2-O-sulfated/6-O-sulfated) HS epitopes are decreased, whereas the amount of HS4C3-reactive (highly sulfated, 3-O-sulfated) epitopes are increased in both Hep3B cell lines containing syndecan-1 constructs. Data points represent the mean ± standard deviation (SD), n = 3; * p < 0.05; ** p < 0.01; *** p < 0.001 versus the empty vector control. Representative images are at 600× magnification (scale bar 30 μm) and 400× magnification (scale bar 50 μm).
Figure 4
Figure 4
Shedding of syndecan-1 ectodomain. The amount of shed (soluble) syndecan-1 ectodomain was measured from cell culture media (CCM) by ectodomain-specific antibody. Shedding of the ectodomain was increased in full-length transfectants, whereas it remained unchanged in truncated transfectants in spite of the overall increased abundance of endogenous syndecan-1 (see Figure 3B). Data points represent the mean ± SD, n = 2; * p < 0.05; *** p < 0.001 versus the empty vector transfectant; # p < 0.05; ## p < 0.01 versus the full-length sdc-1 transfectant.
Figure 5
Figure 5
The effect of syndecan-1 overexpression on the proliferation of HepG2 and Hep3B cell lines. (A) Transfection with the truncated syndecan-1 construct significantly slowed down the proliferation of both HepG2 and Hep3B cell lines. A moderate decrease in the proliferation of HepG2 full-length transfectant was also observed. Notably, overexpression of full-length syndecan-1 in Hep3B cells led to a decrease in double time from 33.89 to 25.27 h (by 25.4%); (B) The log phase of growth curves; (C) Doubling time calculated from the log phase of growth curves. Data points represent the mean ± SD, n = 8; *** p < 0.001 versus the empty vector transfectant.
Figure 6
Figure 6
The effect of syndecan-1 constructs on MMP-7 expression. (A) Except for HepG2 transfected with full-length syndecan-1, all other syndecan-1 transfectants displayed decreased MMP7 mRNA expression and (B) protein levels as compared with the empty vector transfected cells. Red, MMP-7 and blue, nuclei. Data points represent the mean ± SD, n = 3; * p < 0.05 versus the empty vector transfectant. Representative images are at 1000× magnification (scale bar 15 μm) and 600× magnification (scale bar 30 μm).
Figure 7
Figure 7
Decreased activity of Ets-1 and AP-1 upon syndecan-1 overexpression. (A) Intensive nuclear Ets-1 immunopositivity was present in the empty vector-transfected hepatoma cell lines. A modest decrease of the staining intensity was found in the full-length syndecan-1 transfected cells, whereas nuclei of truncated syndecan-1 transfectants showed hardly any Ets-1 immunoreaction. The protein was partially (full-length) or totally (truncated) sequestered in the cytoplasm; (B) In HepG2, decreased Ets-1 response element-driven promoter activity was found in the truncated transfectants, whereas AP-1 response element-driven promoter activity was suppressed in both full-length and truncated syndecan-1 cell lines. In Hep3B, both syndecan-1 constructs interfered with Ets-1 and AP-1 response element-driven promoter activity; (C) Transfection with either syndecan-1 construct inhibited the activation of ERK1/2 and p38 MAP kinases. Data points represent the mean ± SD, (B) n = 3, (C) n = 2; * p < 0.05; ** p < 0.01; *** p < 0.001 versus the empty vector transfectant. Representative images are at 600× magnification (scale bar 30 μm) and 400× magnification (scale bar 50 μm).
Figure 8
Figure 8
Silencing of Ets-1 by RNA interference in HepG2 and Hep3B cells. (A) As indicated by the qRT-PCR results, knockdown of Ets-1 expression was successful in both cell lines; (B) The silencing constructs effectively hindered Ets-1 protein expression; (C) Except for miR-362, Western blots confirmed the downregulation of Ets-1; however, inactivation of ERK1/2 was mostly detected in Hep3B cell line. Data points represent the mean ± SD, (A) n = 3, (C) n = 2; * p < 0.05; ** p < 0.01; *** p < 0.001 versus miR-lacZ transfectant. Representative images are at 600× magnification (scale bar 30 μm).
Figure 9
Figure 9
Changes in cell morphology upon Ets-1 silencing. With regard to inhibition of MMP-7 and differentiation, miRNAs targeting Ets-1 failed to fully replicate the changes observed after syndecan-1 transfection. The miR-641 did not inhibit the expression of MMP-7 and only modest desmoplakin relocalization was detected. H&E staining showed very few differentiated cells throughout the various transfectants. Representative images are at 1000× magnification (scale bar 15 μm) and 200× magnification (scale bar 100 μm).
Figure 10
Figure 10
A schematic model to explain the effects of syndecan-1 overexpression. The central event is the accumulation of intact syndecan-1 molecules on the cell surface. This is achieved directly in cells transfected with the full-length construct and indirectly in cells transfected with the truncated syndecan-1 construct. The downstream effect is reduced Ets-1- and AP-1-mediated promoter activation with subsequent inhibition of cell proliferation and differentiation. RE, response element and GAG, glycosaminoglycan.

Similar articles

Cited by

References

    1. Ferlay J., Soerjomataram I., Dikshit R., Eser S., Mathers C., Rebelo M., Parkin D.M., Forman D., Bray F. Cancer incidence and mortality worldwide: Sources, methods and major patterns in GLOBOCAN 2012. Int. J. Cancer. 2015;136:E359–E386. doi: 10.1002/ijc.29210. - DOI - PubMed
    1. Theise N.D., Curado M.P., Franceschi S., Hytiroglou P., Kudo M., Park Y.N., Sakamoto M., Torbenson M., Wee A. Tumours of the liver and intrahepatic bile ducts: Hepatocellular carcinoma. In: Bosman F.T., Carneiro F., Hruban R.H., Theise N.D., editors. World Health Organization Classification of Tumours of the Digestive System. 4th ed. Volume 3. IARC Press; Lyon, France: 2010. pp. 205–216.
    1. Laurent-Puig P., Zucman-Rossi J. Genetics of hepatocellular tumors. Oncogene. 2006;25:3778–3786. doi: 10.1038/sj.onc.1209547. - DOI - PubMed
    1. Aravalli R.N., Steer C.J., Cressman E.N. Molecular mechanisms of hepatocellular carcinoma. Hepatology. 2008;48:2047–2063. doi: 10.1002/hep.22580. - DOI - PubMed
    1. Rapraeger A., Jalkanen M., Endo E., Koda J., Bernfield M. The cell surface proteoglycan from mouse mammary epithelial cells bears chondroitin sulfate and heparan sulfate glycosaminoglycans. J. Biol. Chem. 1985;260:11046–11052. - PubMed

Publication types

MeSH terms