. 2020 Sep 23;21(19):7006.
doi: 10.3390/ijms21197006.

Cytotoxic and Senolytic Effects of Methadone in Combination with Temozolomide in Glioblastoma Cells

Affiliations

Cytotoxic and Senolytic Effects of Methadone in Combination with Temozolomide in Glioblastoma Cells

Bernd Kaina et al. Int J Mol Sci. .

Abstract

Methadone is an analgesic drug used for pain treatment and heroin substitution. Recently, methadone has been proposed to be useful also for cancer therapy, including glioblastoma multiforme (GBM), the most severe form of brain cancer, because experiments on cultured glioma cells treated with doxorubicin showed promising results. Doxorubicin, however, is not used first-line in GBM therapy. Therefore, we analyzed the cytotoxic effect of methadone alone and in combination with temozolomide, a DNA-alkylating drug that is first-line used in GBM treatment, utilizing GBM-derived cell lines and a human fibroblast cell line. We show that methadone is cytotoxic on its own, inducing apoptosis and necrosis, which was observed at a concentration above 20 µg/mL. Methadone was similar toxic in isogenic MGMT expressing and non-expressing cells, and in LN229 glioblastoma and VH10T human fibroblasts. The apoptosis-inducing activity of methadone is not bound on the opioid receptor (OR), since naloxone, a competitive inhibitor of OR, did not attenuate methadone-induced apoptosis/necrosis. Administrating methadone and temozolomide together, temozolomide had no impact on methadone-induced apoptosis (which occurred 3 days after treatment), while temozolomide-induced apoptosis (which occurred 5 days after treatment) was unaffected at low (non-toxic) methadone concentration (5 µg/mL), and at high (toxic) methadone concentration (20 µg/mL) the cytotoxic effects of methadone and temozolomide were additive. Methadone is not genotoxic, as revealed by comet and γH2AX assay, and did not ameliorate the genotoxic effect of temozolomide. Further, methadone did not induce cellular senescence and had no effect on temozolomide-induced senescence. Although methadone was toxic on senescent cells, it cannot be considered a senolytic drug since cytotoxicity was not specific for senescent cells. Finally, we show that methadone had no impact on the MGMT promoter methylation. Overall, the data show that methadone on glioblastoma cells in vitro is cytotoxic and induces apoptosis/necrosis at doses that are above the level that can be achieved in vivo. It is not genotoxic, and does not ameliorate the cell killing or the senescence-inducing effect of temozolomide (no synergistic effect), indicating it has no impact on temozolomide-induced signaling pathways. The data do not support the notion that concomitant methadone treatment supports temozolomide-based chemotherapy.

Keywords: apoptosis; cancer therapy; drug resistance; glioblastoma; methadone; senescence; temozolomide.


Conflict of interest statement

The authors declare no conflict of interest. The funders had no role in the design of the study; in the collection, analyses, or interpretation of data; in the writing of the manuscript, or in the decision to publish the results. The opinions mentioned throughout the following article are personal views of the authors and do not reflect an official position of the Federal Institute for Drugs and Medical Devices or an EMA-committee or working party, respectively.

Figures

Figure 1
Figure 1
Cytotoxicity of methadone (MTD) on LN229 cells without and with co-treatment with temozolomide (TMZ). (A) Viability of LN229 cells, measured by the MTT assay, as a function of MTD concentration in the medium. (B) Viability of LN229 cells treated with 20 µM TMZ and (C) 75 µM TMZ and increasing concentrations of MTD. The MTT assay was performed 96 h after the addition of MTD to the medium. Data are the mean of three independent experiments.
Figure 2
Figure 2
Cytotoxicity of TMZ measured in the MTT assay in the absence and presence of MTD. (A) Exponentially growing cells were treated with TMZ and increasing concentrations of MTD. Data are the mean of three separate experiments. (B) Induced effect of TMZ (20 and 75 µM, left and right panel, respectively) on the viability of LN229 cells co-treated with MTD. The toxic effect induced by MTD was subtracted from the effect obtained after combined treatment, shown in panel A for 20 µM TMZ. Viability was measured 120 h after addition of the drugs to the medium.
Figure 3
Figure 3
Apoptosis and necrosis induced in different glioblastoma cell lines and human fibroblasts VH10T. Exponentially growing cells were cultivated in medium with increasing concentrations of MTD, harvested, annexin V and propidium iodine (annexin V/PI) stained and measured by flow cytometry. Cells were analyzed 72 h after addition of MTD to the medium. Data are the mean of three independent experiments. n.d., not detectable.
Figure 4
Figure 4
Level of cellular senescence in LN229 and A172 glioblastoma cells treated with MTD. Cells were harvested and measured 72 h after addition of MTD to the medium of exponentially growing cells. Data are the mean of three independent experiments. * p < 0.05; ** p < 0.01.
Figure 5
Figure 5
Expression of µ-opioid receptor MOR-1 in LN229 and A172 cells and effect of naloxone. (A) For comparison the level in human diploid fibroblasts VH10T are shown. The effect of TMZ on the receptor expression level was quantified in relation to the non-treated control, which was set to 1.0. (B) Effect of naloxone on MTD-induced cell death. Naloxone was administered 30 min before the addition of MTD to the medium. Data are the mean of three independent experiments.
Figure 6
Figure 6
Effect of TMZ on MTD-induced apoptosis/necrosis in LN229 and A172 cells, measured 72 h after treatment. Data are the mean of three independent experiments. The differences between MTD and MTD-TMZ were in both cell lines not significant.
Figure 7
Figure 7
Effect of MTD alone (control) and in combination with TMZ (20 µM) on TMZ-induced apoptosis and necrosis, measured by AV/PI flow cytometry. Cells were harvested and analyzed 96 h after the addition of TMZ and MTD to the medium.
Figure 8
Figure 8
Effect of MTD on TMZ-induced apoptosis and necrosis, measured by AV/PI flow cytometry. (A) Percentage of apoptotic and necrotic cells in the population, determined 120 h after treatment. Data are the mean of three independent experiments. (B) TMZ-MTD induced cell death (apoptosis/necrosis). Observed levels after combined treatment and expected frequencies on the basis of additivity of single-drug treatment.
Figure 9
Figure 9
Effect of MTD on TMZ-induced senescence. (A) Induction of senescence by TMZ in LN229 cells and effect of MTD co-treatment on senescence induction. (B) Effect of MTD on the TMZ-induced senescent cell level. Data are the mean of three independent experiments +/-SEM. * p ≤ 0.05.
Figure 10
Figure 10
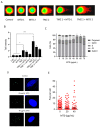
Effect of MTD on genotoxicity of TMZ and cell cycle distribution. (A) Comet assay, MTD alone (control) and in combination with TMZ, measured by the alkaline comet assay. Representative pictures are shown. (B) Quantification: TMZ 1, 100 µM; TMZ 2, 200 µM; MTD 1, 10 µg/mL, MTD 2, 30 µg/mL. Data represent the mean of three independent experiments ± SEM. * p < 0.05; *** p < 0.001. (C) Cell cycle distribution of LN229 cells treated with increasing concentrations of MTD. * indicates significant difference (p > 0.05) of S and G2 fraction from control. (D) Representative pictures of γH2AX foci and (E) foci levels in LN229 cells measured 24 h after addition of MTD to the medium. The differences in the mean foci number between control and MTD are statistically not significant.
Figure 11
Figure 11
MGMT promoter methylation in glioma cells cultivated in the absence and presence of methadone. Con, control without MTD; MTD, 10 µg/mL for a period of 72 h. Separately harvested extracts of non-treated human HaCaT cells were used as a control for the unmethylated promoter, and LN229 for the methylated promoter. WE, without cell extract. U, unmethylated; M, methylated.

References

    1. Stupp R., Mason W.P., Van Den Bent M.J., Weller M., Fisher B., Taphoorn M.J., Belanger K., Brandes A.A., Marosi C., Curschmann J., et al. Radiotherapy plus concomitant and adjuvant temozolomide for glioblastoma. N. Engl. J. Med. 2005;352:987–996. doi: 10.1056/NEJMoa043330. - DOI - PubMed
    1. Hegi M.E., Diserens A.C., Gorlia T., Hamou M.F., De Tribolet N., Weller M., Kros J.M., Hainfellner J.A., Mason W., Bromberg J.E., et al. MGMT gene silencing and benefit from temozolomide in glioblastoma. N. Engl. J. Med. 2005;352:997–1003. doi: 10.1056/NEJMoa043331. - DOI - PubMed
    1. Anton K., Baehring J.M., Mayer T. Glioblastoma multiforme: Overview of current treatment and future perspectives. Hematol. Oncol. Clin. N. Am. 2012;26:825–853. doi: 10.1016/j.hoc.2012.04.006. - DOI - PubMed
    1. Friesen C., Roscher M., Alt A., Miltner E. Methadone, commonly used as maintenance medication for outpatient treatment of opioid dependence, kills leukemia cells and overcomes chemoresistance. Cancer Res. 2008;68:6059–6064. doi: 10.1158/0008-5472.CAN-08-1227. - DOI - PubMed
    1. Friesen C., Hormann I., Roscher M., Fichtner I., Alt A., Hilger R., Debatin K.-M., Miltner E. Opioid receptor activation triggering downregulation of cAMP improves effectiveness of anti-cancer drugs in treatment of glioblastoma. Cell Cycle. 2014;13:1560–1570. doi: 10.4161/cc.28493. - DOI - PMC - PubMed

MeSH terms