. 2020 Sep 23;12(10):1067.
doi: 10.3390/v12101067.

Identification of Modulators of HIV-1 Proviral Transcription from a Library of FDA-Approved Pharmaceuticals

Affiliations

Identification of Modulators of HIV-1 Proviral Transcription from a Library of FDA-Approved Pharmaceuticals

Gavin C Sampey et al. Viruses. .

Abstract

Human immunodeficiency virus 1 (HIV-1) is the most prevalent human retrovirus. Recent data show that 34 million people are living with HIV-1 worldwide. HIV-1 infections can lead to AIDS which still causes nearly 20,000 deaths annually in the USA alone. As this retrovirus leads to high morbidity and mortality conditions, more effective therapeutic regimens must be developed to treat these viral infections. A key target for intervention for which there are no current FDA-approved modulators is at the point of proviral transcription. One successful method for identifying novel therapeutics for treating infectious diseases is the repurposing of pharmaceuticals that are approved by the FDA for alternate indications. Major benefits of using FDA-approved drugs include the fact that the compounds have well established toxicity profiles, approved manufacturing processes, and immediate commercial availability to the patients. Here, we demonstrate that pharmaceuticals previously approved for other indications can be utilized to either activate or inhibit HIV-1 proviral transcription. Specifically, we found febuxostat, eltrombopag, and resveratrol to be activators of HIV-1 transcription, while mycophenolate was our lead inhibitor of HIV-1 transcription. Additionally, we observed that the infected cells of lymphoid and myeloid lineage responded differently to our lead transcriptional modulators. Finally, we demonstrated that the use of a multi-dose regimen allowed for enhanced activation with our transcriptional activators.

Keywords: HIV; activator; eltrombopag; febuxostat; inhibitor; latency; mycophenolate; resveratrol; transcription.


Conflict of interest statement

The authors declare no conflict of interest.

Figures

Figure 1
Figure 1
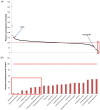
Initial identification of the activators of TZM-bl drug screen. (A) Ranked plot of all 420 FDA-approved drugs screened against pcTat-activated TZM-bl reporter cells. The average luminescence reading of the DMSO controls was set to 100% (red line) and all experimental readings were normalized to the DMSO control. Control transcriptional activator SAHA and control transcriptional inhibitor flavopiridol are indicated and the top seven activators are within the green box. (B) Ranked plotting and identification of the top 20 activators of the pcTat-TZM-bl reporter assay. The top 7 activators are indicated in the red box.
Figure 1
Figure 1
Initial identification of the activators of TZM-bl drug screen. (A) Ranked plot of all 420 FDA-approved drugs screened against pcTat-activated TZM-bl reporter cells. The average luminescence reading of the DMSO controls was set to 100% (red line) and all experimental readings were normalized to the DMSO control. Control transcriptional activator SAHA and control transcriptional inhibitor flavopiridol are indicated and the top seven activators are within the green box. (B) Ranked plotting and identification of the top 20 activators of the pcTat-TZM-bl reporter assay. The top 7 activators are indicated in the red box.
Figure 2
Figure 2
Cytomegalovirus (CMV)-luciferase activation and toxicity screens. (A) The top seven activators identified in the initial TZM-bl screen were tested in pc-Luc-transfected HeLa cells to determine the activation of the CMV promoter. (BD) The five lead activators that did not activate the CMV promoter were tested for toxicity in the HeLa (B), CEM (C), and Jurkat (D) cell lines. All experimental conditions were conducted in biological triplicate and error bars indicate ±1 SD. Conditions marked by red boxes indicate p values < 0.05 when compared to DMSO treatment.
Figure 3
Figure 3
Transcriptional activation of latent ACH2 and OM10.1 cell lines. The three remaining lead activators were used to treat the latently HIV-1-infected ACH2 T cell line in the absence of antiretroviral therapy (ART) pre-treatment (A), or after 11 days of ART treatment (B). Similarly, the latently HIV-1-infected OM10.1 promyelocytic cell line was also treated with the lead activators in the absence (C) or presence of ART treatment (D). RNA was isolated from cellular pellets by Trizol extraction for each sample and the intracellular viral transcripts were quantified by RT-qPCR using primers for the envelope (ENV) gene. Total transcripts for each experiment were normalized to the RNA concentration input into each RT reaction. All experimental conditions were conducted in biological triplicate and error bars indicate ± 1 SD. ** indicates p value < 0.05 when compared to the DMSO treatment.
Figure 4
Figure 4
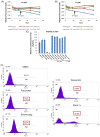
Single-dose of activators with the Jurkat E4 latent reporter cell line. The three remaining activators were tested against the latent reporter cell line Jurkat E4. (A) Flow cytometry data indicate GFP activation by all three activators at 48 h post-treatment at either 0.5 or 1.0 µM concentrations. (B) Similarly, testing GFP activation using a plate reader shows activation at 24 and 48 h post-treatment with both 0.5 and 1.0 µM concentrations but a rapid loss of activation by 72 h. (C) Lastly, the viability of the Jurkat E4 cell line was not negatively impacted by the single-dose administration of either 0.5 or 1.0 µM of the experimental activators, although 0.5 µM of SAHA was highly toxic.
Figure 5
Figure 5
Multi-dose regimen of activators with the Jurkat E4 latent reporter cell line. (A,B) The addition of a second dose of each activator 24 h after the initial dose allowed for the sustained activation out to 72 h post-initial dosing (0.5 µM panel A, 1.0 µM panel (B). (C) Viability of the Jurkat E4 cell line was still not inhibited by the addition of a second dose of experimental activator, while multiple doses of SAHA were highly toxic. (D) Flow cytometry data indicate GFP activation by all three activators at 72 h after the initial treatment using three doses of 1.0 µM at 0, 24 and 48 h.
Figure 6
Figure 6
Initial identification of inhibitors of TZM-bl drug screen. (A) Ranked plot of all 420 FDA-approved drugs screened against pcTat-activated TZM-bl reporter cells. The average luminescence reading of the DMSO controls was set to 100% (red line) and all experimental readings were normalized to the DMSO control. Control transcriptional activator SAHA and control transcriptional inhibitor flavopiridol are indicated and the top seven inhibitors are within the red box. (B) The ranked plotting and identification of the top 20 inhibitors of the pcTat-TZM-bl reporter assay. The top 7 inhibitors are indicated in the red box.
Figure 7
Figure 7
CMV-luciferase inhibition and toxicity screens. (A) The top seven inhibitors identified in the initial TZM-bl screen were tested in pc-Luc-transfected HeLa cells to determine the inhibition of the CMV promoter. (BD) The two lead inhibitors that did not inhibit the CMV promoter were tested for toxicity in the HeLa (B), CEM (C), and Jurkat (D) cell lines. All experimental conditions were conducted in biological triplicate and error bars indicate ±1 SD. Conditions marked by red boxes indicate p values < 0.05 when compared to DMSO treatment.
Figure 8
Figure 8
Transcriptional inhibition of chronically infected J1.1 and OM10.1 cell lines. The remaining lead inhibitor, mycophenolate, and control inhibitor flavopiridol, were used to treat the chronically HIV-1-infected J1.1 T cell line and intracellular ENV copies were quantified by RT-qPCR and normalized to the RNA input into the RT reaction. The J1.1 drug treatment occurred either in the absence of PMA activation (A), or 48 h post-PMA treatment (B). Similarly, the HIV-1-infected OM10.1 promyelocytic cell line was also treated with mycophenolate or flavopiridol in the absence (C) or presence of PMA pre-treatment (D). All experimental conditions were conducted in biological triplicate and error bars indicate ± 1 SD. ** indicates p value < 0.05 when compared to DMSO treatment.
Figure 9
Figure 9
Transcriptional activation or inhibition of the infected primary T cells or monocyte-derived macrophages (MDMs) with lead modulators. T cells and MDMs were isolated from fresh peripheral blood mononuclear cells (PBMCs) from four donors, infected with 89.6 dual tropic HIV-1, then maintained on ART for 10 days. After ART treatment, both T cells ((A), left panels) and MDMs ((A), right panels) were either untreated, dosed with 1 µM of eltrombopag or 1 µM of mycophenolate. Copies of ENV and transactivating response (TAR) (upper and lower panels, respectively) were then measured from the cell pellets 72 h after treatment and normalized to the untreated control infections for each donor. The eltrombopag- and mycophenolate-treated T cells ((A), left panels) showed the activation or inhibition, respectively, of the ENV in 3 of 4 infected donors with concurrent and similar relative increases or decreases in TAR. The eltrombopag- and mycophenolate-treated MDMs ((A), right panels) did not show consistent activation or inhibition of infected MDMs, although TAR levels were enhanced in all drug-treated cells except the eltrombopag-treated donor 1. The green and red boxes highlight increases and decreases above the untreated controls, respectively, of ENV and TAR copies. (B) An overview of the findings for the intracellular ENV and TAR copies summarized in tabular form. Here, each “+” indicates an infected donor with a greater than 10% increase in ENV or TAR transcripts, while each “−” indicates an infected donor with a greater than 10% decrease in ENV or TAR transcripts. (C) Additionally, the number of TAR copies was determined both intracellularly (upper panels) and from the culture supernatant (lower panels) of both the T cells (left panels) and MDMs (right panels).
Figure 9
Figure 9
Transcriptional activation or inhibition of the infected primary T cells or monocyte-derived macrophages (MDMs) with lead modulators. T cells and MDMs were isolated from fresh peripheral blood mononuclear cells (PBMCs) from four donors, infected with 89.6 dual tropic HIV-1, then maintained on ART for 10 days. After ART treatment, both T cells ((A), left panels) and MDMs ((A), right panels) were either untreated, dosed with 1 µM of eltrombopag or 1 µM of mycophenolate. Copies of ENV and transactivating response (TAR) (upper and lower panels, respectively) were then measured from the cell pellets 72 h after treatment and normalized to the untreated control infections for each donor. The eltrombopag- and mycophenolate-treated T cells ((A), left panels) showed the activation or inhibition, respectively, of the ENV in 3 of 4 infected donors with concurrent and similar relative increases or decreases in TAR. The eltrombopag- and mycophenolate-treated MDMs ((A), right panels) did not show consistent activation or inhibition of infected MDMs, although TAR levels were enhanced in all drug-treated cells except the eltrombopag-treated donor 1. The green and red boxes highlight increases and decreases above the untreated controls, respectively, of ENV and TAR copies. (B) An overview of the findings for the intracellular ENV and TAR copies summarized in tabular form. Here, each “+” indicates an infected donor with a greater than 10% increase in ENV or TAR transcripts, while each “−” indicates an infected donor with a greater than 10% decrease in ENV or TAR transcripts. (C) Additionally, the number of TAR copies was determined both intracellularly (upper panels) and from the culture supernatant (lower panels) of both the T cells (left panels) and MDMs (right panels).
Figure 10
Figure 10
TZM-bl activation or inhibition with lead modulators using Tat mutants. The three lead HIV-1 activators well as the lead inhibitor were used to treat TZM-bl cells transfected with either wild-type pcFLAG-Tat (A), the K51A mutant of pcFLAG-Tat (B), the K41A mutant of pcFLAG-Tat (C), or mock transfections (D). Additionally, the control activator SAHA and the control inhibitor flavopiridol (100 nM) were tested in all four experimental settings. All drugs were dosed at 1 µM the day after transfection, and luciferase activity was measured 48 h after drug treatment. All experimental conditions were conducted in biological triplicate and error bars indicate ±1 SD. ** indicates p value < 0.05 when compared to the DMSO treatment of the same plasmid transfection.
Figure 11
Figure 11
Dose-dependent activation of TZM-bl with the lead HIV-1 transcriptional activators. Two of the lead HIV-1 activators, febuxostat and eltrombopag, were added to Tat-transfected TZM-bl cells at three concentrations (0.04, 0.2, and 1 µM, or 1, 4, and 16 µM, respectively). Luciferase activity was measured 48 h after drug treatment and all experiments were run in biological triplicate. Mean relative luciferase units ± 1 SD graphed. ** indicates p value < 0.05 when compared to DMSO treatment of the same plasmid transfection.
Figure 12
Figure 12
Western blot analysis of the lead HIV-1 transcriptional activators effects on key T cell and myeloid cell line host cell transcription factors. The three lead HIV-1 transcriptional activators, as well as the control activator SAHA, were used to treat either ACH2 or OM10.1 cell lines at 1 µM each. After 24 h of treatment, whole cell lysates were generated, run on Western blots and probed with antibodies binding to RNA polymerase 2 (phospho-Ser2), total RNA polymerase 2 (C-terminal domain (CTD)), p65 (phospho-Ser536), Cdk9 (phospho-Thr186), Brd4, and AFF4. Additionally, β-Actin was probed for as a loading control.
Figure 13
Figure 13
Transcription factor occupancy on the HIV-1 promoter following activation or suppression. (A) Infected J1.1 T-cells, which normally show a high level of transcription and virus production [81,82], were treated with either flavopiridol (100 nM) or mycophenolic acid. After 48 h, the samples were cross-linked and processed using a chromatin immunoprecipitation (ChIP) assay. Antibodies (~10 µg each) were used against Pol II, Cdk9, HDAC1, SUV39H1, Baf 200 and Baf 250. IgG was used as a control to define the background IP levels normally seen when performing ChIP assays. Primers for PCR assay were against the DNA sequence spanning the NF-κB element and TAR regions. (B) Both log phase growing ACH2 and OM10.1 cells that do not express much full-length viral RNA were treated with cART followed by eltrombopag treatment for 48 h prior to the ChIP assay using anti-Pol II, Cdk9, p65 and Baf200 antibodies.

References

    1. Joint United Nations Programme on HIV/AIDS . United Nations Global Report: UNAIDS Report on the Global AIDS Epidemic: 2012. UNAIDS; Geneva, Switzerland: 2012.
    1. Heaton R.K., Clifford D.B., Franklin D.R., Woods S.P., Ake C., Vaida F., Ellis R.J., Letendre S.L., Marcotte T.D., Atkinson J.H., et al. HIV-associated neurocognitive disorders persist in the era of potent antiretroviral therapy: CHARTER Study. Neurology. 2010;75:2087–2096. doi: 10.1212/WNL.0b013e318200d727. - DOI - PMC - PubMed
    1. US. Federal Funding for HIV/AIDS . The President’s FY 2016 Budget Request. Health and Human Services; Washington, DC, USA: 2016.
    1. Coquet I., Pavie J., Palmer P., Barbier F., Legriel S., Mayaux J., Molina J.M., Schlemmer B., Azoulay E. Survival trends in critically ill HIV-infected patients in the highly active antiretroviral therapy era. Crit. Care. 2010;14:R107. doi: 10.1186/cc9056. - DOI - PMC - PubMed
    1. Mocroft A., Ledergerber B., Katlama C., Kirk O., Reiss P., d’Arminio Monforte A., Knysz B., Dietrich M., Phillips A.N., Lundgren J.D., et al. Decline in the AIDS and death rates in the EuroSIDA study: An observational study. Lancet. 2003;362:22–29. doi: 10.1016/S0140-6736(03)13802-0. - DOI - PubMed

Publication types

Substances