

Clinical effect of conbercept on improving diabetic macular ischemia by OCT angiography
- PMID: 32977791
- PMCID: PMC7519504
- DOI: 10.1186/s12886-020-01648-x
Clinical effect of conbercept on improving diabetic macular ischemia by OCT angiography
Abstract
Background: Varying degrees of macular ischemia generally occur in diabetic retinopathy (DR). This study aims to evaluate the effect of conbercept with 3+ pro re nata (PRN) on macular perfusion status in patients with diabetic macular edema (DME) and quantitatively assess changes in foveal avascular zone (FAZ) areas and capillary density in macular regions by applying optical coherence tomography angiography (OCTA).
Methods: Fifty patients were divided into ischemic (n = 31) and non-ischemic (n = 19) groups according to the presence of ischemia on OCTA at baseline. All patients received intravitreal injections of 0.5 mg of conbercept with 3+ PRN principle. The FAZ areas and macular vessel density measured using OCTA were evaluated at baseline, 3 months, and 6 months after treatment in both groups.
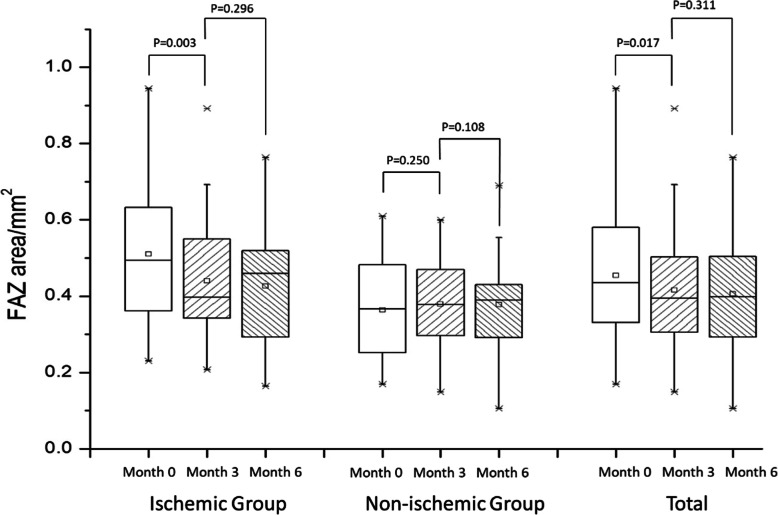
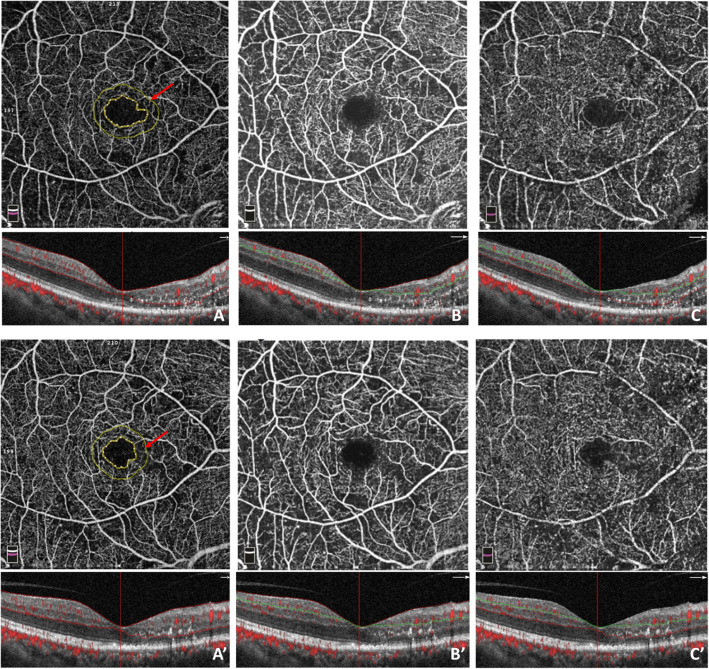
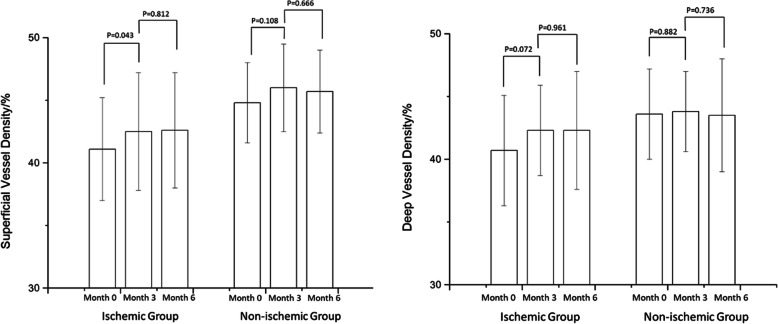
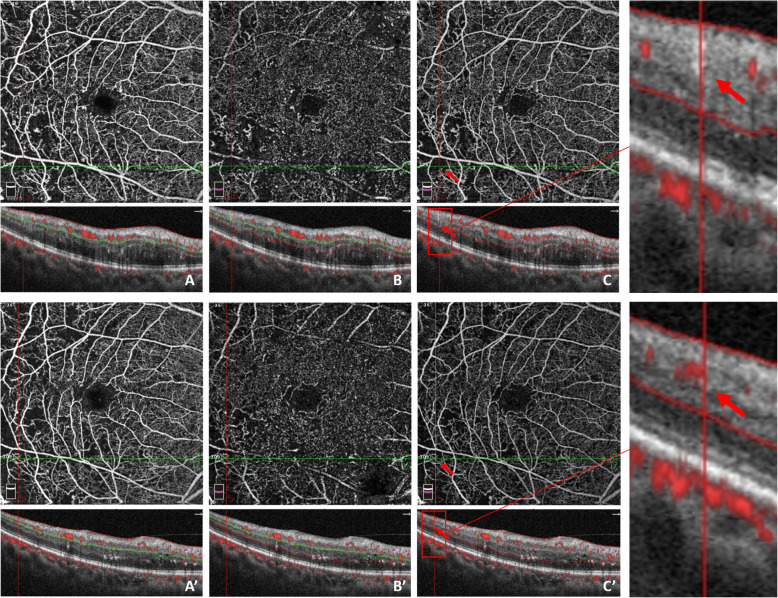
Results: At months 3 and 6, the FAZ area in the ischemic group changed from 0.510 ± 0.171 mm2 to 0.441 ± 0.158 mm2 then to 0.427 ± 0.153 mm2 (p = 0.003, p = 0.296); in the non-ischemic group, it remained stable (p = 0.269, p = 0.926). The superficial vessel density changed from 41.1 ± 4.1 to 42.5% ± 4.7% then to 42.6% ± 4.6% (p = 0.043, p = 0.812), and the deep vessel density changed from 40.7 ± 4.4 to 42.3% ± 3.6% then to 42.3% ± 4.7% (p = 0.072, p = 0.961) in the ischemic group. In the non-ischemic group, the superficial vessel density changed from 44.8 ± 3.2 to 46.0% ± 3.5% then to 45.7% ± 3.3% (p = 0.108, p = 0.666), whereas the deep vessel density changed from 43.6 ± 3.6 to 43.8% ± 3.2% then to 43.5% ± 4.5% (p = 0.882, p = 0.736). Reperfusion in macular nonperfusion areas was observed.
Conclusion: Anti-vascular endothelial growth factor treatment may have a positive effect on macular perfusion status. Furthermore, OCTA had advantages in quantifying and calculating blood flow index in the study of macular perfusion status.
Keywords: Conbercept; Diabetic retinopathy; Macular ischemia; OCT angiography.
Conflict of interest statement
The authors declare that they have no competing interests.
Figures
References
-
- Early Treatment Diabetic Retinopathy Study Research Group. Classification of diabetic retinopathy from fluorescein angiograms: ETDRS report number 11. Ophthalmology. 1991;98(5 Suppl):807–22. - PubMed
MeSH terms
Substances
LinkOut - more resources
Full Text Sources
Medical
