. 2020 Sep 25;13(1):128.
doi: 10.1186/s13045-020-00941-y.

A single-cell survey of cellular hierarchy in acute myeloid leukemia

Affiliations

A single-cell survey of cellular hierarchy in acute myeloid leukemia

Junqing Wu et al. J Hematol Oncol. .

Abstract

Background: Acute myeloid leukemia (AML) is a fatal hematopoietic malignancy and has a prognosis that varies with its genetic complexity. However, there has been no appropriate integrative analysis on the hierarchy of different AML subtypes.

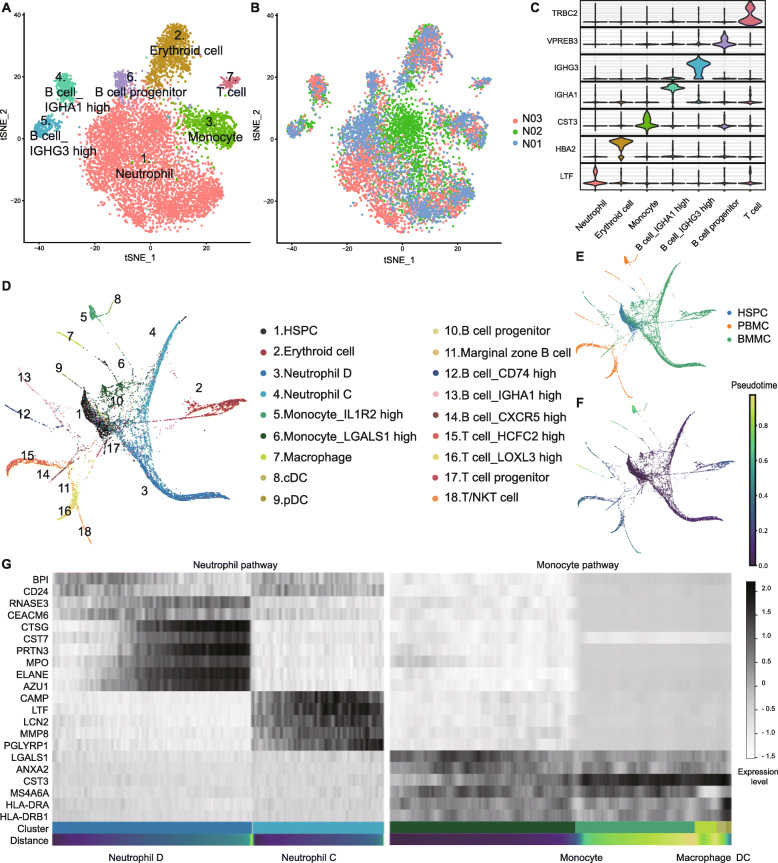
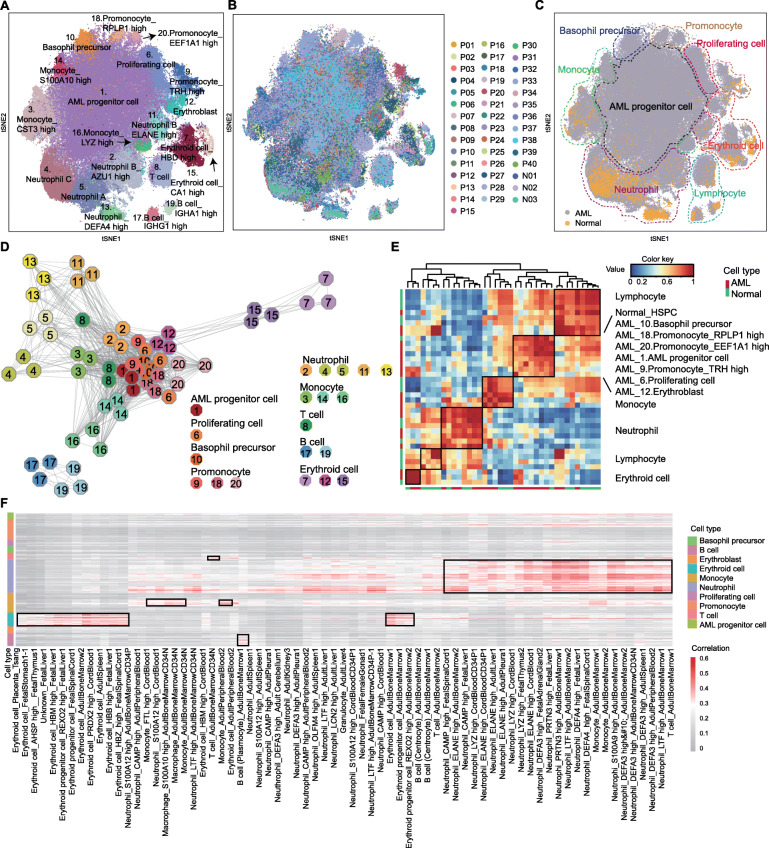
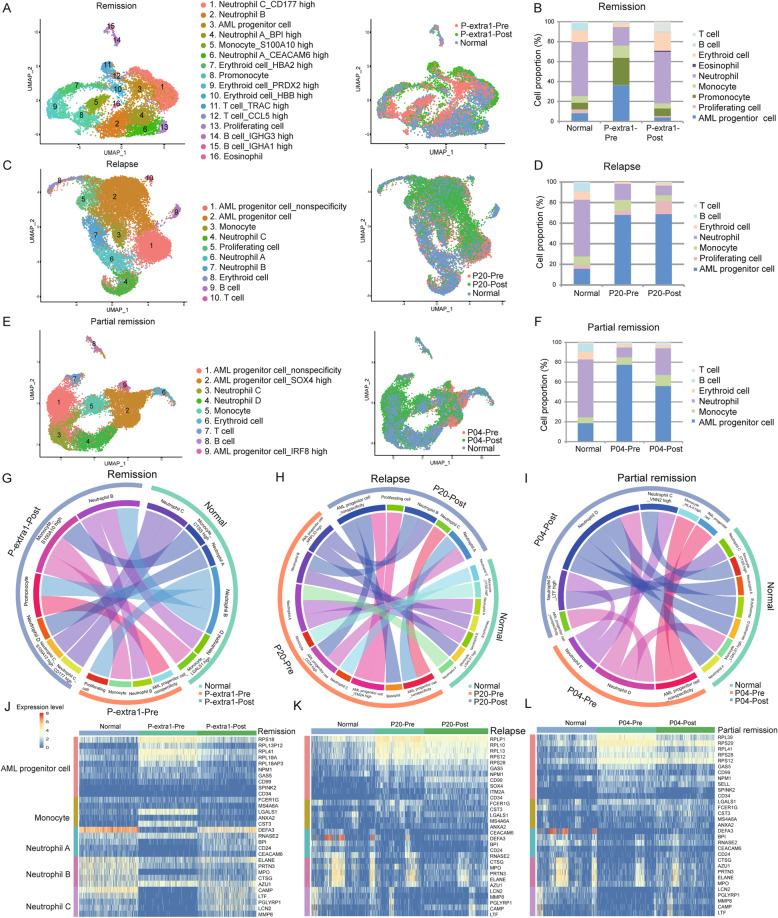
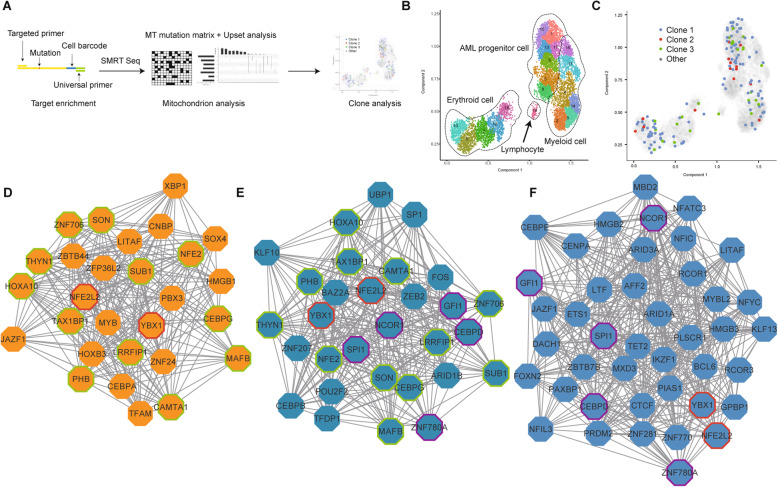
Methods: Using Microwell-seq, a high-throughput single-cell mRNA sequencing platform, we analyzed the cellular hierarchy of bone marrow samples from 40 patients and 3 healthy donors. We also used single-cell single-molecule real-time (SMRT) sequencing to investigate the clonal heterogeneity of AML cells.

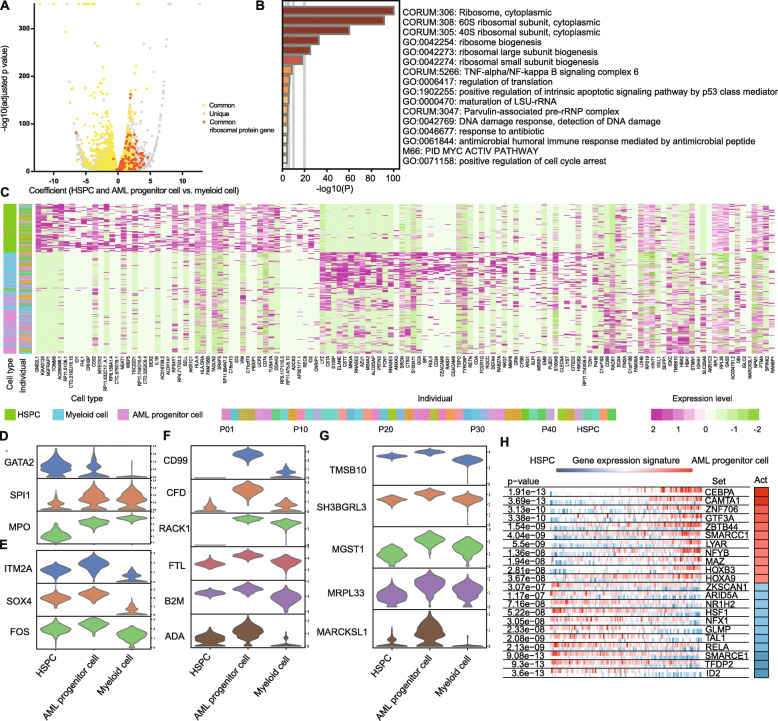
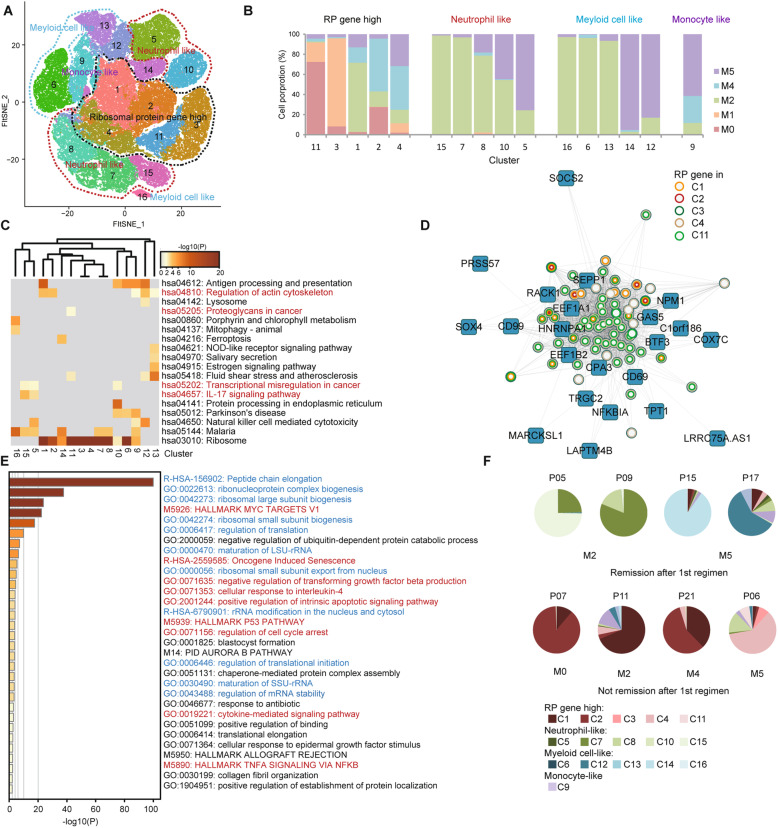
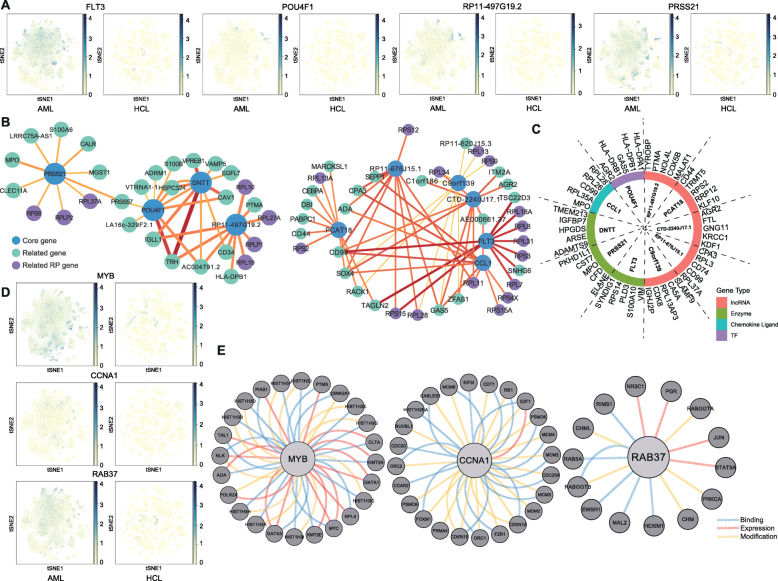
Results: From the integrative analysis of 191727 AML cells, we established a single-cell AML landscape and identified an AML progenitor cell cluster with novel AML markers. Patients with ribosomal protein high progenitor cells had a low remission rate. We deduced two types of AML with diverse clinical outcomes. We traced mitochondrial mutations in the AML landscape by combining Microwell-seq with SMRT sequencing. We propose the existence of a phenotypic "cancer attractor" that might help to define a common phenotype for AML progenitor cells. Finally, we explored the potential drug targets by making comparisons between the AML landscape and the Human Cell Landscape.

Conclusions: We identified a key AML progenitor cell cluster. A high ribosomal protein gene level indicates the poor prognosis. We deduced two types of AML and explored the potential drug targets. Our results suggest the existence of a cancer attractor.

Keywords: Acute myeloid leukemia; Cancer attractor; Microwell-seq; Ribosomal protein; Single-cell mRNA sequencing; Single-molecule real-time sequencing.


Conflict of interest statement

The authors declare no competing financial interest.

Figures

Fig. 1
Fig. 1
Analysis of normal BMMC hierarchy. a, b t-SNE analysis of normal BMMCs. Clusters and individuals are labeled in different colors and numbers. c Violin plots of differentially expressed genes. The horizontal axis shows the clusters. d, e PAGA analysis of normal BMMCs, PBMCs, and HSPCs. Clusters and samples are labeled in different colors and numbers. f Trajectory analysis of BMMCs, PBMCs, and HSPCs. g Heatmap of marker genes in neutrophil and monocyte pathways. Black and white represent high and low expression levels, respectively
Fig. 2
Fig. 2
Identifying the progenitor cell cluster of de novo AMLs. a, b t-SNE analysis of AML and normal BMMCs. Twenty clusters, 40 patients, and 3 normal donors are labeled in different colors and numbers. c t-SNE analysis of BMMCs. AML and normal cells are labeled in different colors. Different cell types are surrounded by dotted lines. d Connection network map of the clusters. Each cluster is represented by three octagons. Clusters correspond to those in a. e Correlation matrix of clusters in normal and AML cells. Red and blue represent high and low correlations, respectively. The X- and Y-axis represent the AML and normal cell. f Single-cell blast results of AML cells. Each row represents cells in AML. Each column represents one cell type in HCL reference. The length of cell type bar represents the cluster number. Red and gray represent high and low correlations, respectively
Fig. 3
Fig. 3
Characterizing the single-cell gene expression patterns of AML progenitor cell cluster. a Volcano plot of DEGs between progenitor cells (HSPCs and AML progenitor cells) and myeloid cells. Yellow represents the common genes shared by both HSPCs and AML progenitor cells. Gray represents the unique genes in HSPCs or AML progenitor cells. Orange represents the common ribosomal protein (RP) genes shared by both HSPCs and AML progenitor cells. The dots on the right represent the higher expressed genes in progenitor cells, and those on the left represent lower. b Metascape GO analysis for viewing top enrichment terms in AML progenitor cells. Color shows the p value. c Heat map of top DEGs among HSPCs, AML progenitor cells, and myeloid cells. Cell type and individual are indicated by the colored bars. Individual includes the AML patients and HSPC donors. dg Violin plots of DEGs among HSPCs, AML progenitor cells, and myeloid cells. The genes are related to hematopoietic development (d), primitive state (e), AML (f), and other solid tumors (g) in previous studies. h VIPER plot of activated (red) and repressed (blue) TFs in AML progenitor cells. The gene expression signature is rank-sorted from the one most downregulated to the one most upregulated in the AML progenitor cells vs. HSPCs. The column on the right shows the activity level
Fig. 4
Fig. 4
Intratumoral heterogeneity in AML progenitor cells predicts prognosis. a Subdivision t-SNE analysis of AML progenitor cells. Sixteen clusters are classified into four groups and are labeled in different colors and numbers. b Relative proportion analysis of four cell groups in a. Cells of different FAB subtypes are labeled in different colors. c Metascape KEGG pathway analysis for viewing enrichment terms in 16 clusters. Color shows the p value. d Visualization of the network with the genes of top weighted connectivity in the RP gene module. The circles represent the RP genes, while the colors show the genes in different clusters. e Metascape GO analysis for viewing top enrichment terms in the RP gene module. Color shows the p value. The terms in blue are associated with ribosome biogenesis, and in red are tumor-related. f Pie charts displaying cell distribution of AML progenitor cells of 16 clusters belonging to four cell groups. The patient ID is on the top of each chart. The subtype is on the bottom
Fig. 5
Fig. 5
Clinical implication of AML progenitor cells from diagnosis to relapse. a, c, e UMAP analysis of normal and AML individuals before and after treatment regimen. The AML individuals are in remission (P-extra 1, a), relapse (P20, c), and partial remission (P04, e). The normal sample is N02. Colors represent clusters in left panels, and individuals in the right panels. b, d, f Relative proportion analysis of clusters in normal and AML individuals. Cell types are labeled in different colors. gi Circos plots showing the correlation of clusters. The similar clusters are connected by lines. jl Heatmap of differentially expressed marker genes. Each row represents marker genes of each cell type. Each column represents cells in different status. Red and yellow represents high expression level while blue represents low levels
Fig. 6
Fig. 6
The association of genetic mutation with cellular hierarchy by SMRT sequencing at the single-cell level. a Procedures for acquiring mutation information from single cell, and the following analyses. b Trajectory analysis of P25 using UMAP/Monocle 3. Clusters are labeled in different colors and numbers. c Clone projection of P25 using UMAP/Monocle 3. Clones are labeled in different colors. d-f Visualization of attractor networks with the core genes of the AML progenitor cells (d), AML myeloid cells (e), and normal myeloid cells (f) in comparison to HSPCs
Fig. 7
Fig. 7
AML target searching based on the HCL. a Feature plots of genes in AML map and HCL. The left panel is the AML map and the right is HCL. Gene expression levels are indicated by blue and yellow. b Correlation networks of the top 10 highly expressed genes and their most relevant genes in AML. The top expressed genes are the core genes in blue. The most relevant genes are in green and purple (RPs). c The top expressed AML genes and their most relevant protein-coding genes in AML progenitor cluster. d Feature plots of MYB, CCNA1, and RAB37 in the AML map and the HCL. The left panel is AML map and the right is HCL. Gene expression levels are indicated by blue and yellow. e The interacting gene analysis using pathway commons. The blue, red, and yellow lines represent the binding, expression-controlled, and state change-controlled (modification) genes, respectively

References

    1. Dohner H, Estey E, Grimwade D, Amadori S, Appelbaum FR, Buchner T, et al. Diagnosis and management of AML in adults: 2017 ELN recommendations from an international expert panel. Blood. 2017;139:424–427. doi: 10.1182/blood-2016-08-733196. - DOI - PMC - PubMed
    1. Bullinger L, Dohner K, Dohner H. Genomics of acute myeloid leukemia diagnosis and pathways. J Clin Oncol. 2017;35(9):934–946. doi: 10.1200/JCO.2016.71.2208. - DOI - PubMed
    1. Luppi M, Fabbiano F, Visani G, Martinelli G, Venditti A. Novel agents for acute myeloid leukemia. Cancers (Basel) 2018;10:11. doi: 10.3390/cancers10110429. - DOI - PMC - PubMed
    1. Timilshina N, Breunis H, Tomlinson GA, Brandwein JM, Buckstein R, Durbano S, et al. Long-term recovery of quality of life and physical function over three years in adult survivors of acute myeloid leukemia after intensive chemotherapy. Leukemia. 2019;33(1):15–25. doi: 10.1038/s41375-018-0162-5. - DOI - PubMed
    1. Grimwade D, Ivey A, Huntly BJP. Molecular landscape of acute myeloid leukemia in younger adults and its clinical relevance. Blood. 2016;127:29–41. doi: 10.1182/blood-2015-07-604496. - DOI - PMC - PubMed

Publication types

MeSH terms