

Spatiotemporal Distribution of the Environmental Microbiota in Food Processing Plants as Impacted by Cleaning and Sanitizing Procedures: the Case of Slaughterhouses and Gaseous Ozone
- PMID: 32978124
- PMCID: PMC7657643
- DOI: 10.1128/AEM.01861-20
Spatiotemporal Distribution of the Environmental Microbiota in Food Processing Plants as Impacted by Cleaning and Sanitizing Procedures: the Case of Slaughterhouses and Gaseous Ozone
Abstract
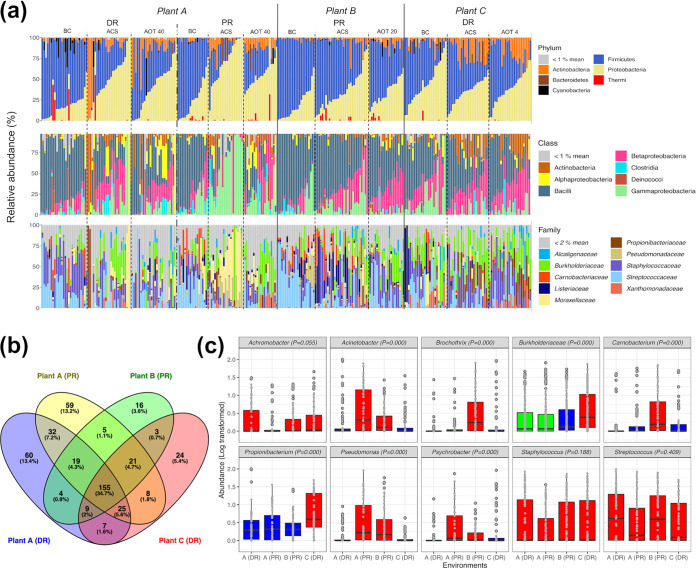
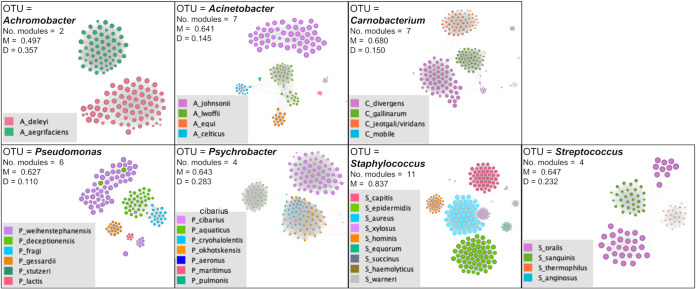
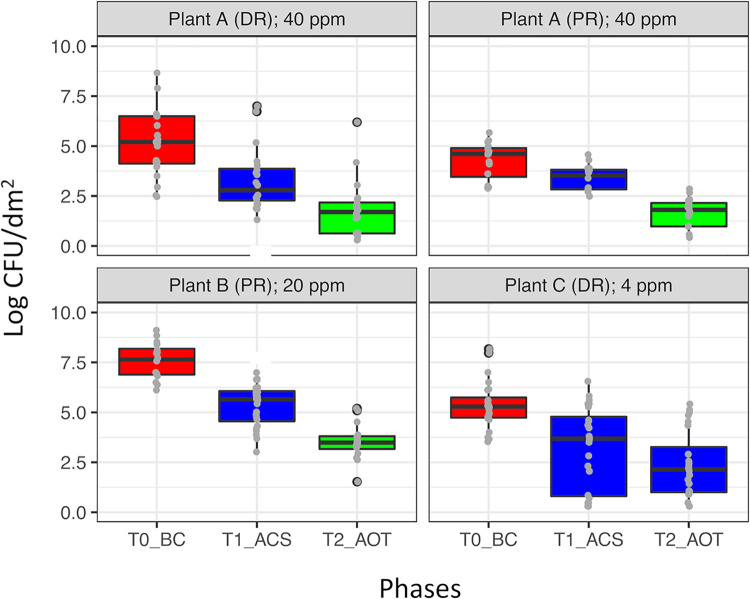
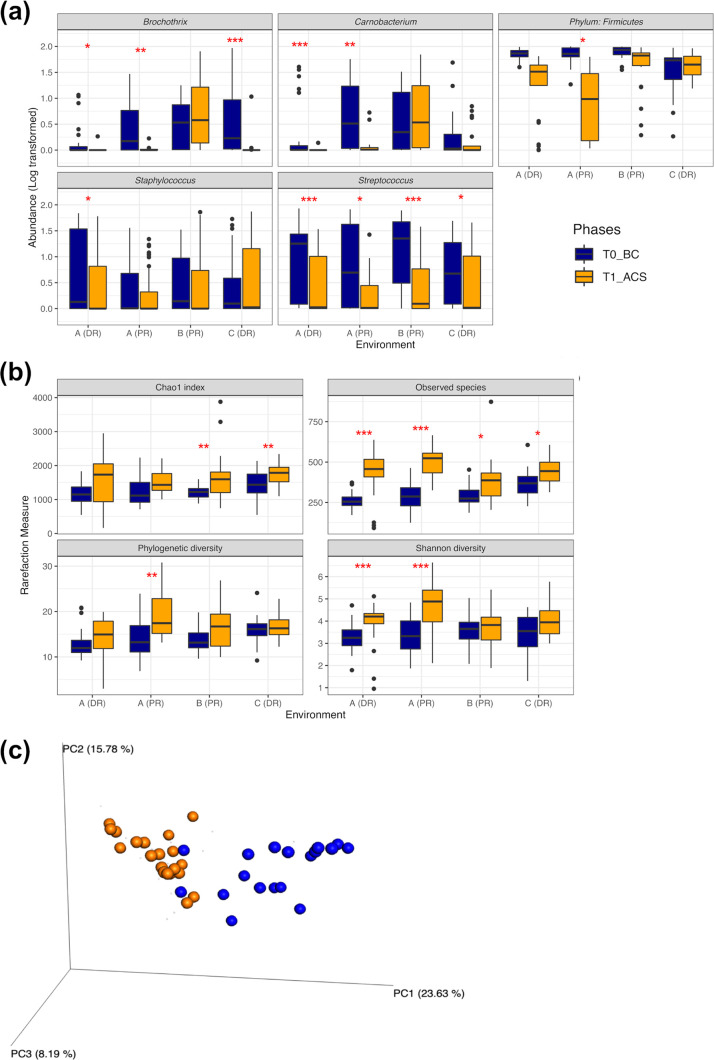
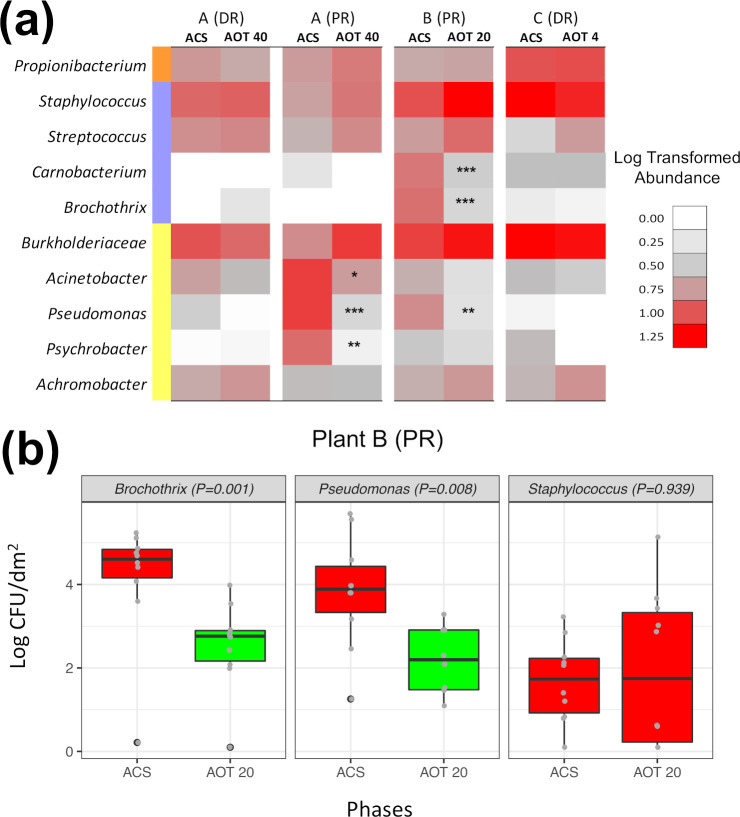
Microbial complexity and contamination levels in food processing plants heavily impact the final product fate and are mainly controlled by proper environmental cleaning and sanitizing. Among the emerging disinfection technologies, ozonation is considered an effective strategy to improve the ordinary cleaning and sanitizing of slaughterhouses. However, its effects on contamination levels and environmental microbiota still need to be understood. For this purpose, we monitored the changes in microbiota composition in different slaughterhouse environments during the phases of cleaning/sanitizing and ozonation at 40, 20, or 4 ppm. Overall, the meat processing plant microbiota differed significantly between secondary processing rooms and deboning rooms, with a greater presence of psychrotrophic taxa in secondary processing rooms because of their lower temperatures. Cleaning/sanitizing procedures significantly reduced the contamination levels and in parallel increased the number of detectable operational taxonomic units (OTUs), by removing the masking effect of the most abundant human/animal-derived OTUs, which belonged to the phylum Firmicutes Subsequently, ozonation at 40 or 20 ppm effectively decreased the remaining viable bacterial populations. However, we could observe selective ozone-mediated inactivation of psychrotrophic bacteria only in the secondary processing rooms. There, the Brochothrix and Pseudomonas abundances and their viable counts were significantly affected by 40 or 20 ppm of ozone, while more ubiquitous genera like Staphylococcus showed a remarkable resistance to the same treatments. This study showed the effectiveness of highly concentrated gaseous ozone as an adjunct sanitizing method that can minimize cross-contamination and so extend the meat shelf life.IMPORTANCE Our in situ survey demonstrates that RNA-based sequencing of 16S rRNA amplicons is a reliable approach to qualitatively probe, at high taxonomic resolution, the changes triggered by new and existing cleaning/sanitizing strategies in the environmental microbiota in human-built environments. This approach could soon represent a fast tool to clearly define which routine sanitizing interventions are more suitable for a specific food processing environment, thus limiting the costs of special cleaning interventions and potential product loss.
Keywords: RNA-based surveillance; environmental microbiota; gaseous ozone; meat processing plants; spoilage bacteria.
Copyright © 2020 American Society for Microbiology.
Figures
Similar articles
-
Overlap of Spoilage-Associated Microbiota between Meat and the Meat Processing Environment in Small-Scale and Large-Scale Retail Distributions.Appl Environ Microbiol. 2016 Jun 13;82(13):4045-54. doi: 10.1128/AEM.00793-16. Print 2016 Jul 1. Appl Environ Microbiol. 2016. PMID: 27129965 Free PMC article.
-
Control of meat spoilage with ozone nano-bubbles: Insights from laboratory model systems and commercial scale treatments.Int J Food Microbiol. 2025 Apr 2;433:111128. doi: 10.1016/j.ijfoodmicro.2025.111128. Epub 2025 Feb 21. Int J Food Microbiol. 2025. PMID: 39987649
-
Comparison of ozone and chlorine in low concentrations as sanitizing agents of chicken carcasses in the water immersion chiller.J Food Prot. 2012 Jun;75(6):1139-43. doi: 10.4315/0362-028X.JFP-11-288. J Food Prot. 2012. PMID: 22691485
-
Ozone and its current and future application in the food industry.Adv Food Nutr Res. 2003;45:167-218. doi: 10.1016/s1043-4526(03)45005-5. Adv Food Nutr Res. 2003. PMID: 12402681 Review.
-
Visible contamination on animals and carcasses and the microbiological condition of meat.J Food Prot. 2004 Feb;67(2):413-9. doi: 10.4315/0362-028x-67.2.413. J Food Prot. 2004. PMID: 14968981 Review.
Cited by
-
Impact of Electrolyzed Water on the Microbial Spoilage Profile of Piedmontese Steak Tartare.Microbiol Spectr. 2021 Dec 22;9(3):e0175121. doi: 10.1128/Spectrum.01751-21. Epub 2021 Nov 17. Microbiol Spectr. 2021. PMID: 34787437 Free PMC article.
-
Pseudomonas in Meat Processing Environments.Foods. 2025 May 2;14(9):1615. doi: 10.3390/foods14091615. Foods. 2025. PMID: 40361697 Free PMC article. Review.
-
Data-Mining Poultry Processing Bio-Mapping Counts of Pathogens and Indicator Organisms for Food Safety Management Decision Making.Foods. 2023 Feb 20;12(4):898. doi: 10.3390/foods12040898. Foods. 2023. PMID: 36832973 Free PMC article.
-
Ozonation for Pseudomonas paracarnis control: biofilm removal and preservation of chicken meat during refrigerated storage.Braz J Microbiol. 2023 Dec;54(4):3051-3060. doi: 10.1007/s42770-023-01157-1. Epub 2023 Nov 1. Braz J Microbiol. 2023. PMID: 37910305 Free PMC article.
-
Effect of gaseous ozone treatment on biofilm of dairy-isolated Pseudomonas spp. strains.Ital J Food Saf. 2022 Jun 29;11(2):10350. doi: 10.4081/ijfs.2022.10350. eCollection 2022 Jun 21. Ital J Food Saf. 2022. PMID: 35832038 Free PMC article.
References
-
- Williams GD, Keener KM. 2013. Design considerations for the construction and operation of meat and poultry processing facilities. ASABE Meet, paper 082382. doi:10.13031/2013.24882. - DOI
Publication types
MeSH terms
Substances
LinkOut - more resources
Full Text Sources
Medical
