

Electrophysiological Frequency Band Ratio Measures Conflate Periodic and Aperiodic Neural Activity
- PMID: 32978216
- PMCID: PMC7768281
- DOI: 10.1523/ENEURO.0192-20.2020
Electrophysiological Frequency Band Ratio Measures Conflate Periodic and Aperiodic Neural Activity
Abstract
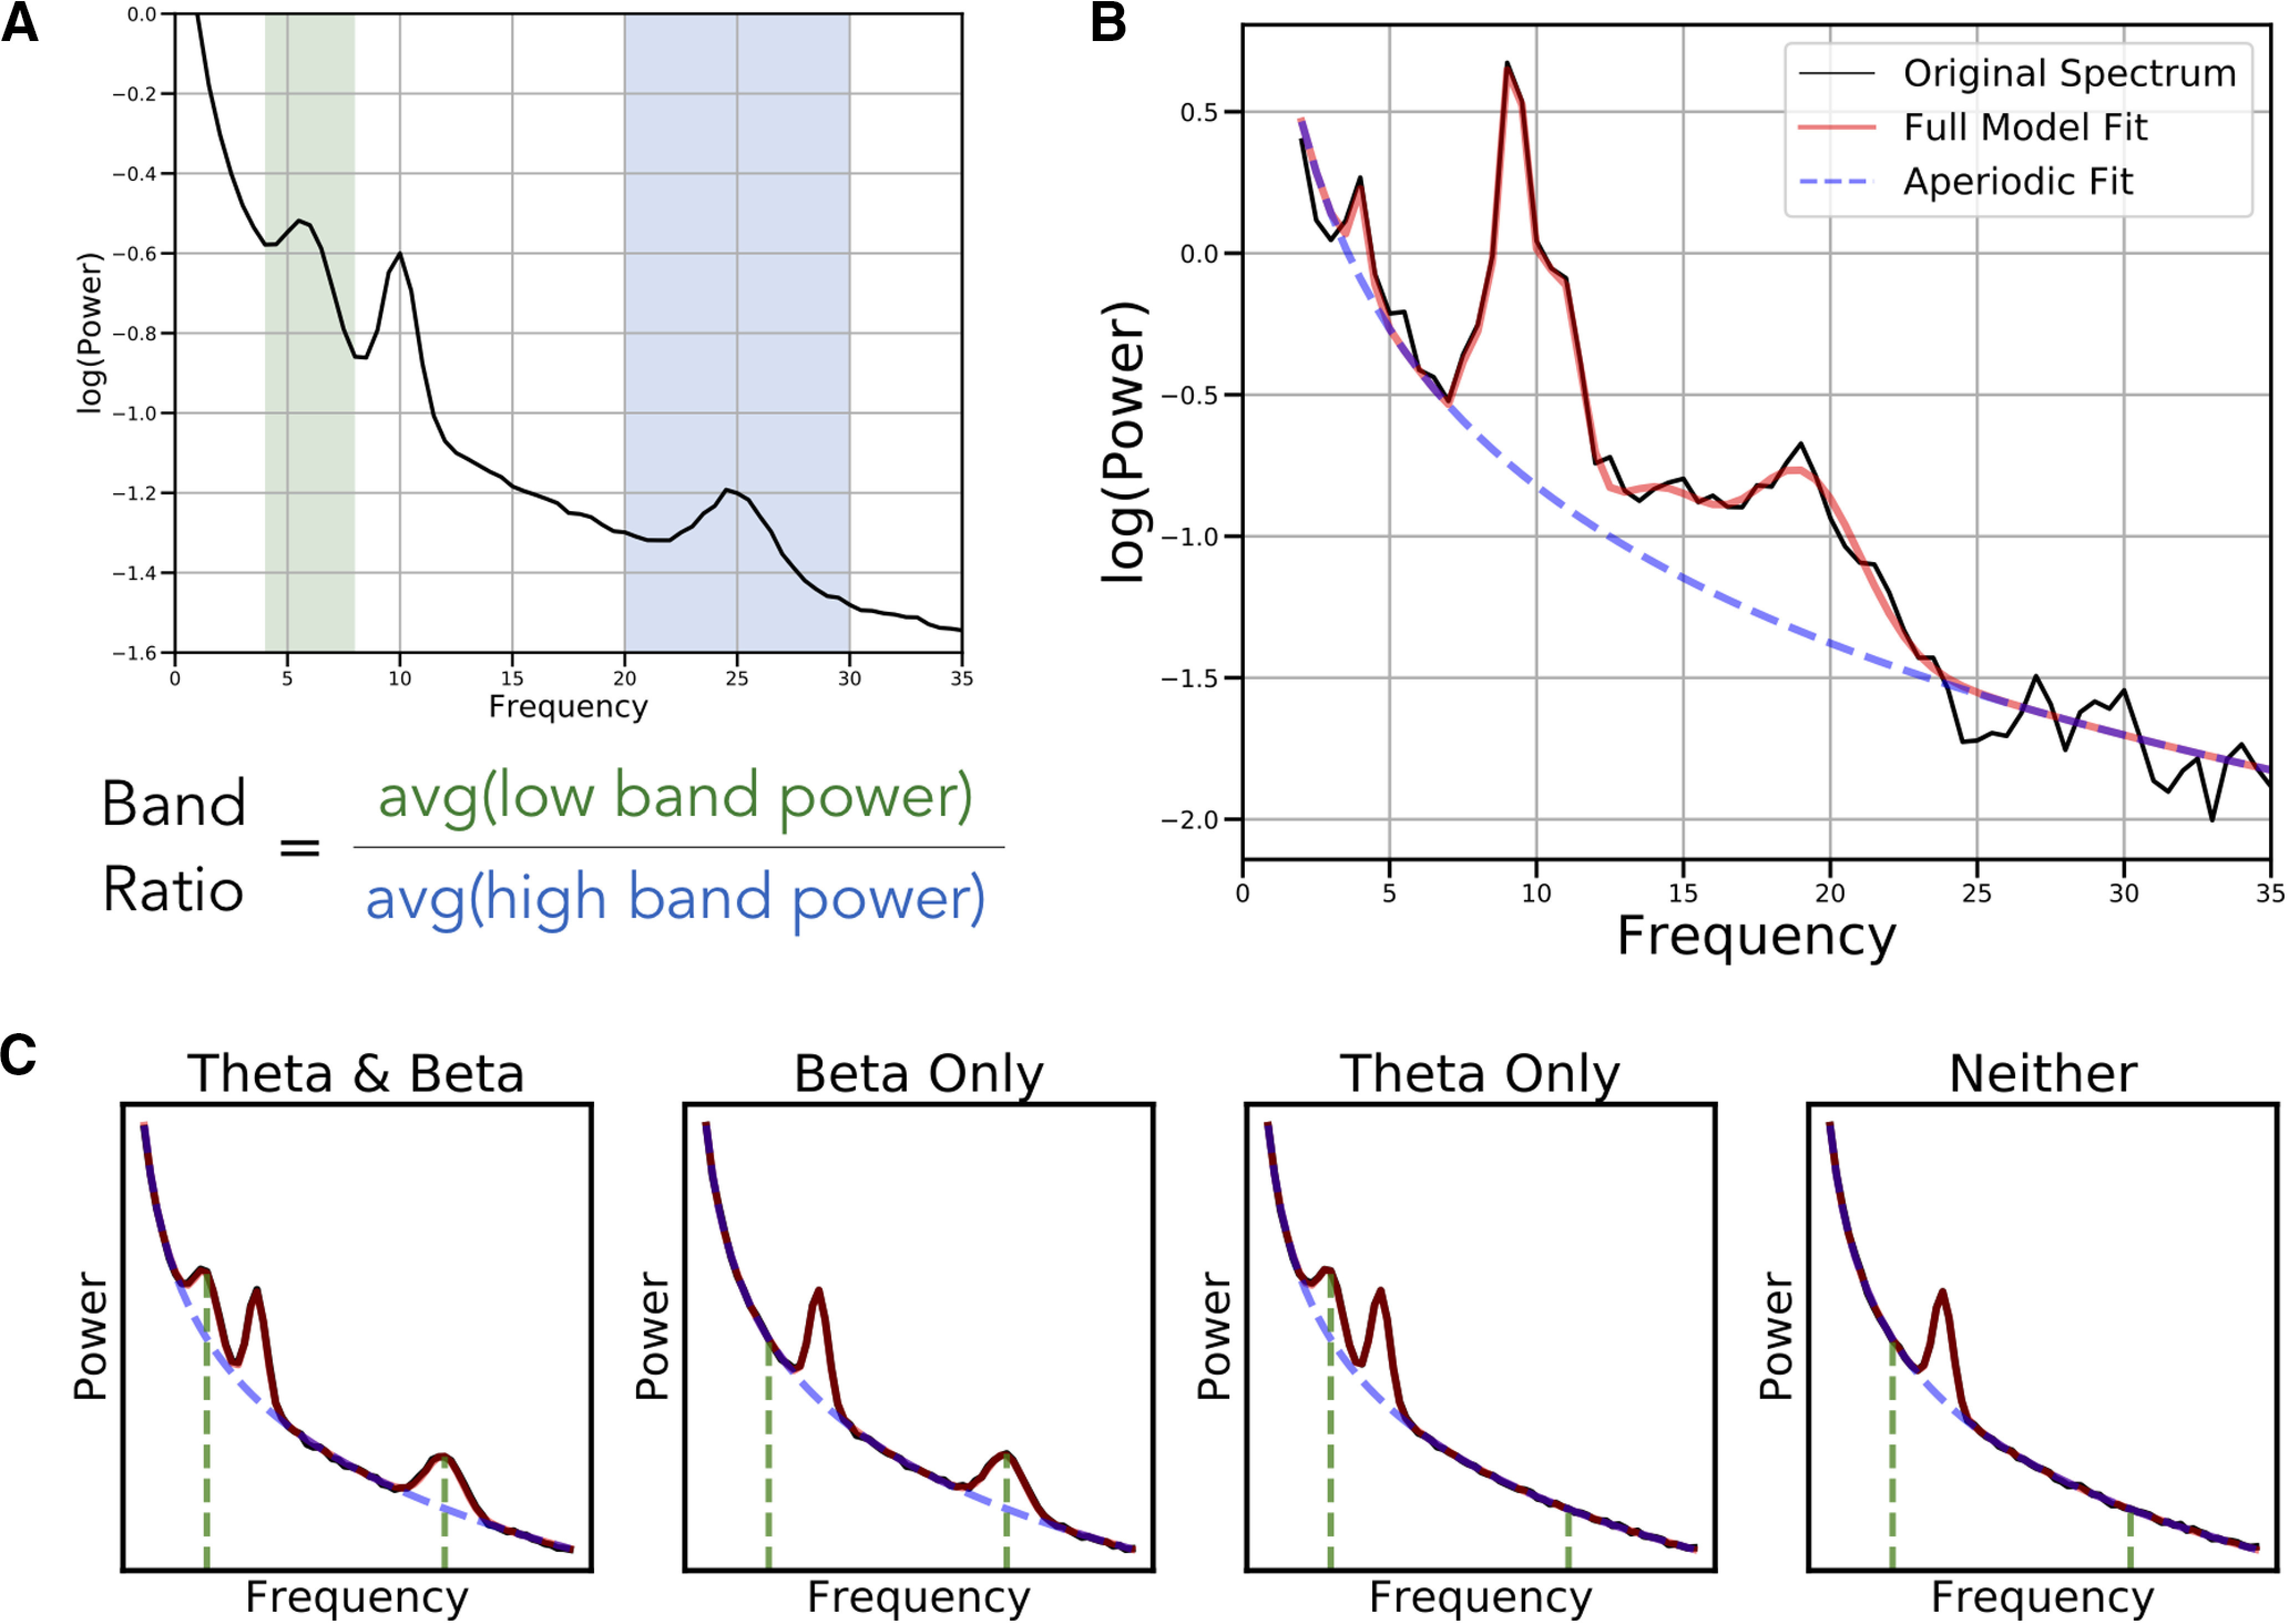
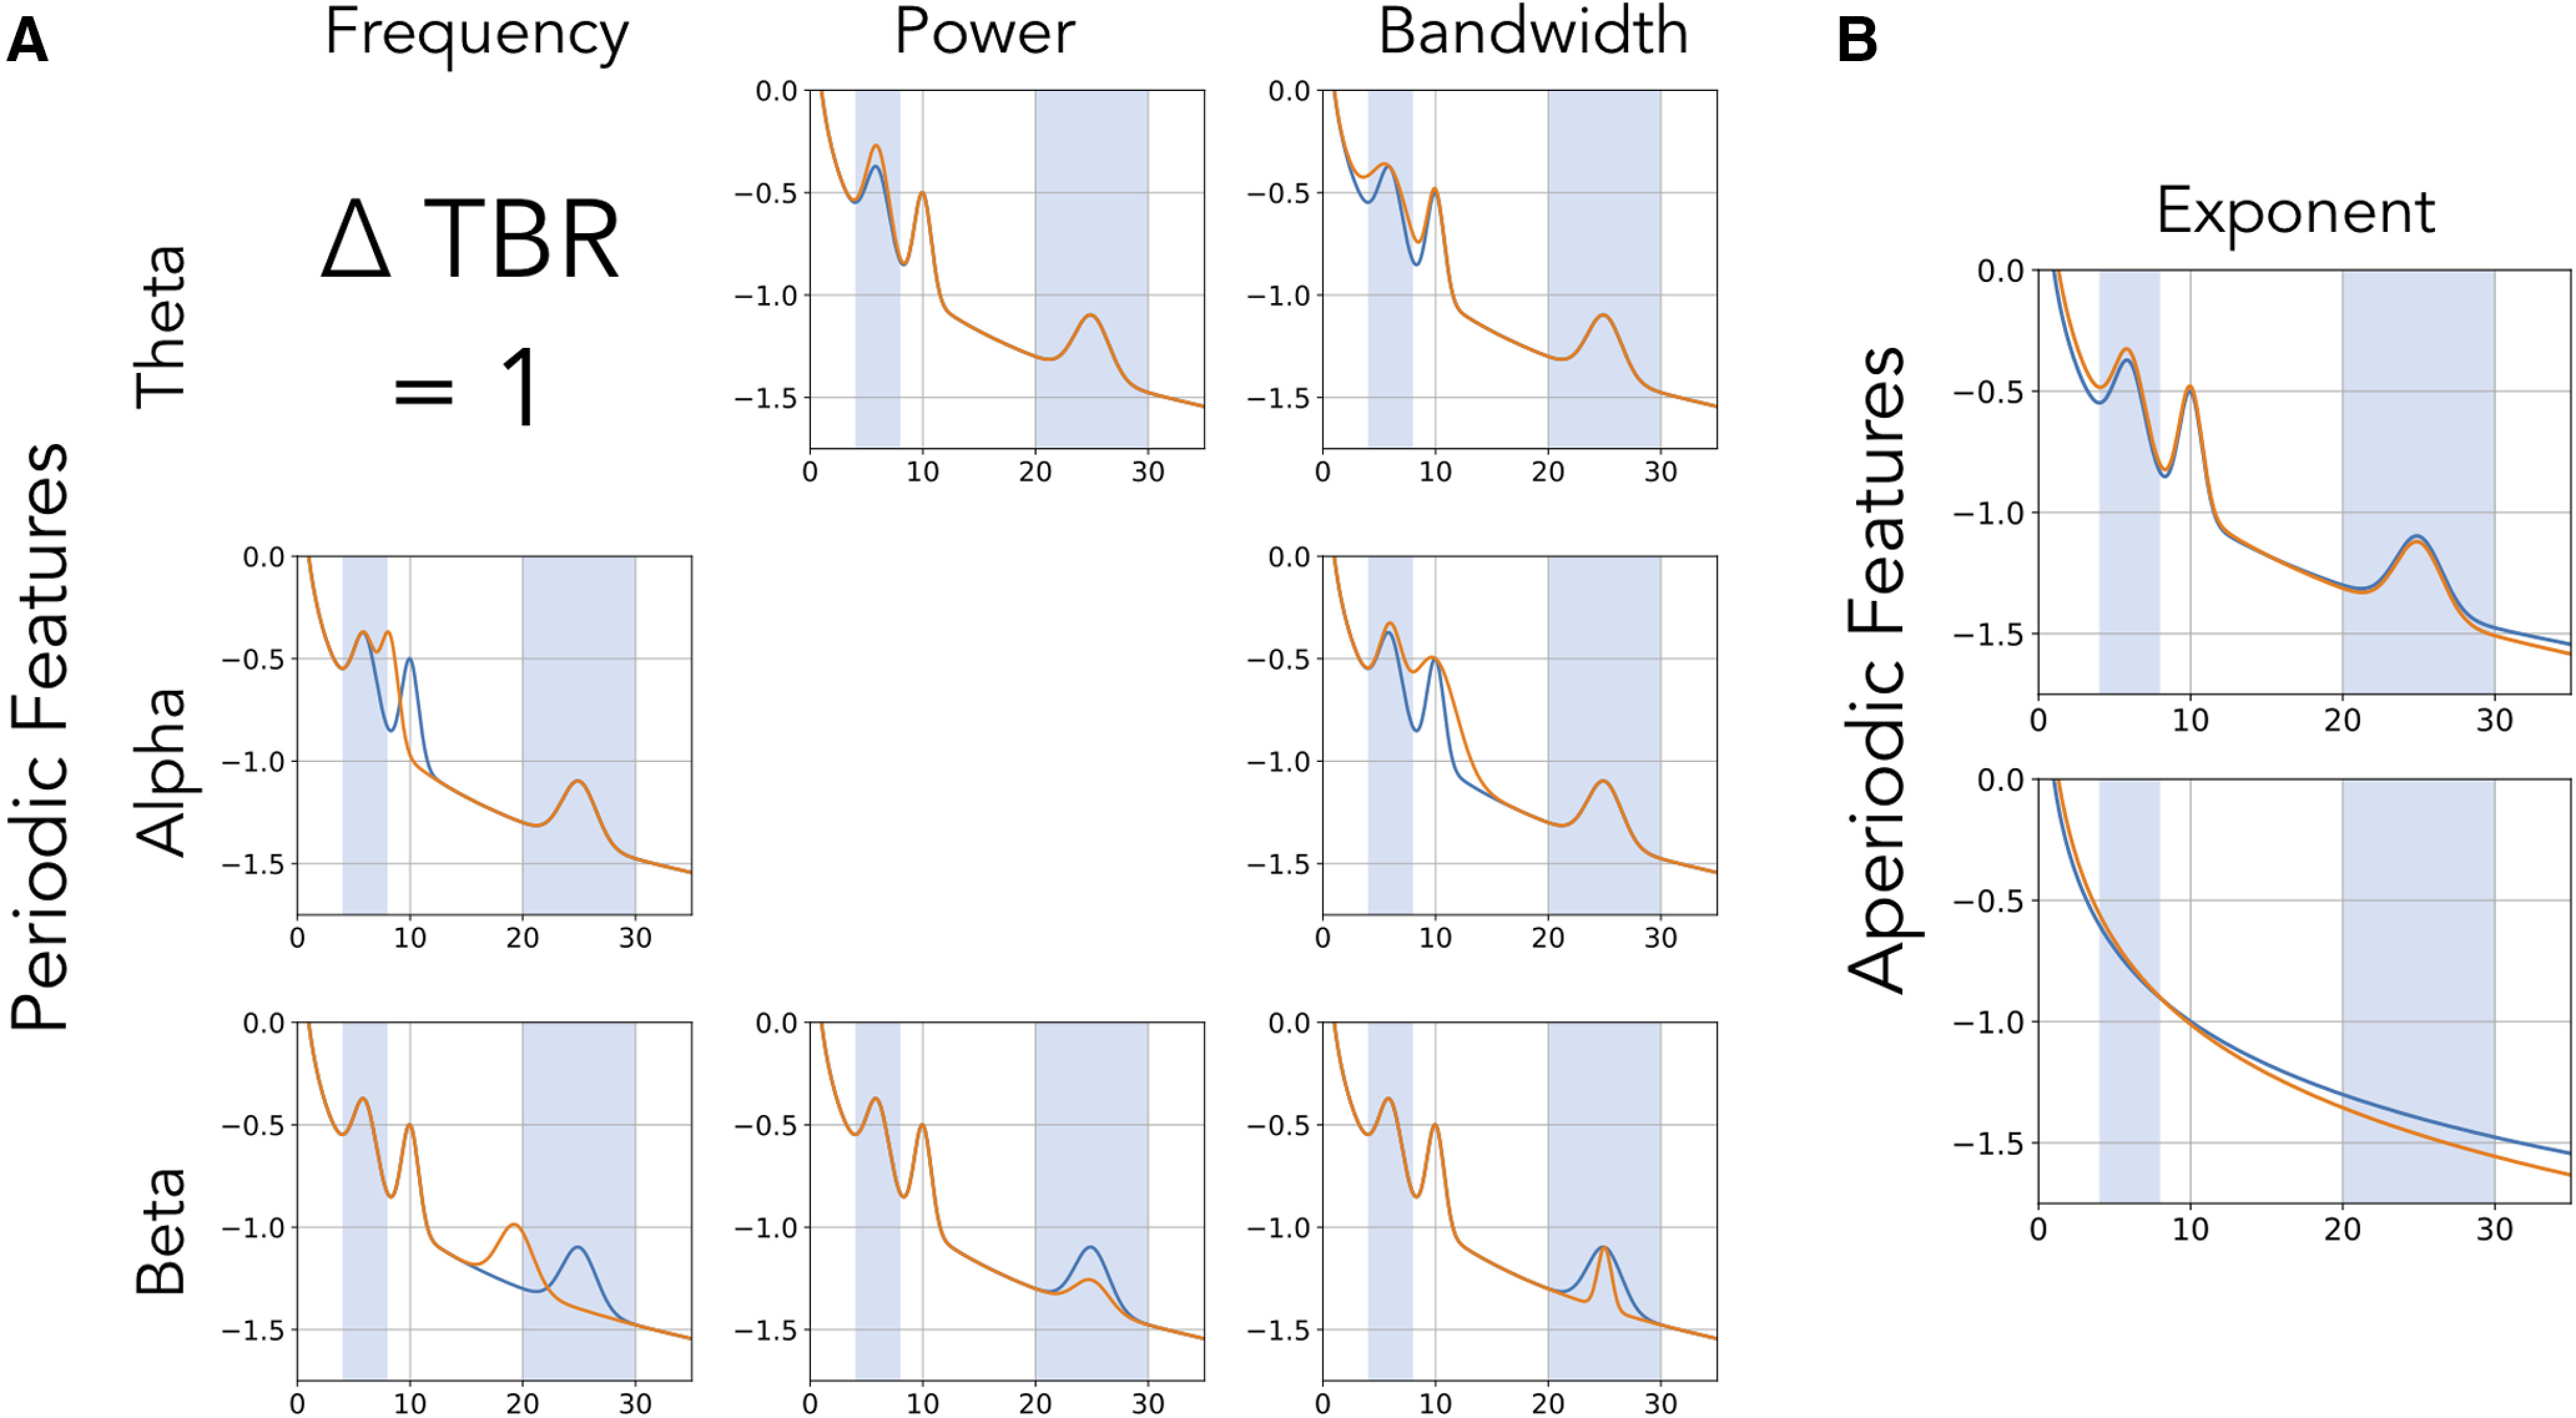
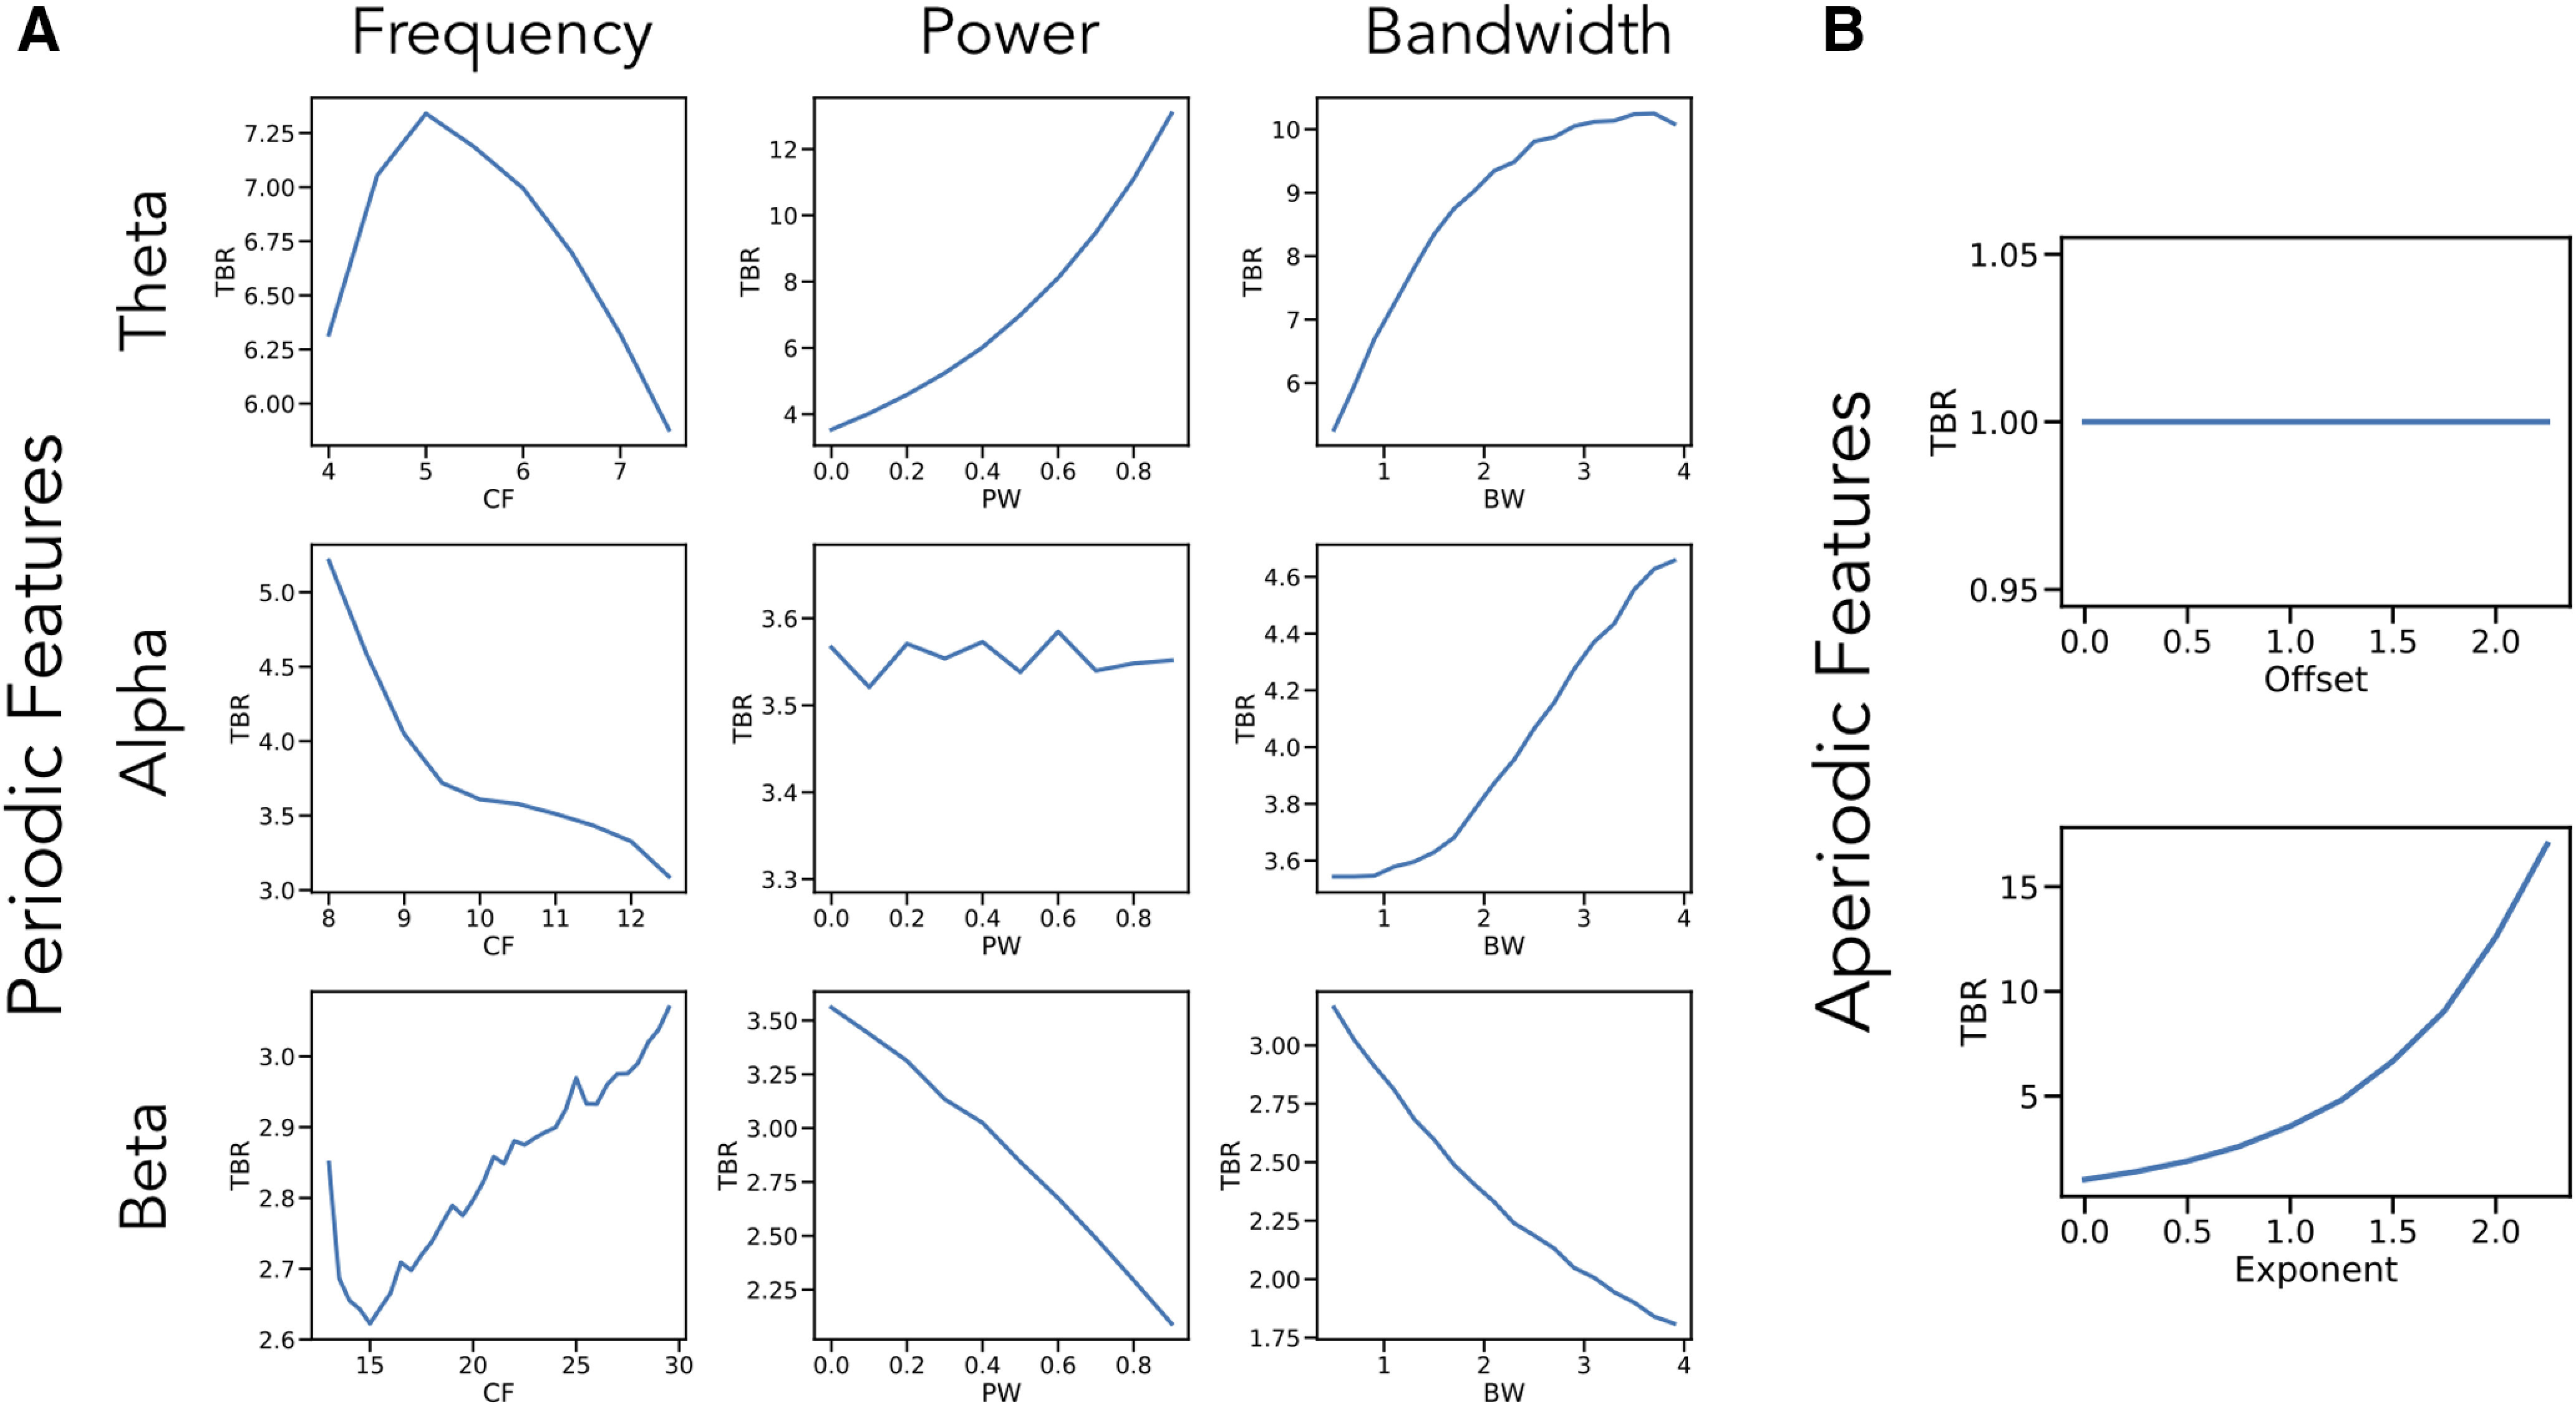
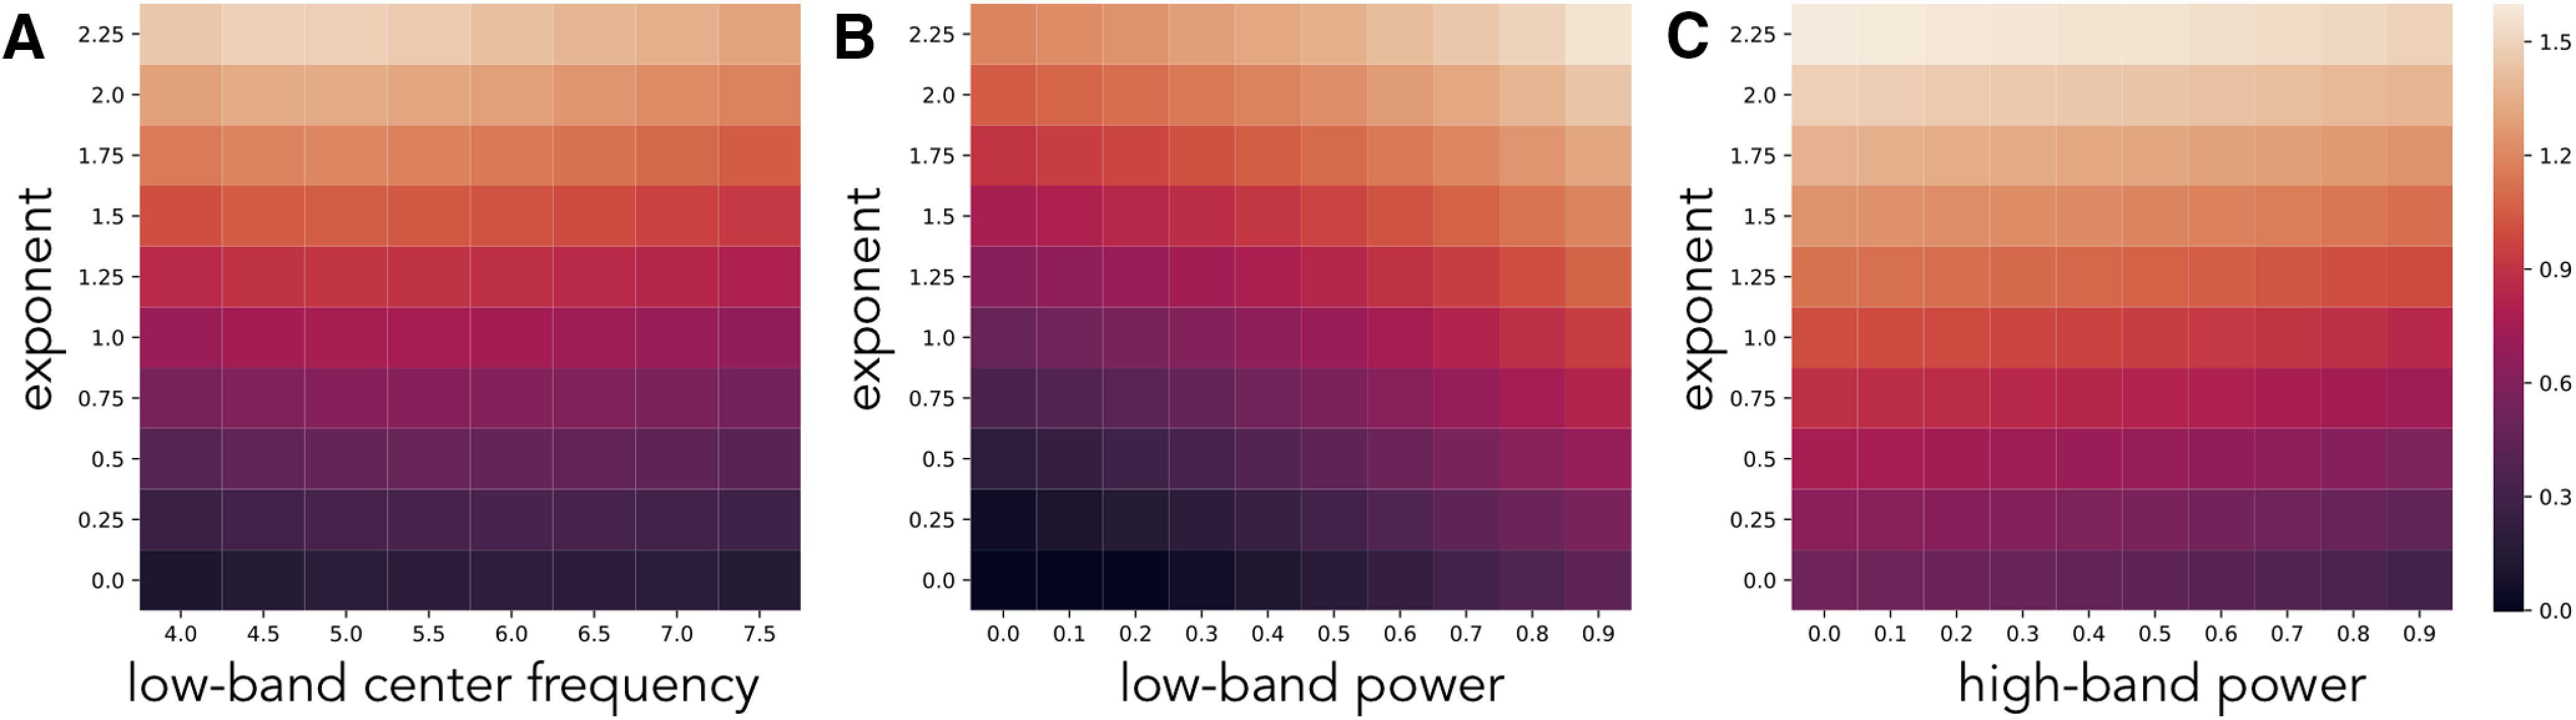
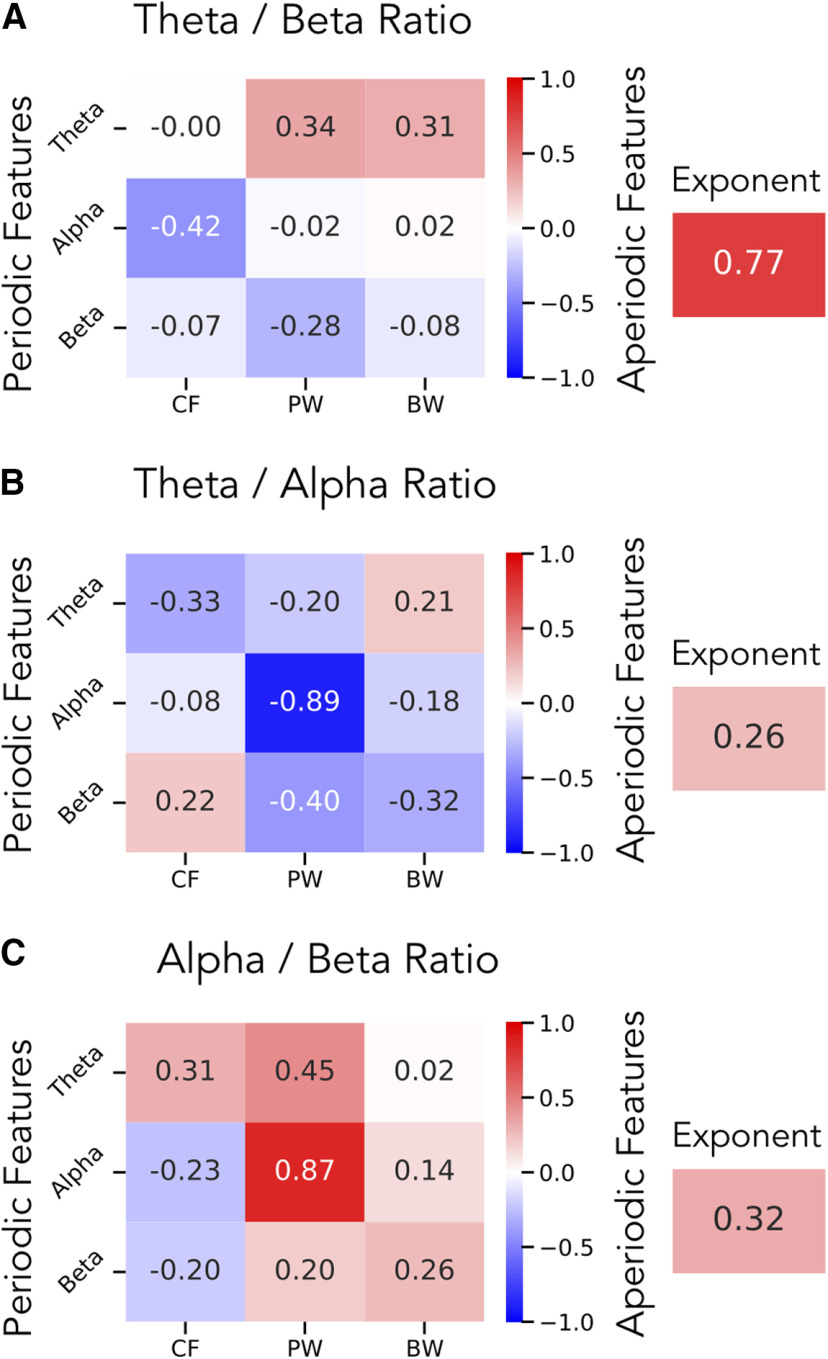
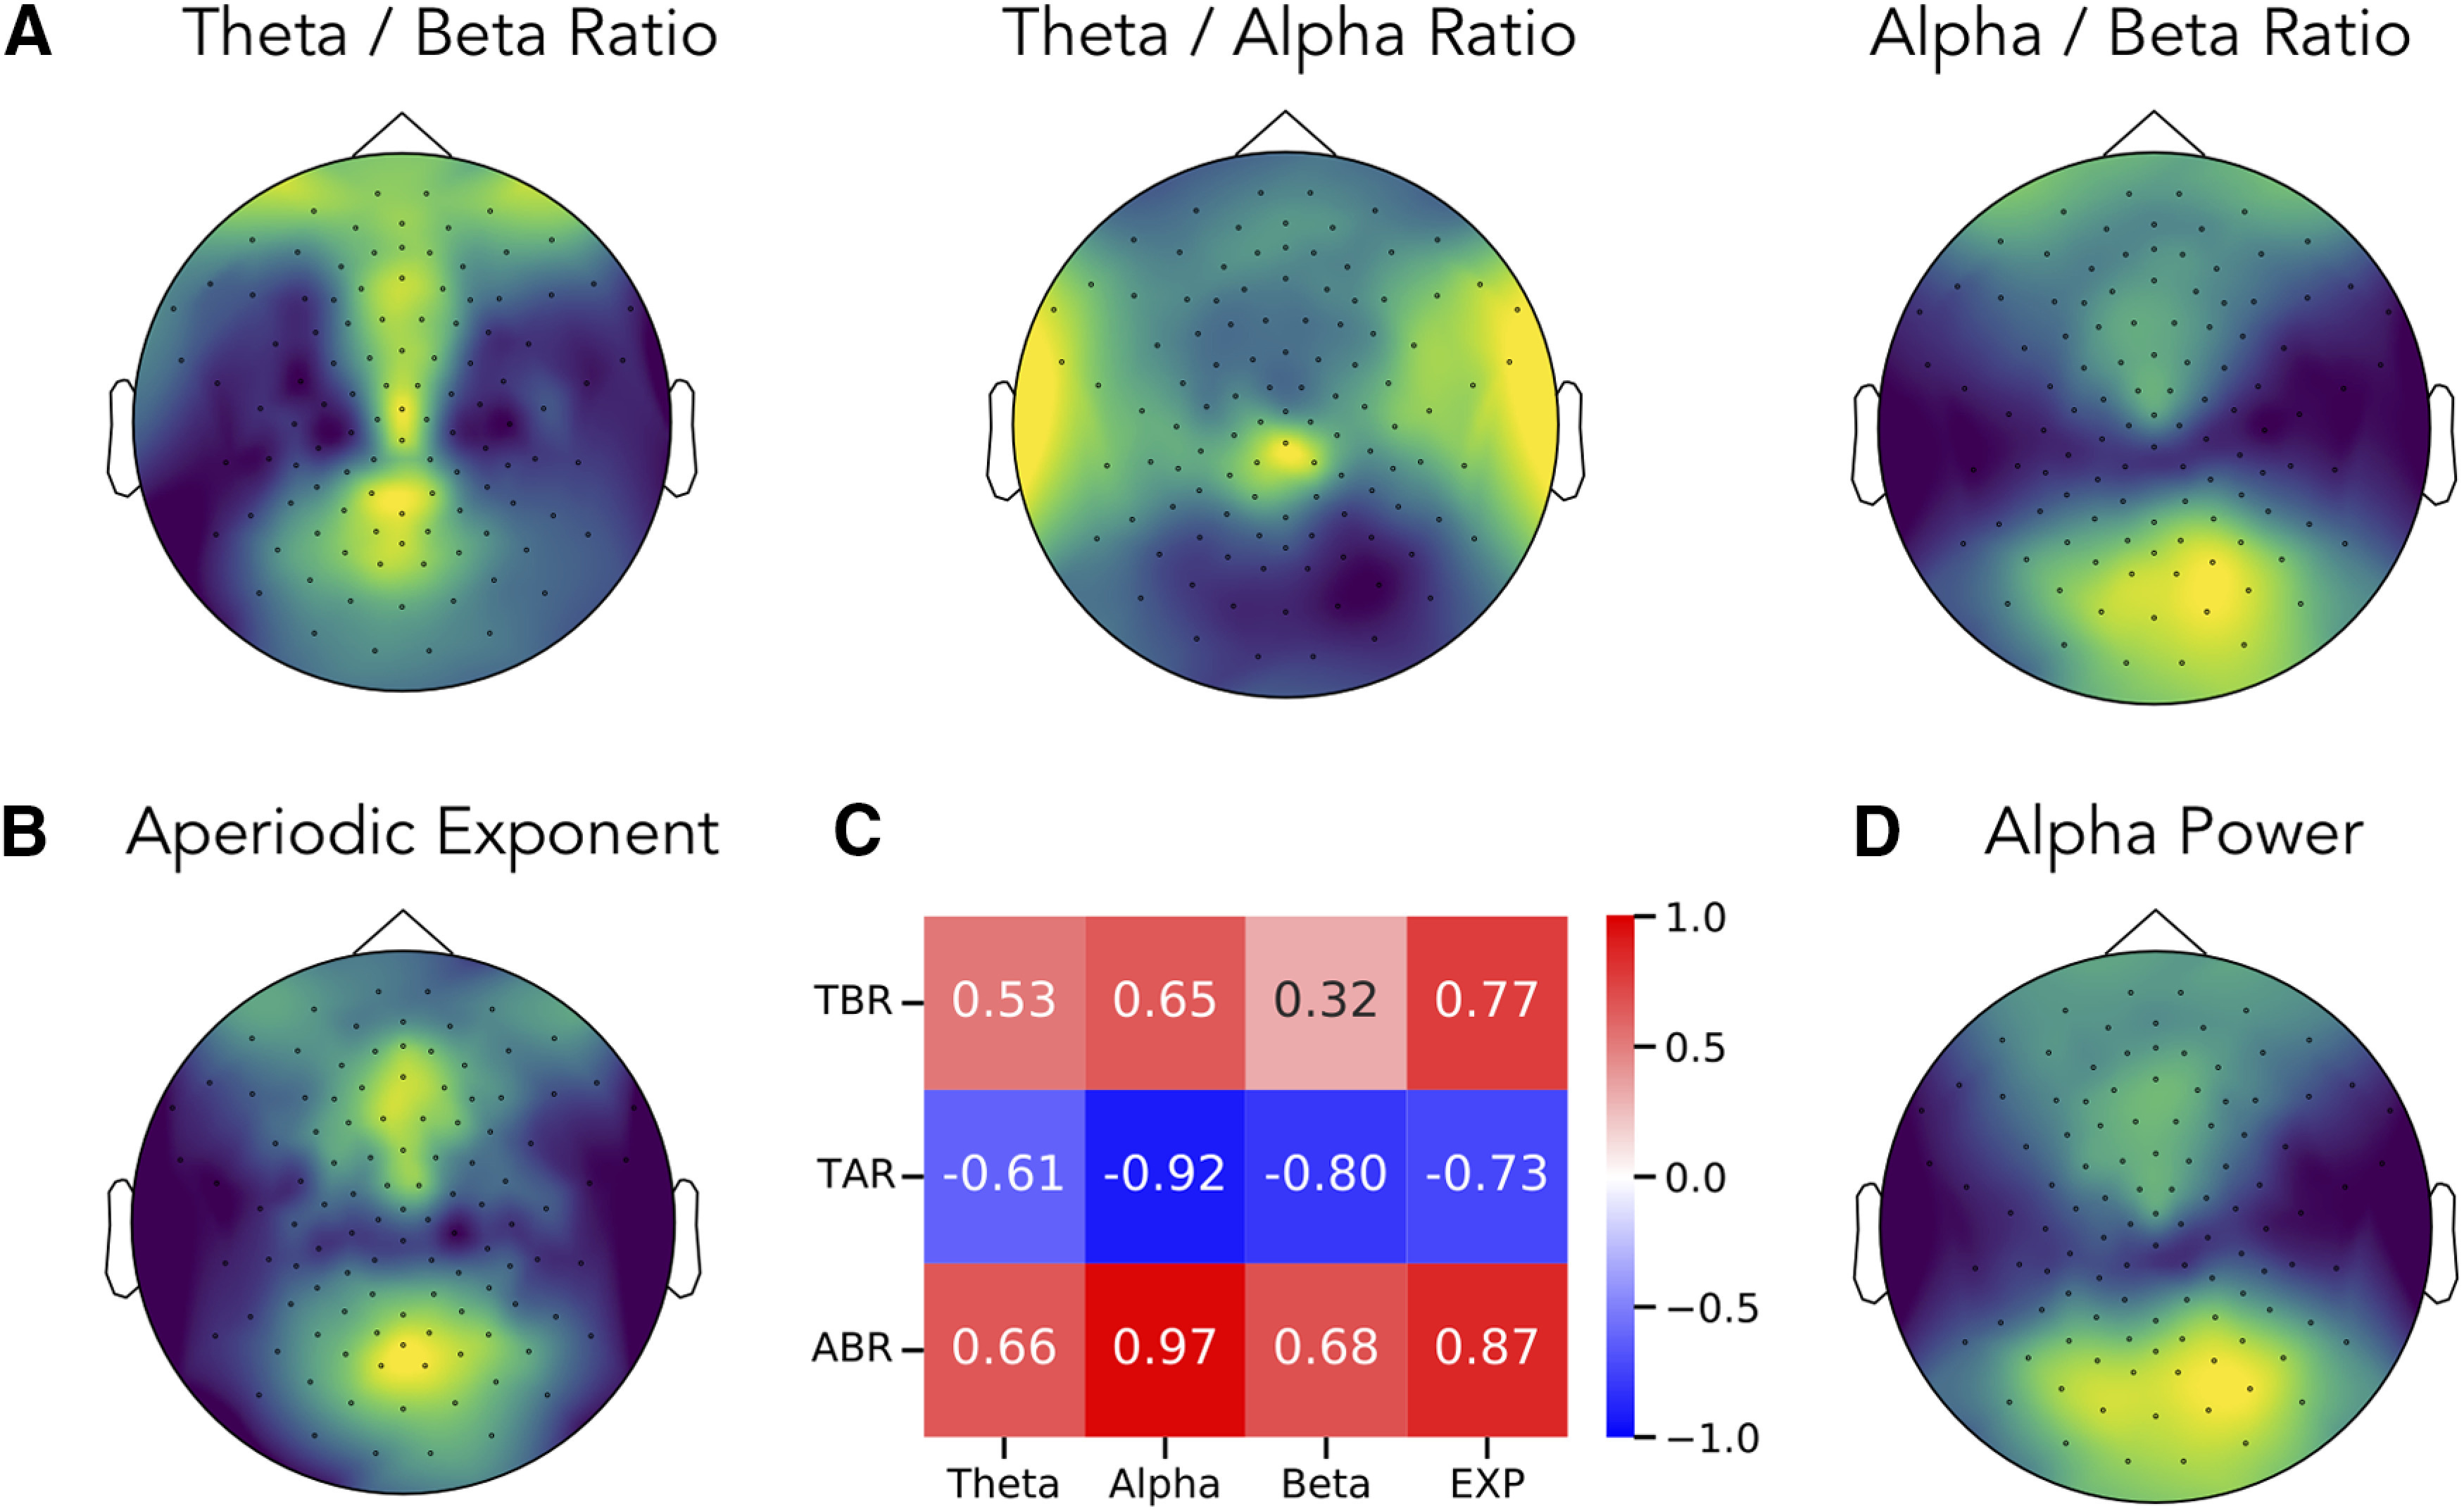
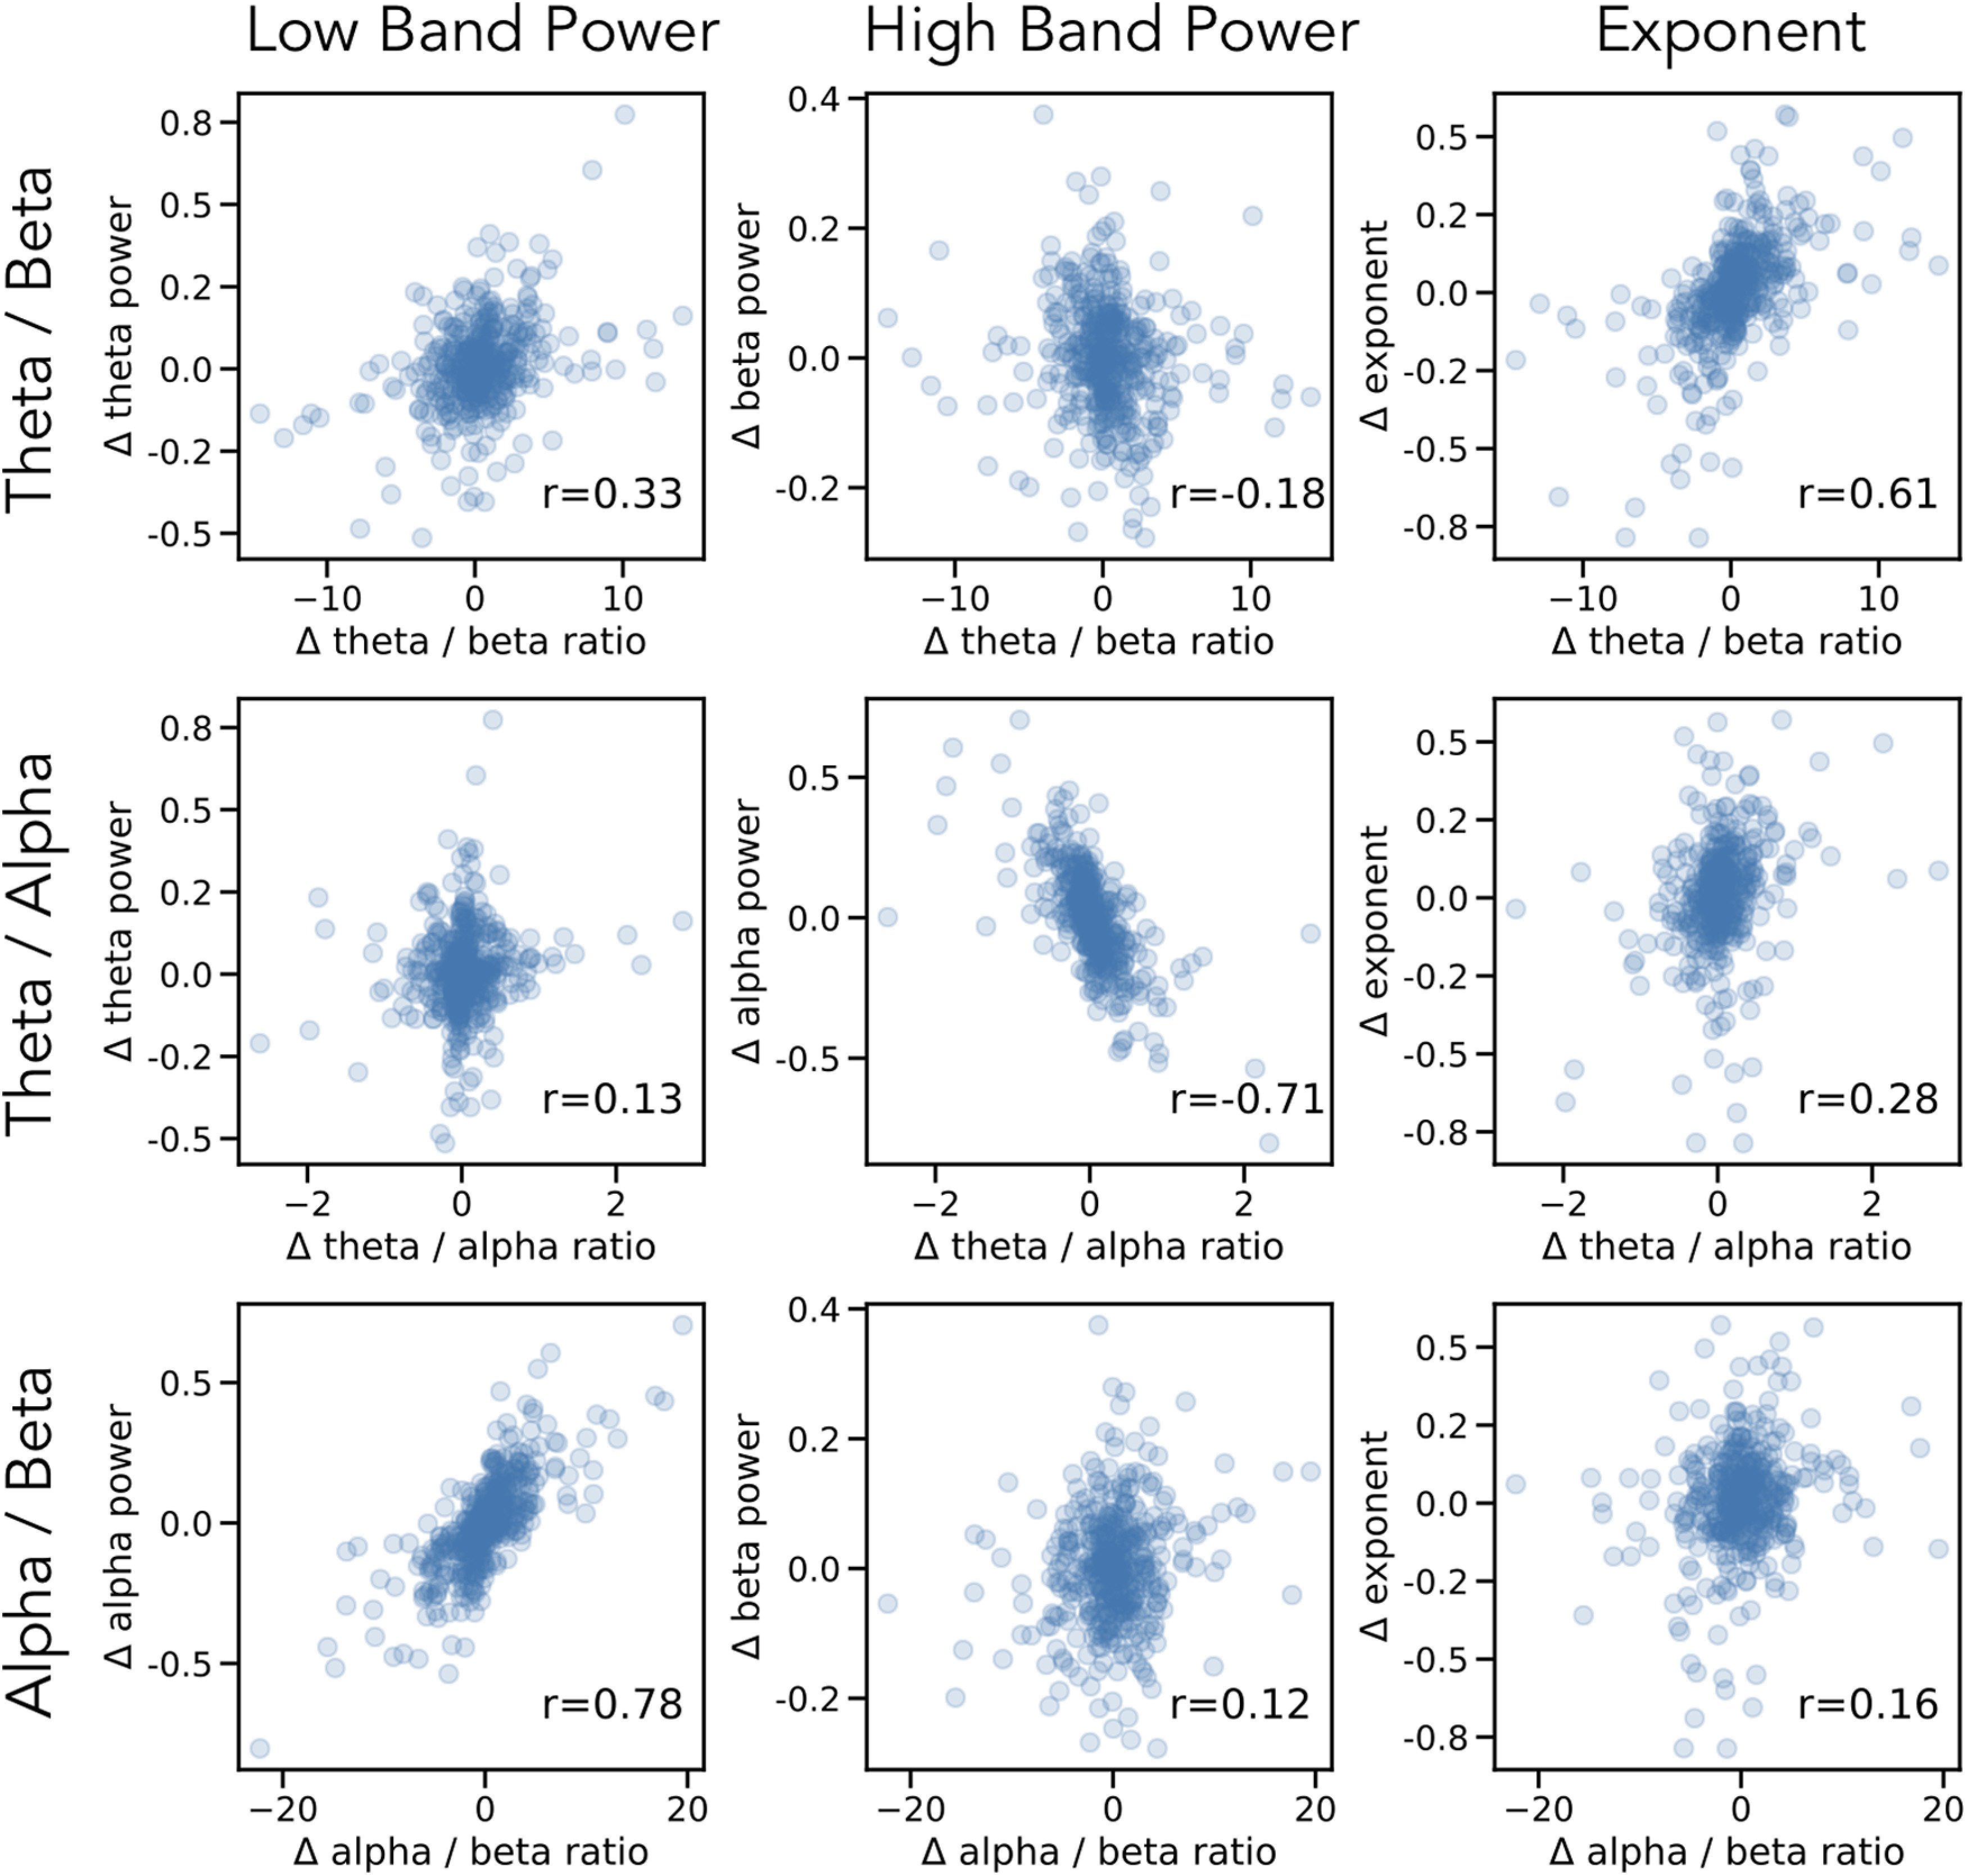
Band ratio measures, computed as the ratio of power between two frequency bands, are a common analysis measure in neuroelectrophysiological recordings. Band ratio measures are typically interpreted as reflecting quantitative measures of periodic, or oscillatory, activity. This assumes that the measure reflects relative powers of distinct periodic components that are well captured by predefined frequency ranges. However, electrophysiological signals contain periodic components and a 1/f-like aperiodic component, the latter of which contributes power across all frequencies. Here, we investigate whether band ratio measures truly reflect oscillatory power differences, and/or to what extent ratios may instead reflect other periodic changes, such as in center frequency or bandwidth, and/or aperiodic activity. In simulation, we investigate how band ratio measures relate to changes in multiple spectral features, and show how multiple periodic and aperiodic features influence band ratio measures. We validate these findings in human electroencephalography (EEG) data, comparing band ratio measures to parameterizations of power spectral features and find that multiple disparate features influence ratio measures. For example, the commonly applied θ/β ratio is most reflective of differences in aperiodic activity, and not oscillatory θ or β power. Collectively, we show that periodic and aperiodic features can create the same observed changes in band ratio measures, and that this is inconsistent with their typical interpretations as measures of periodic power. We conclude that band ratio measures are a non-specific measure, conflating multiple possible underlying spectral changes, and recommend explicit parameterization of neural power spectra as a more specific approach.
Keywords: aperiodic neural activity; frequency band ratios; neural oscillations; spectral analyses; θ/β ratio.
Copyright © 2020 Donoghue et al.
Figures
Similar articles
-
Parameterizing neural power spectra into periodic and aperiodic components.Nat Neurosci. 2020 Dec;23(12):1655-1665. doi: 10.1038/s41593-020-00744-x. Epub 2020 Nov 23. Nat Neurosci. 2020. PMID: 33230329 Free PMC article.
-
Separating Neural Oscillations from Aperiodic 1/f Activity: Challenges and Recommendations.Neuroinformatics. 2022 Oct;20(4):991-1012. doi: 10.1007/s12021-022-09581-8. Epub 2022 Apr 7. Neuroinformatics. 2022. PMID: 35389160 Free PMC article.
-
Early development of electrophysiological activity: Contribution of periodic and aperiodic components of the EEG signal.Psychophysiology. 2023 Nov;60(11):e14360. doi: 10.1111/psyp.14360. Epub 2023 Jun 15. Psychophysiology. 2023. PMID: 37322838
-
Linking the multiple-demand cognitive control system to human electrophysiological activity.Neuropsychologia. 2025 Apr 15;210:109096. doi: 10.1016/j.neuropsychologia.2025.109096. Epub 2025 Feb 16. Neuropsychologia. 2025. PMID: 39965747 Free PMC article. Review.
-
Clinical applications of EEG power spectra aperiodic component analysis: A mini-review.Clin Neurophysiol. 2022 Nov;143:1-13. doi: 10.1016/j.clinph.2022.08.010. Epub 2022 Aug 28. Clin Neurophysiol. 2022. PMID: 36088797 Review.
Cited by
-
Changes in electrophysiological aperiodic activity during cognitive control in Parkinson's disease.Brain Commun. 2024 Sep 7;6(5):fcae306. doi: 10.1093/braincomms/fcae306. eCollection 2024. Brain Commun. 2024. PMID: 39301291 Free PMC article.
-
Standard multiscale entropy reflects neural dynamics at mismatched temporal scales: What's signal irregularity got to do with it?PLoS Comput Biol. 2020 May 11;16(5):e1007885. doi: 10.1371/journal.pcbi.1007885. eCollection 2020 May. PLoS Comput Biol. 2020. PMID: 32392250 Free PMC article.
-
Inflammation, tau pathology, and synaptic integrity associated with sleep spindles and memory prior to β-amyloid positivity.Sleep. 2022 Sep 8;45(9):zsac135. doi: 10.1093/sleep/zsac135. Sleep. 2022. PMID: 35670275 Free PMC article.
-
Neurophysiological correlates of tactile width discrimination in humans.Front Hum Neurosci. 2023 May 12;17:1155102. doi: 10.3389/fnhum.2023.1155102. eCollection 2023. Front Hum Neurosci. 2023. PMID: 37250697 Free PMC article.
-
Aperiodic Neural Activity is a Better Predictor of Schizophrenia than Neural Oscillations.Clin EEG Neurosci. 2023 Jul;54(4):434-445. doi: 10.1177/15500594231165589. Epub 2023 Jun 7. Clin EEG Neurosci. 2023. PMID: 37287239 Free PMC article.
References
Publication types
MeSH terms
Grants and funding
LinkOut - more resources
Full Text Sources