. 2020 Oct;30(10):1492-1507.
doi: 10.1101/gr.260984.120. Epub 2020 Sep 25.

Genome-wide dynamics of RNA synthesis, processing, and degradation without RNA metabolic labeling

Affiliations

Genome-wide dynamics of RNA synthesis, processing, and degradation without RNA metabolic labeling

Mattia Furlan et al. Genome Res. 2020 Oct.

Abstract

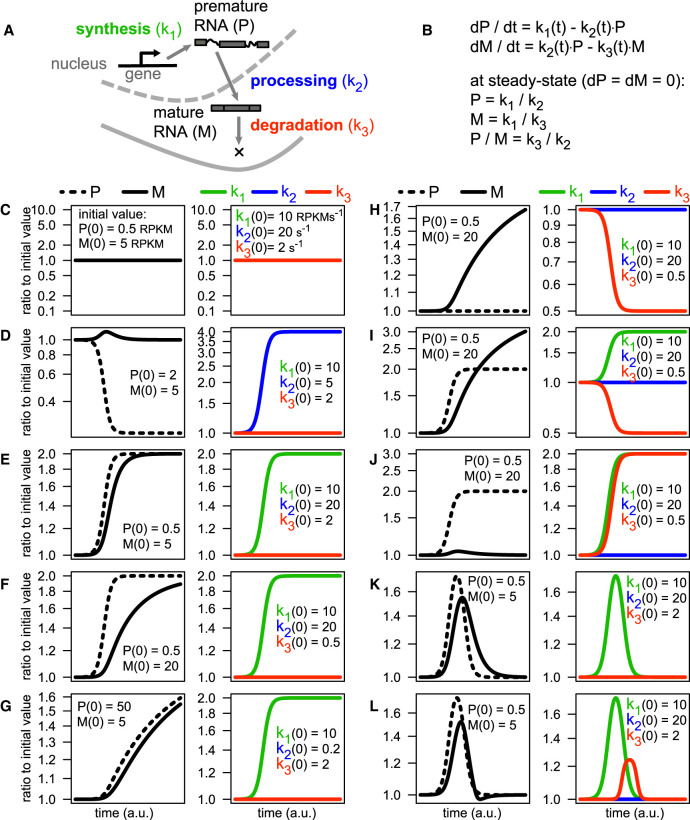
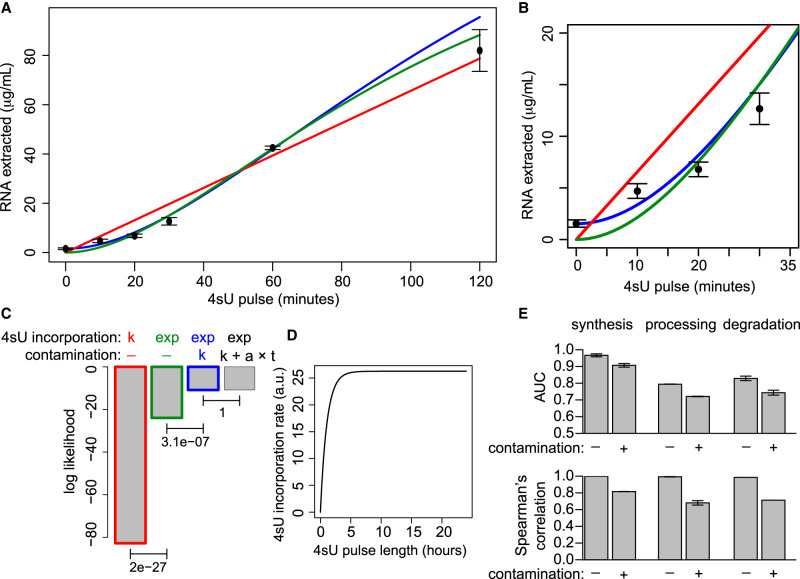
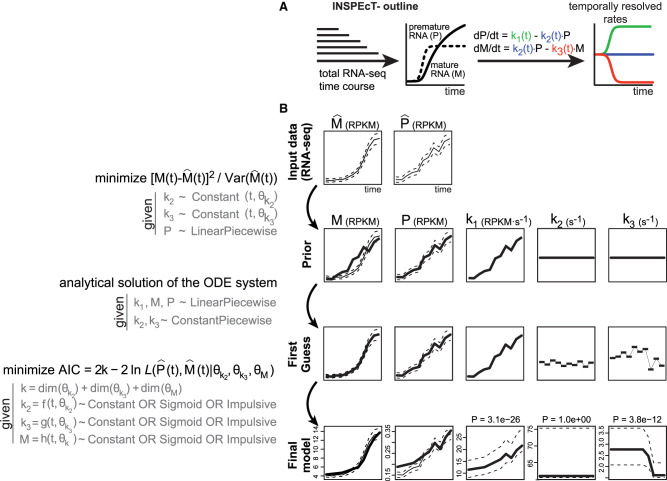
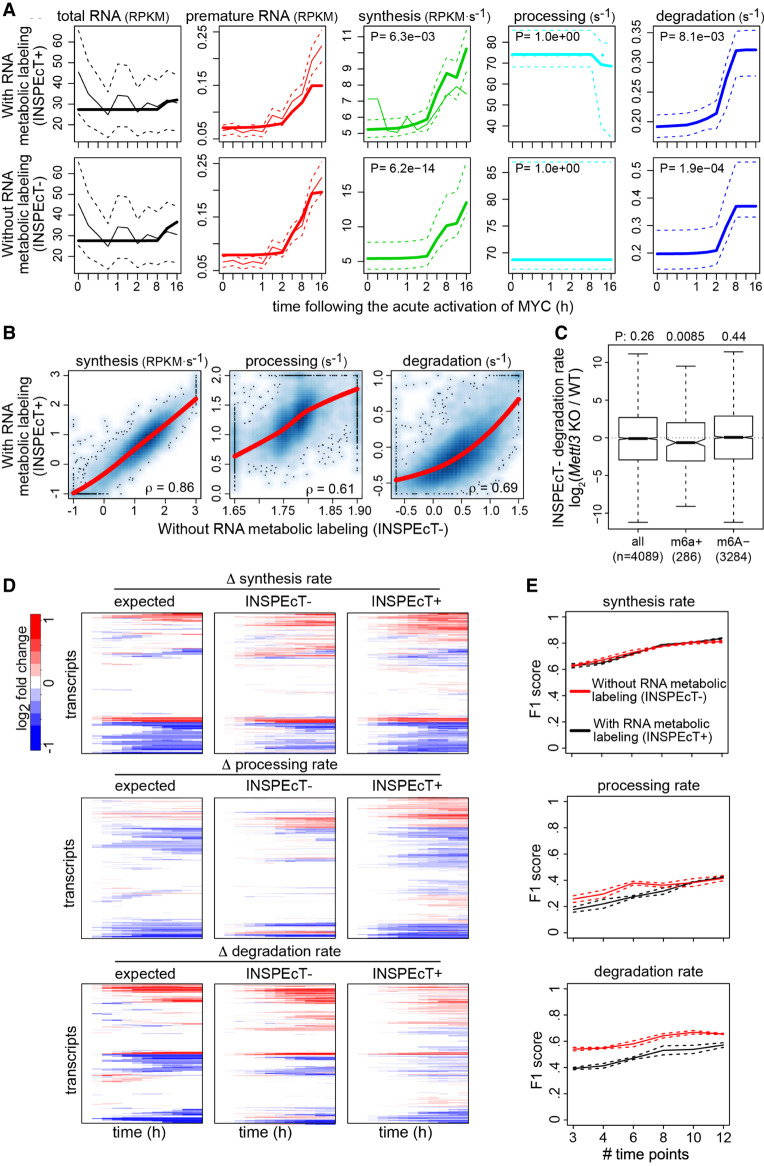
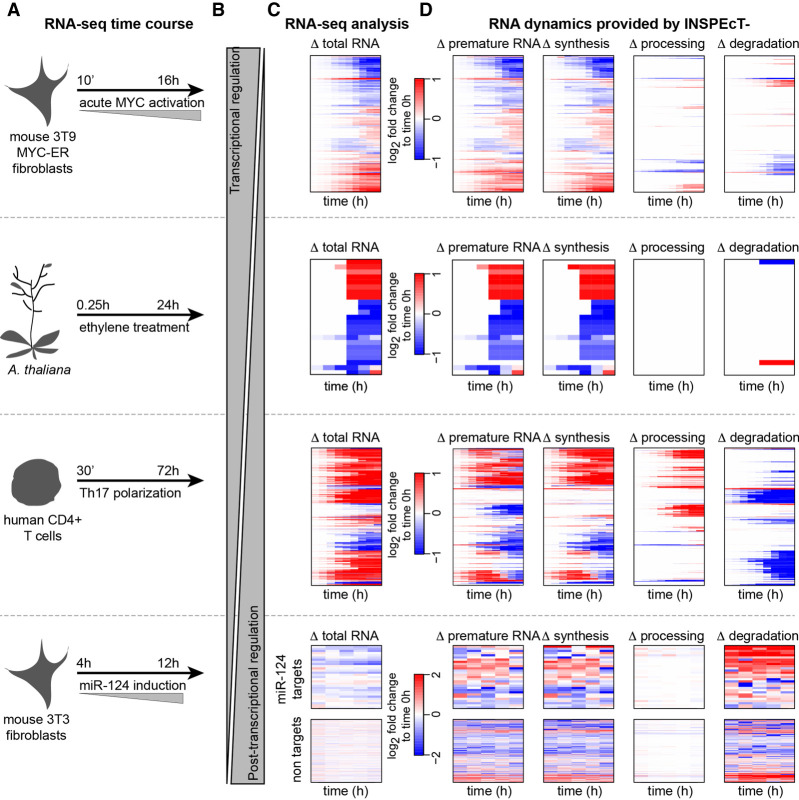
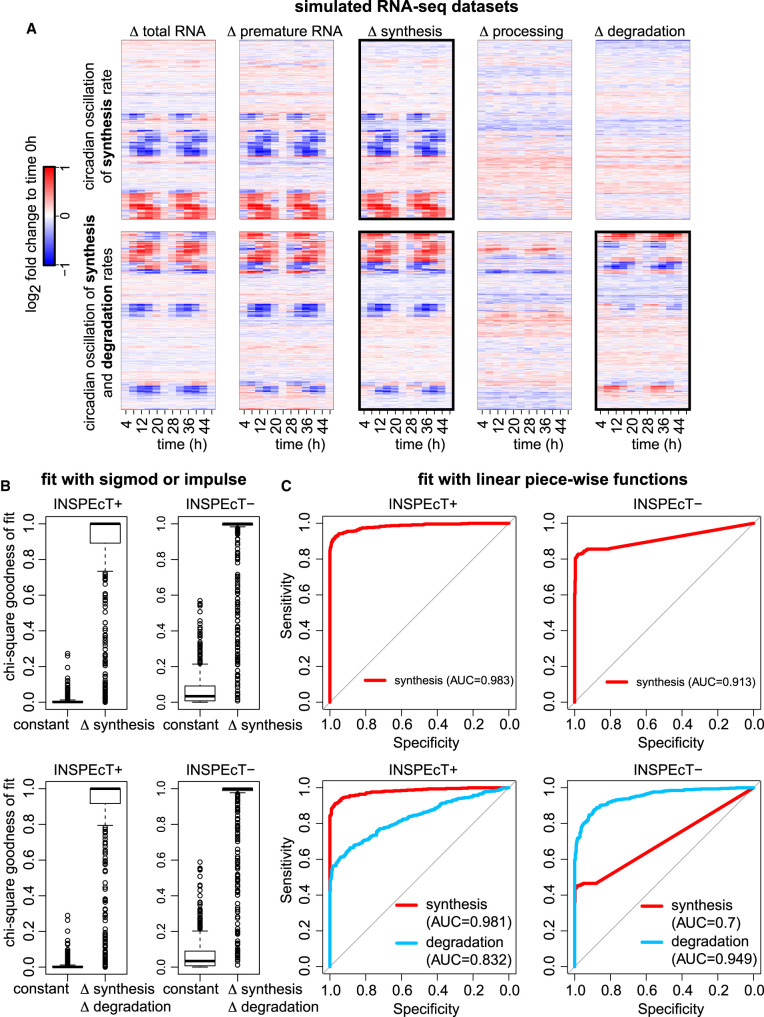
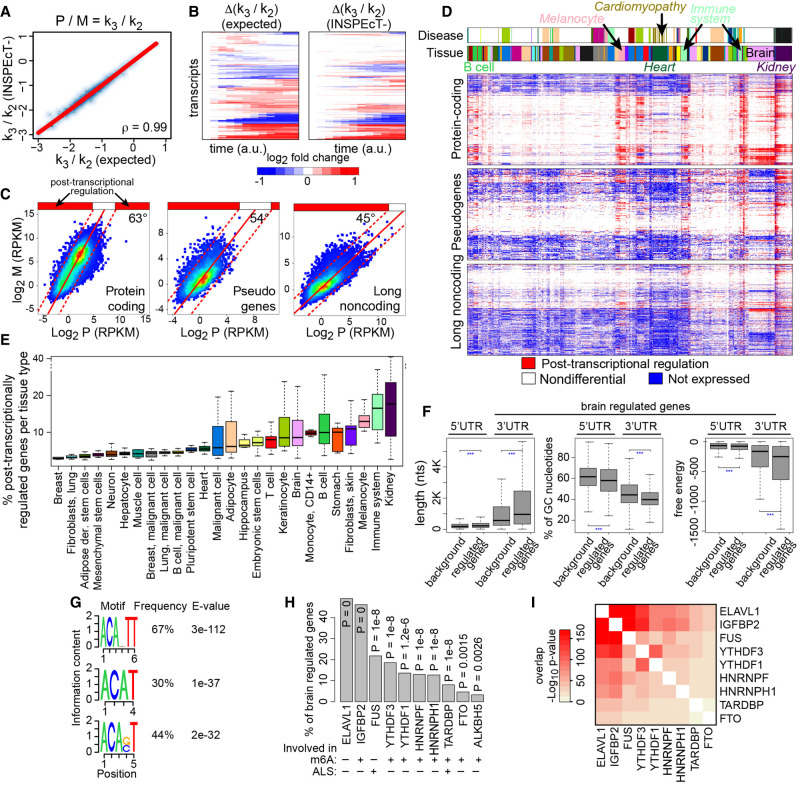
The quantification of the kinetic rates of RNA synthesis, processing, and degradation are largely based on the integrative analysis of total and nascent transcription, the latter being quantified through RNA metabolic labeling. We developed INSPEcT-, a computational method based on the mathematical modeling of premature and mature RNA expression that is able to quantify kinetic rates from steady-state or time course total RNA-seq data without requiring any information on nascent transcripts. Our approach outperforms available solutions, closely recapitulates the kinetic rates obtained through RNA metabolic labeling, improves the ability to detect changes in transcript half-lives, reduces the cost and complexity of the experiments, and can be adopted to study experimental conditions in which nascent transcription cannot be readily profiled. Finally, we applied INSPEcT- to the characterization of post-transcriptional regulation landscapes in dozens of physiological and disease conditions. This approach was included in the INSPEcT Bioconductor package, which can now unveil RNA dynamics from steady-state or time course data, with or without the profiling of nascent RNA.


Figures

Figure 1.
Figure 1.
The influence of RNA kinetic rates on RNA abundance and responsiveness. (A) Schematic representation of the RNA life cycle, governed by the kinetics rates of synthesis, processing and degradation. (B) Deterministic mathematical model of the RNA life cycle based on ordinary differential equations (ODEs), including the solution of the system at steady state. (CL) Solutions of the ODE system following the modulation of the kinetic rates: Each example reports, for premature and mature RNA species (left) and for the kinetic rates (right), the ratio to the initial time point. Initial values are indicated within each panel.
Figure 2.
Figure 2.
Contamination of 4sU labeled RNA with unlabeled RNA. (A) Yield of labeled RNA at 4sU pulses of different length in 3T9 mouse fibroblast cells. (B) A magnification of A. (C) Log likelihood score for the fit of four alternative models, considering constant (k) or exponential (exp) 4sU incorporation rates, combined with a contamination that is absent (−), constant (k), or linear to the 4sU pulse length (k + a × t). P-values of the indicated log likelihood-ratio tests are reported. (D) The estimated trend of 4sU incorporation based on the green model in panel A. (E) Changes in ROC areas under the curve (AUC) and in Spearman's correlation following the introduction of 30% contamination in simulated data.
Figure 3.
Figure 3.
Temporal quantification of RNA dynamics without RNA metabolic labeling. (A) Outline of INSPEcT−. (B) INSPEcT− workflow; for details, see text. (AIC) Akaike information criterion; (L) likelihood function.
Figure 4.
Figure 4.
Validation of INSPEcT− kinetic rates. (A) H2bc6 RNA dynamics quantified in 3T9 mouse fibroblast cells following the acute activation of MYC with (INSPEcT+) and without (INSPEcT−) RNA metabolic labeling. Solid bold lines indicate the model fit; thin solid and dashed lines indicate mean and standard deviation of experimental data for total and premature RNA; dashed lines indicate 95% confidence intervals for the kinetic rates models. (B) Scatter plots of RNA kinetic rates quantified in untreated 3T9 cells using INSPEcT+ and INSPEcT−. Regression curves and Spearman's correlation coefficients are indicated within each panel. (C) Boxplot of the changes in degradation rates during the differentiation of T cells quantified with INSPEcT−. Rates changes are displayed for m6A+, m6A−, or all RNAs in untreated cells. One-tailed Wilcoxon test P-values are displayed on the top. (D) Temporal changes of the RNA kinetic rates for simulated genes, relative to the initial time point (left), compared with those quantified through INSPEcT+ (middle) and INSPEcT− (right). (E) For each kinetic rate, quantified with or without metabolic labeling data, F1 scores are reported that measure the quality of the classification (P-value cutoff 0.05), considering both precision and recall. Score means and standard deviations are reported based on three simulated data sets obtained at increasing number of time points.
Figure 5.
Figure 5.
Characterization of time course RNA dynamics: reanalysis of four published data sets with INSPEcT−. (A) Experimental design of the considered RNA-seq time courses. (B) Expected balance between transcriptional and post-transcriptional responses in the different experiments. (C) The typical output of differential RNA-seq analyses: heatmap of differentially expressed genes. (D) The additional information gained by reanalyzing those data with INSPEcT−, which includes the gene-level modulation of premature RNAs, as well as the temporal changes of the kinetic rates of synthesis, processing, and degradation. For the miR-124 data set, reported rates are first-guess estimates, owing to lack of replicates in the time course.
Figure 6.
Figure 6.
Modeling RNA dynamics without assumptions on the functional form. (A) Simulated data composed by 500 constant genes and 500 genes subject to the circadian oscillation of synthesis (top) or synthesis followed by degradation rates (bottom). (B) Chi-square goodness of fit of sigmoid or impulse models on the data sets in A using INSPEcT+ or INSPEcT−. (C) ROC analysis of the classification of synthesis (top) or synthesis and degradation rates (bottom) using INSPEcT+ or INSPEcT− with linear piecewise functions.
Figure 7.
Figure 7.
Characterization of steady-state RNA dynamics: reanalysis of 620 RNA-seq data sets with INSPEcT−. At steady state, the ratio between premature (P) and mature (M) RNA corresponds to the ratio between degradation (k3) and processing (k2) rates. Absolute values (A) and the temporal variation (B) of k3/k2 ratios determined by INSPEcT− on simulated data were compared to the ground truth (“expected”). (C) Median abundances of premature and mature RNAs per gene across 620 RNA-seq data sets for the indicated gene classes. Density scatter plots were fitted with a linear model, whose slope is reported. (D) Heatmaps displaying the classification in terms of post-transcriptional regulation for each gene (row) in each sample (column). k3/k2 ratios were quantified for each gene in each sample and compared with the global trend depicted in C. Each gene is either not expressed (blue), is not differential (white; ratio between the dashed lines in C), or is differentially post-transcriptional regulated (red; ratio above the dashed lines). Above the heatmaps, two color bars indicate the tissue type and disease conditions of each sample. (E) Boxplot of the percentage of genes that are post-transcriptionally regulated for the samples associated to each cell type, color matched with D. (F) Distributions of length, %GC, and free energy for 3′ and 5′ UTRs of genes post-transcriptionally regulated in the brain compared with all genes expressed in the brain (background). (G) Sequence logo of the selected RNA-binding protein motifs in the 3′ UTR regions of brain regulated genes. (H) Frequency and P-values of enrichment for selected motifs of RNA-binding proteins found in UTR regions of brain regulated genes. (I) Hypergeometric P-value for the overlap between the genes associated to the factors in H.

References

    1. Adiconis X, Borges-Rivera D, Satija R, DeLuca DS, Busby MA, Berlin AM, Sivachenko A, Thompson DA, Wysoker A, Fennell T, et al. 2013. Comparative analysis of RNA sequencing methods for degraded or low-input samples. Nat Methods 10: 623–629. 10.1038/nmeth.2483 - DOI - PMC - PubMed
    1. Alkallas R, Fish L, Goodarzi H, Najafabadi HS. 2018. Inference of RNA decay rate from transcriptional profiling highlights the regulatory programs of Alzheimer's disease. Nat Commun 8: 909 10.1038/s41467-017-00867-z - DOI - PMC - PubMed
    1. Ameur A, Zaghlool A, Halvardson J, Wetterbom A, Gyllensten U, Cavelier L, Feuk L. 2011. Total RNA sequencing reveals nascent transcription and widespread co-transcriptional splicing in the human brain. Nat Struct Mol Biol 18: 1435–1440. 10.1038/nsmb.2143 - DOI - PubMed
    1. Austenaa LMI, Barozzi I, Simonatto M, Masella S, Chiara Della G, Ghisletti S, Curina A, de Wit E, Bouwman BAM, de Pretis S, et al. 2015. Transcription of mammalian cis-regulatory elements is restrained by actively enforced early termination. Mol Cell 60: 460–474. 10.1016/j.molcel.2015.09.018 - DOI - PubMed
    1. Baptista MAP, Dölken L. 2018. RNA dynamics revealed by metabolic RNA labeling and biochemical nucleoside conversions. Nat Methods 15: 171–172. 10.1038/nmeth.4608 - DOI - PubMed