. 2020 Dec;31(12):2833-2854.
doi: 10.1681/ASN.2020060806. Epub 2020 Sep 25.

Kidney Single-Cell Atlas Reveals Myeloid Heterogeneity in Progression and Regression of Kidney Disease

Affiliations

Kidney Single-Cell Atlas Reveals Myeloid Heterogeneity in Progression and Regression of Kidney Disease

Bryan R Conway et al. J Am Soc Nephrol. 2020 Dec.

Abstract

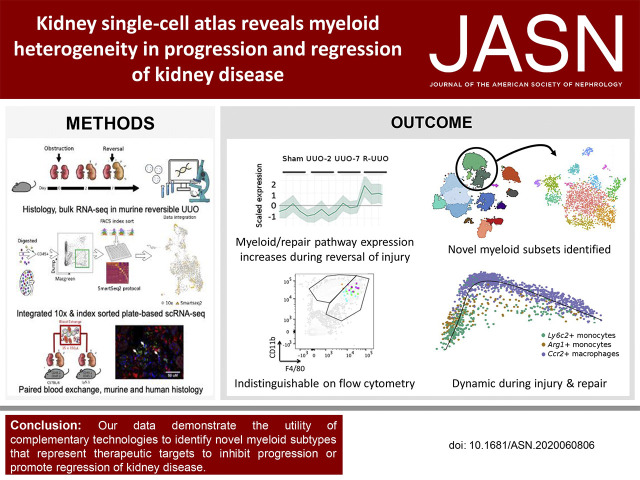
Background: Little is known about the roles of myeloid cell subsets in kidney injury and in the limited ability of the organ to repair itself. Characterizing these cells based only on surface markers using flow cytometry might not provide a full phenotypic picture. Defining these cells at the single-cell, transcriptomic level could reveal myeloid heterogeneity in the progression and regression of kidney disease.

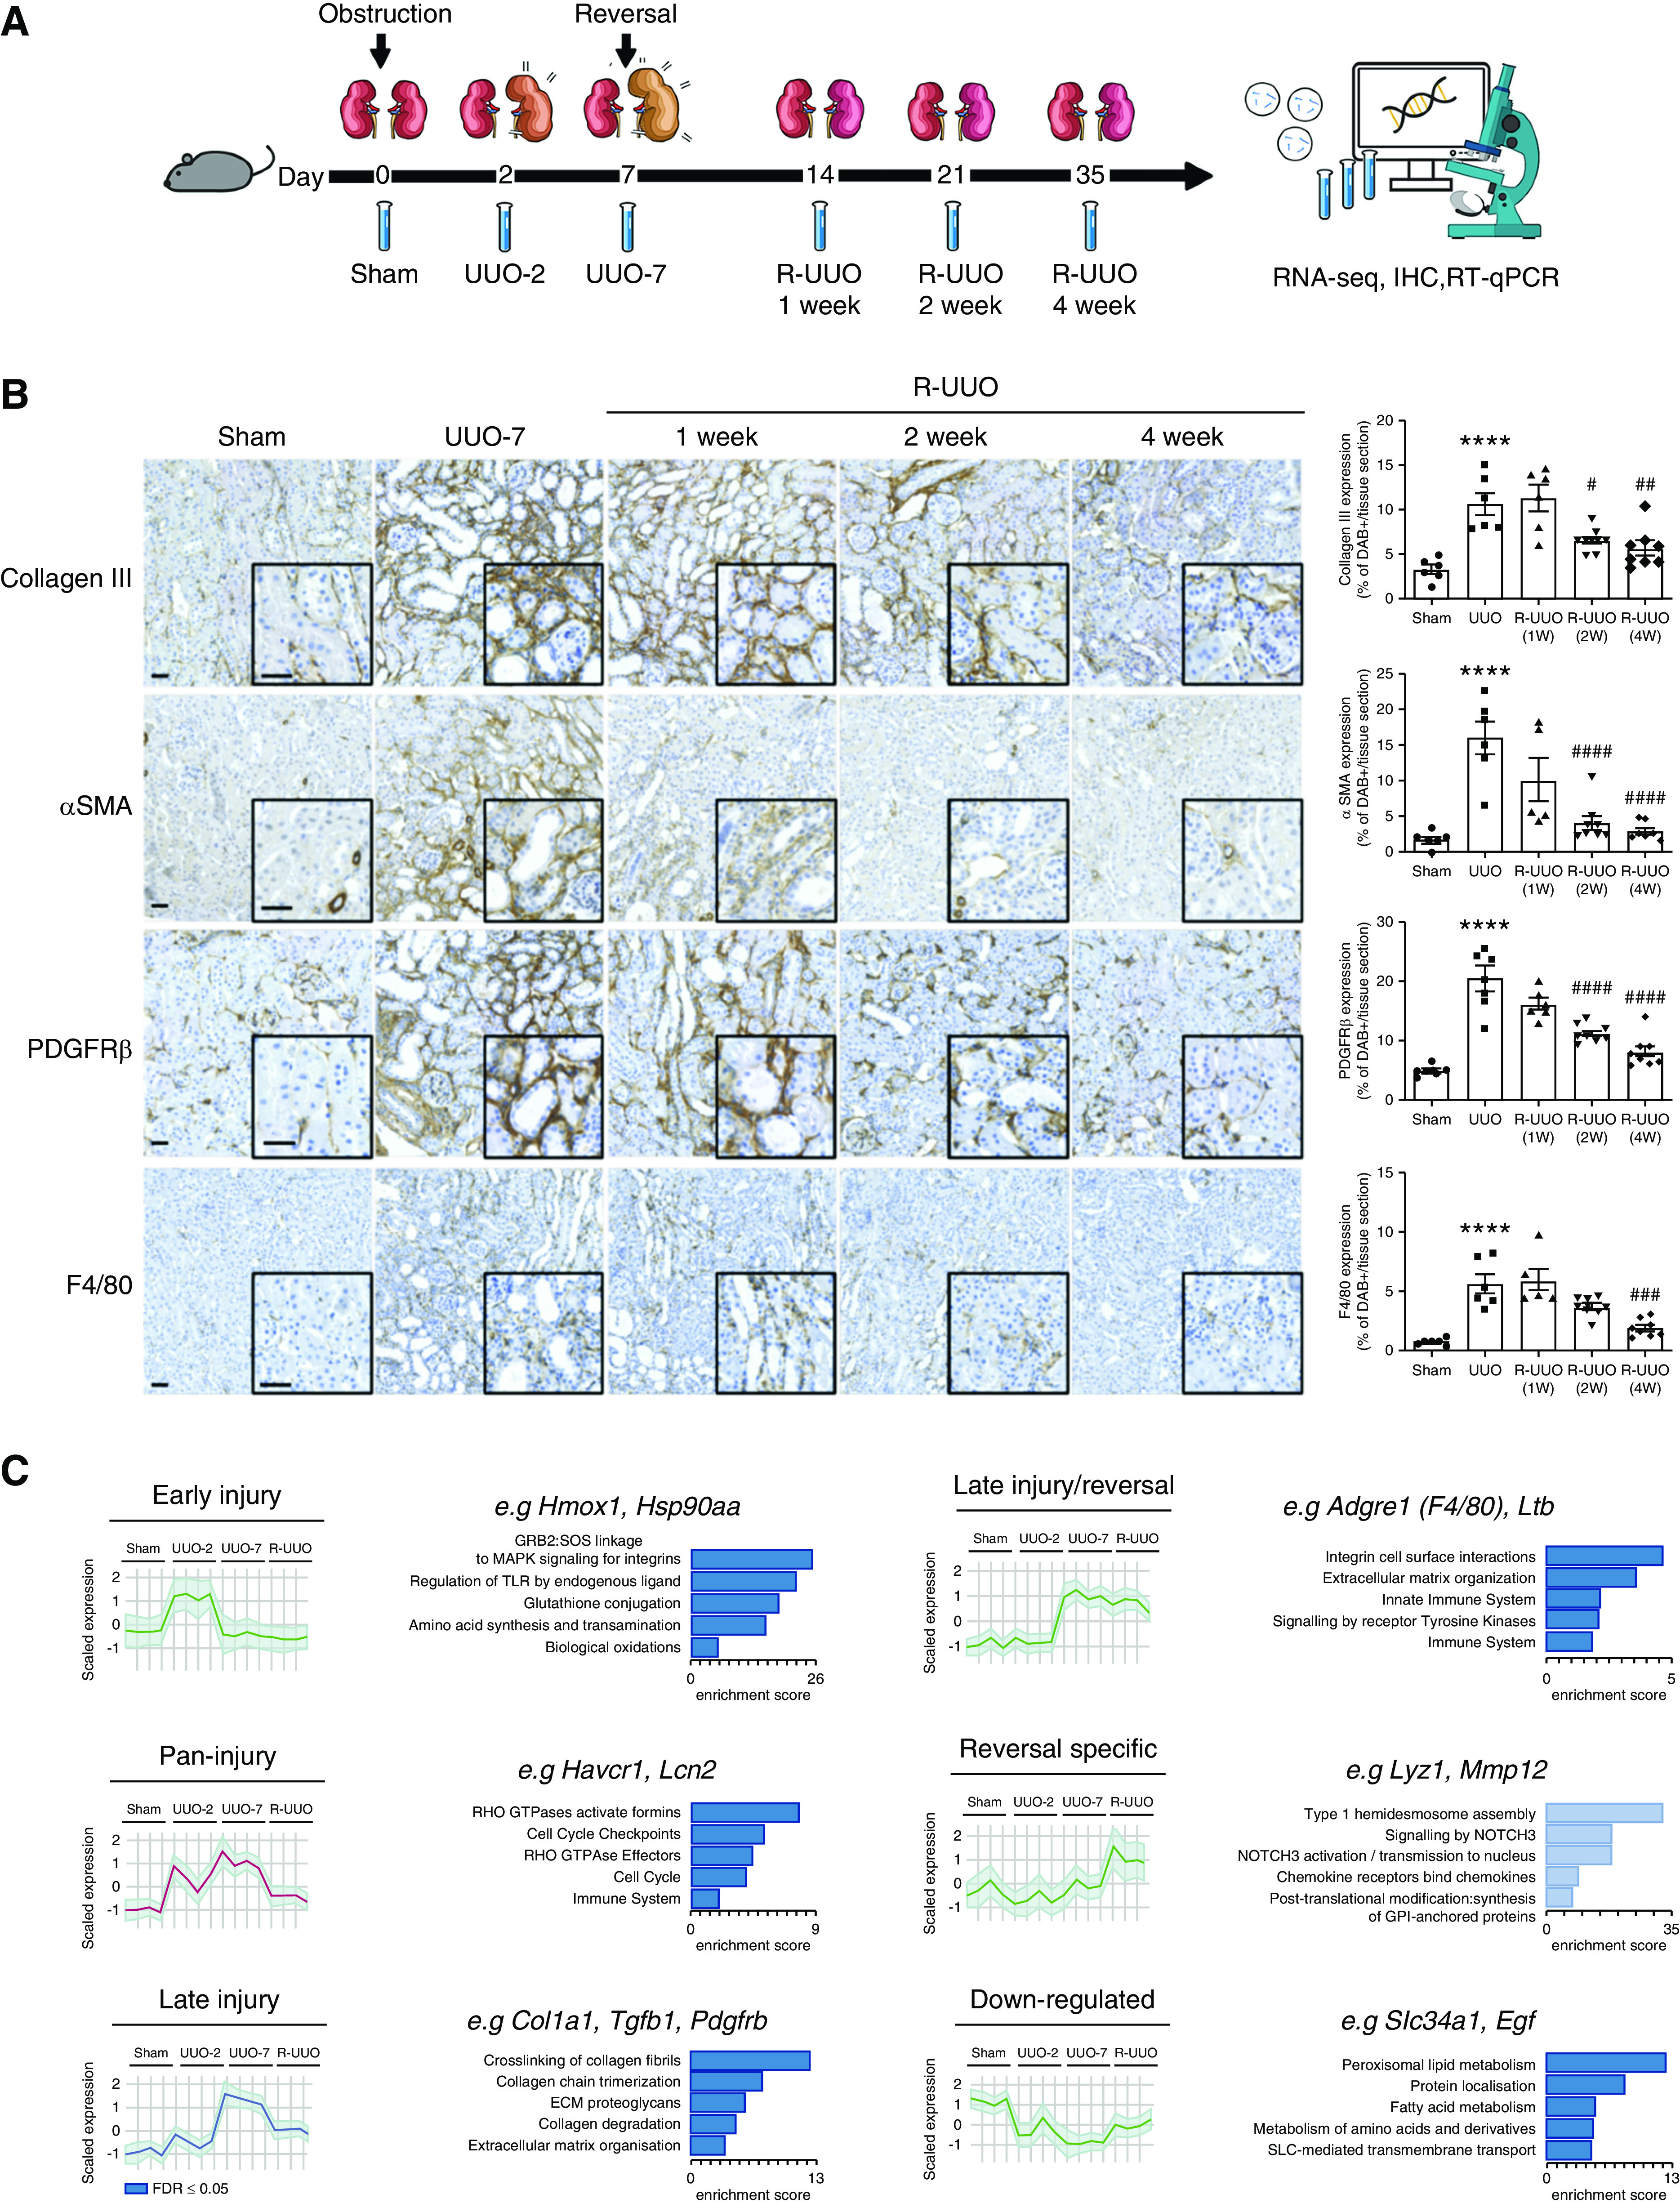
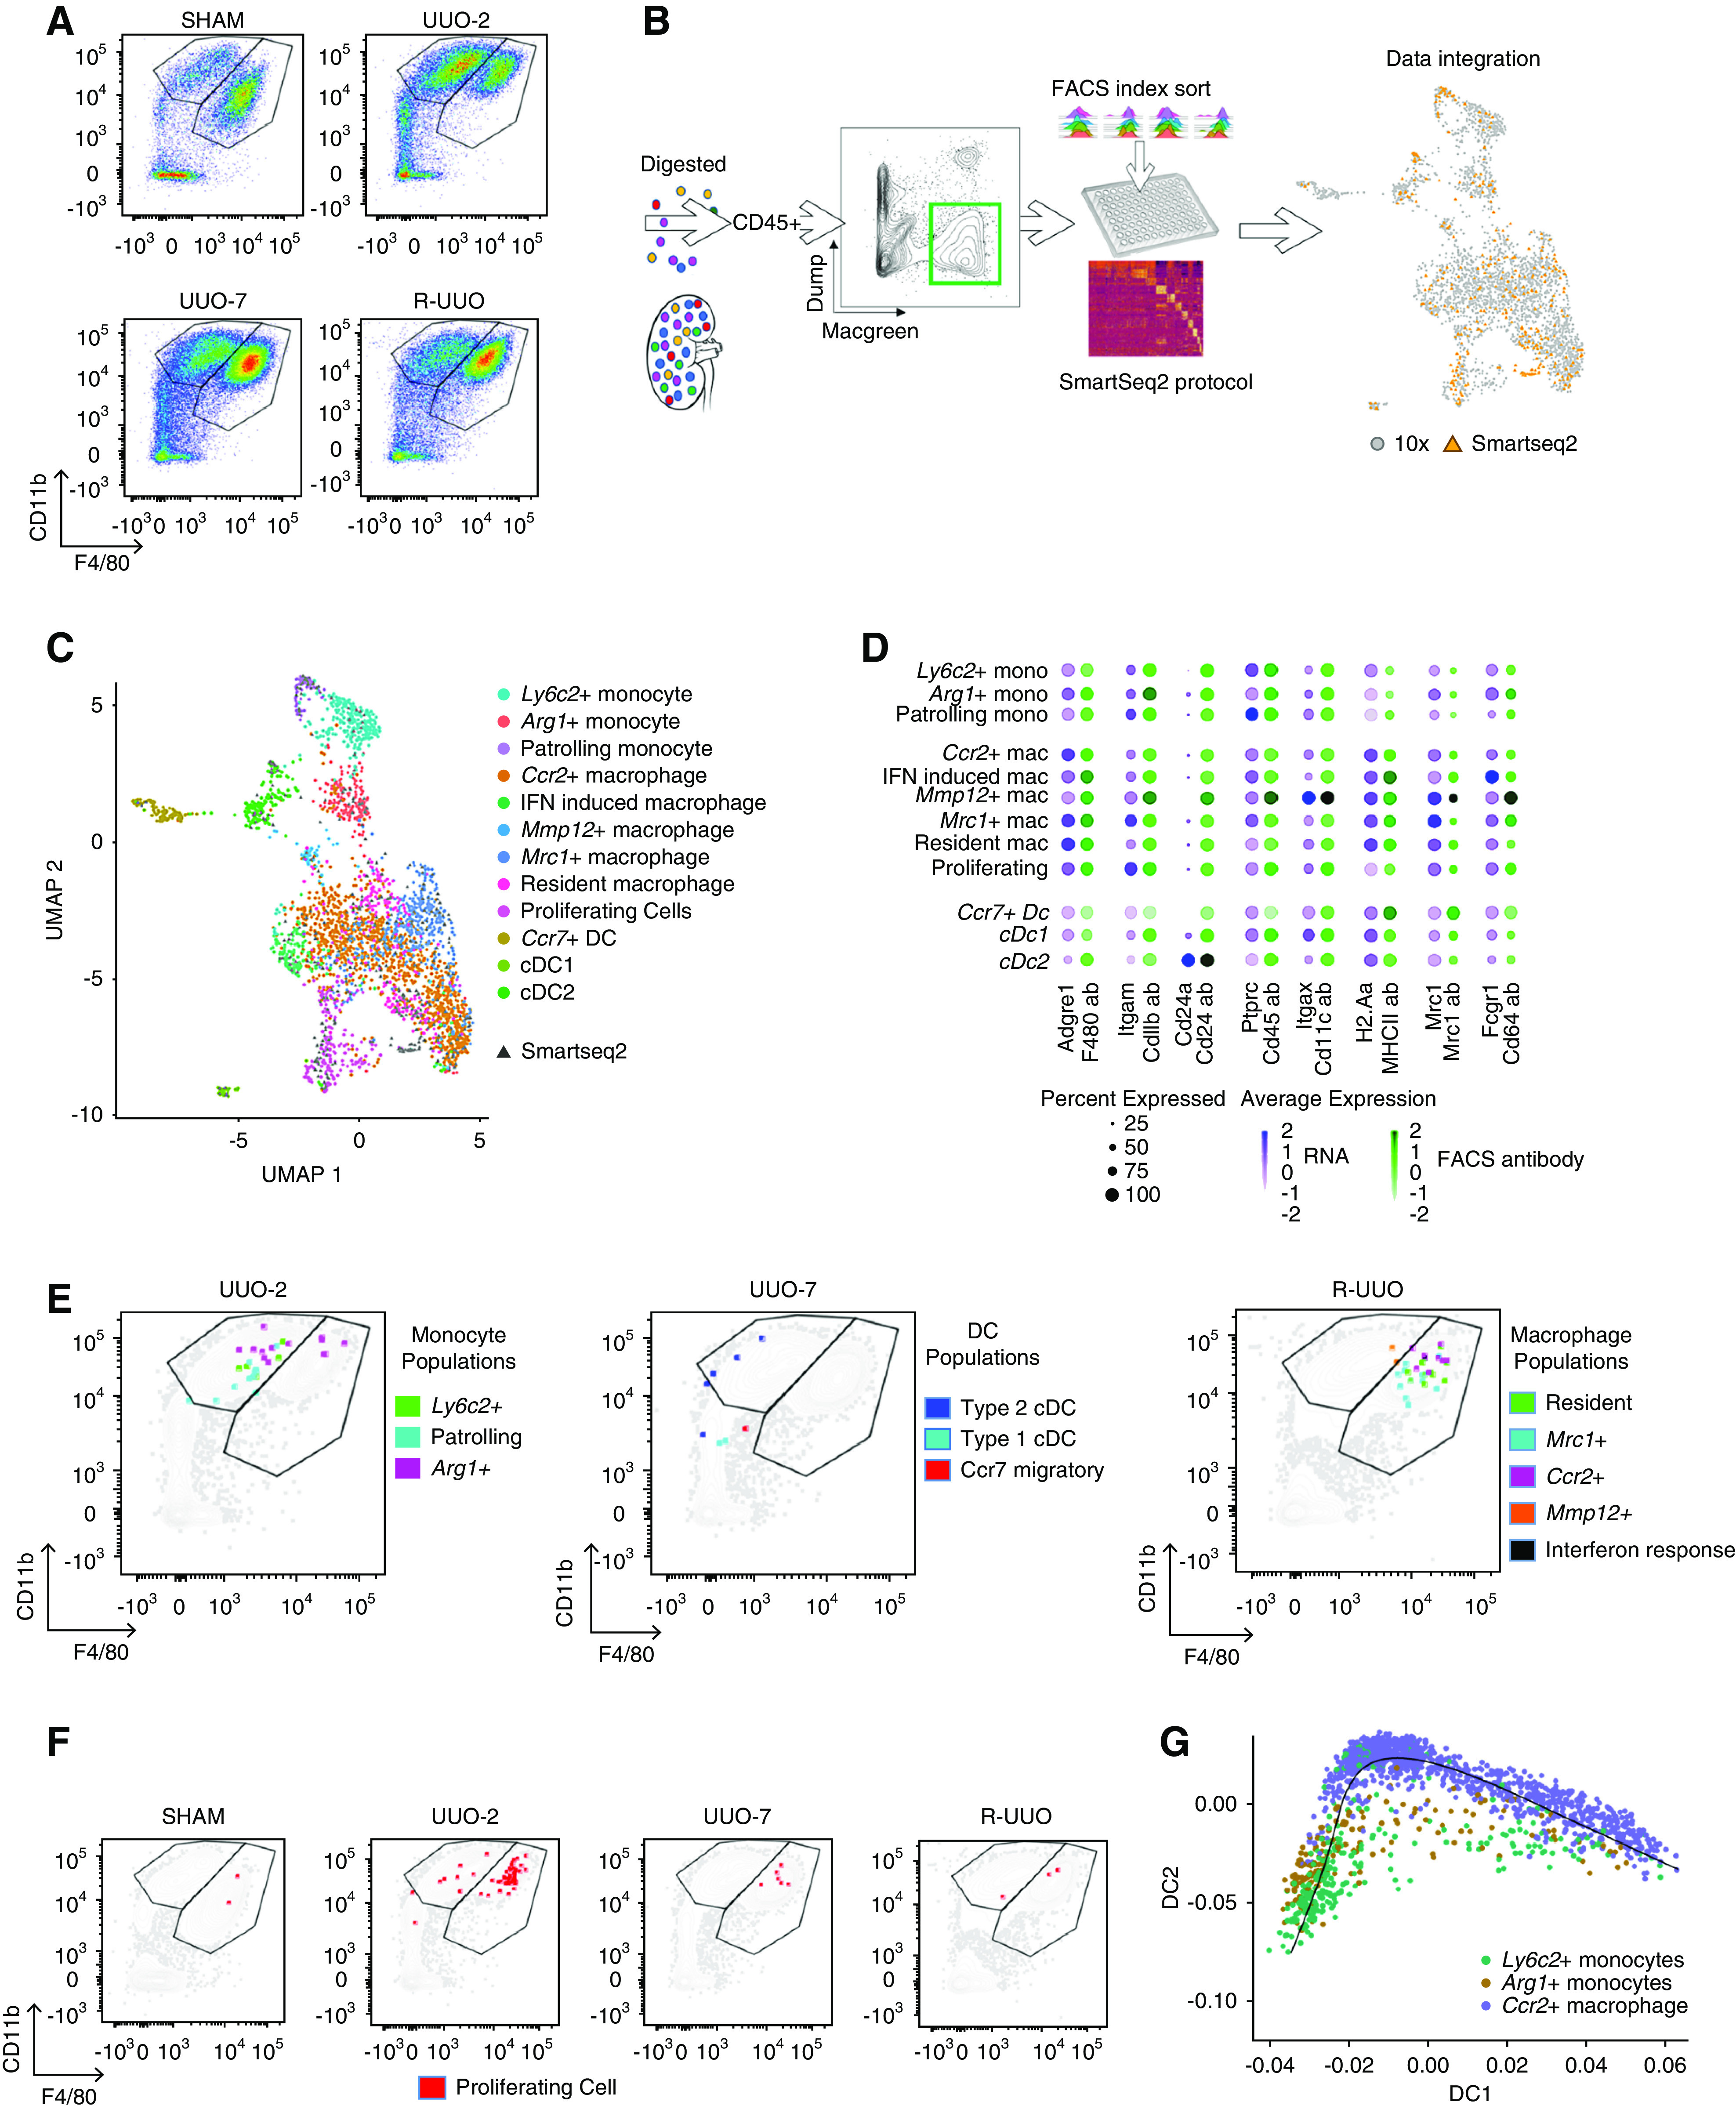
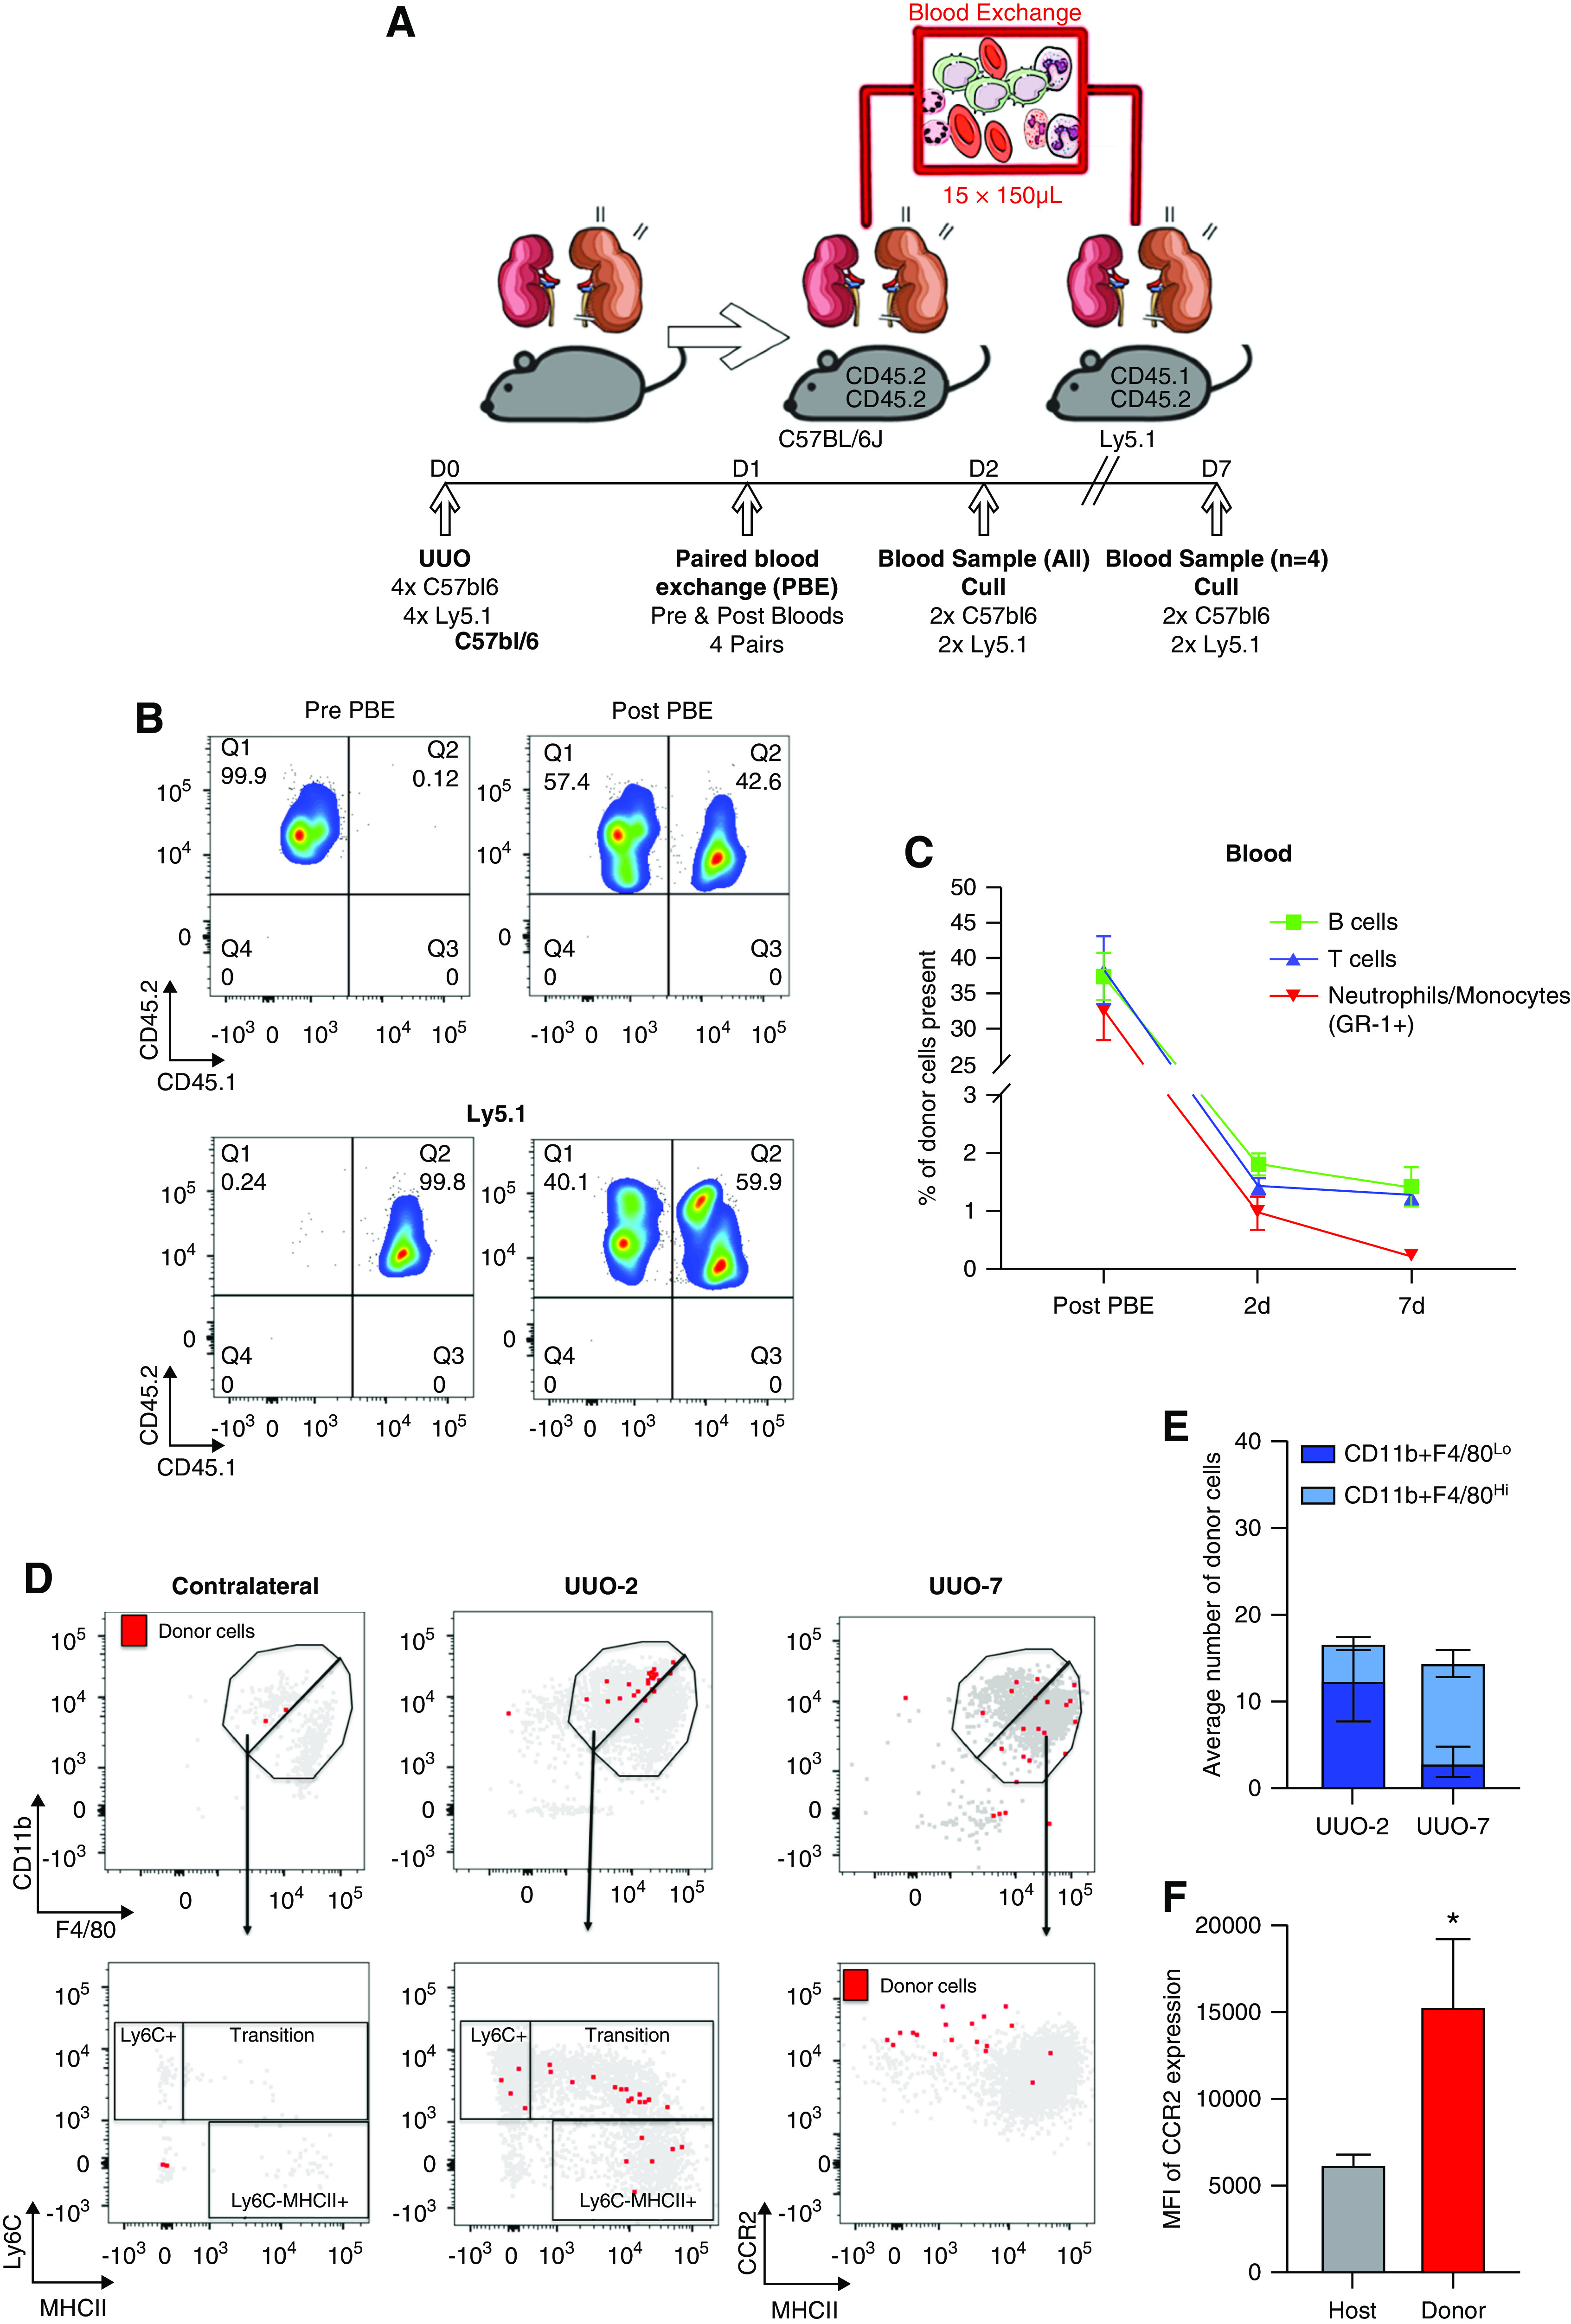
Methods: Integrated droplet- and plate-based single-cell RNA sequencing were used in the murine, reversible, unilateral ureteric obstruction model to dissect the transcriptomic landscape at the single-cell level during renal injury and the resolution of fibrosis. Paired blood exchange tracked the fate of monocytes recruited to the injured kidney.

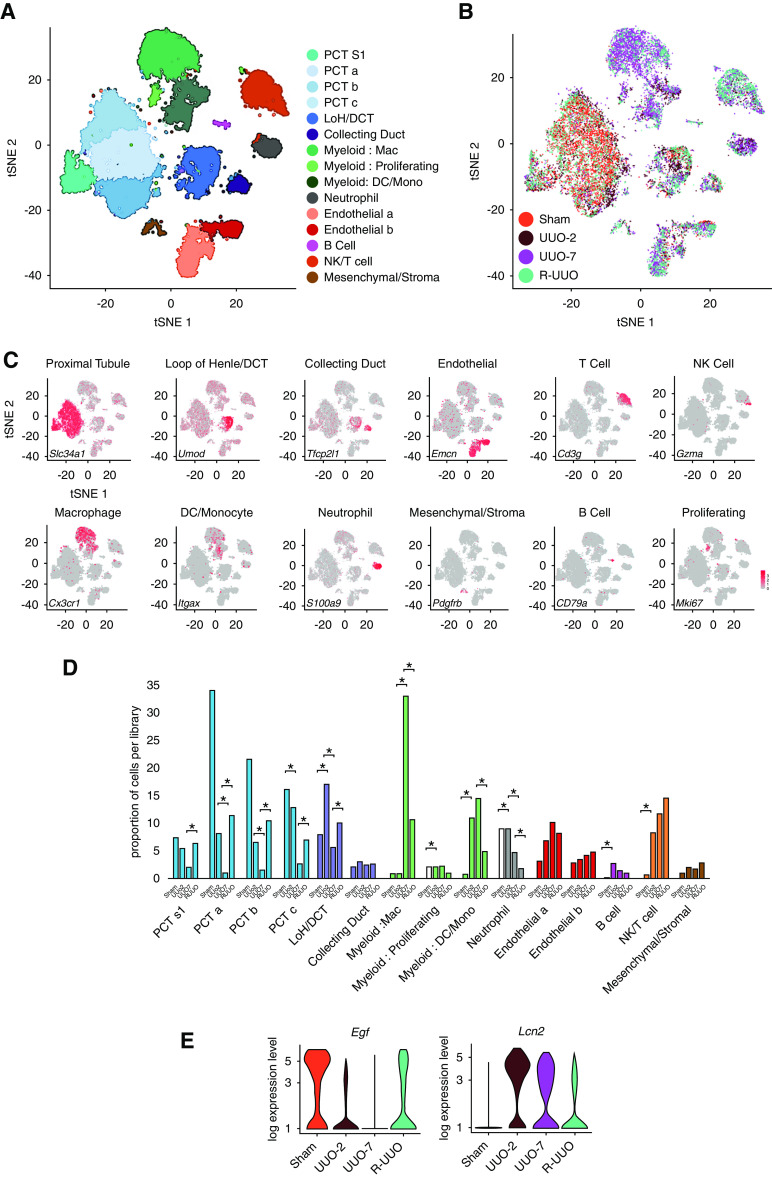
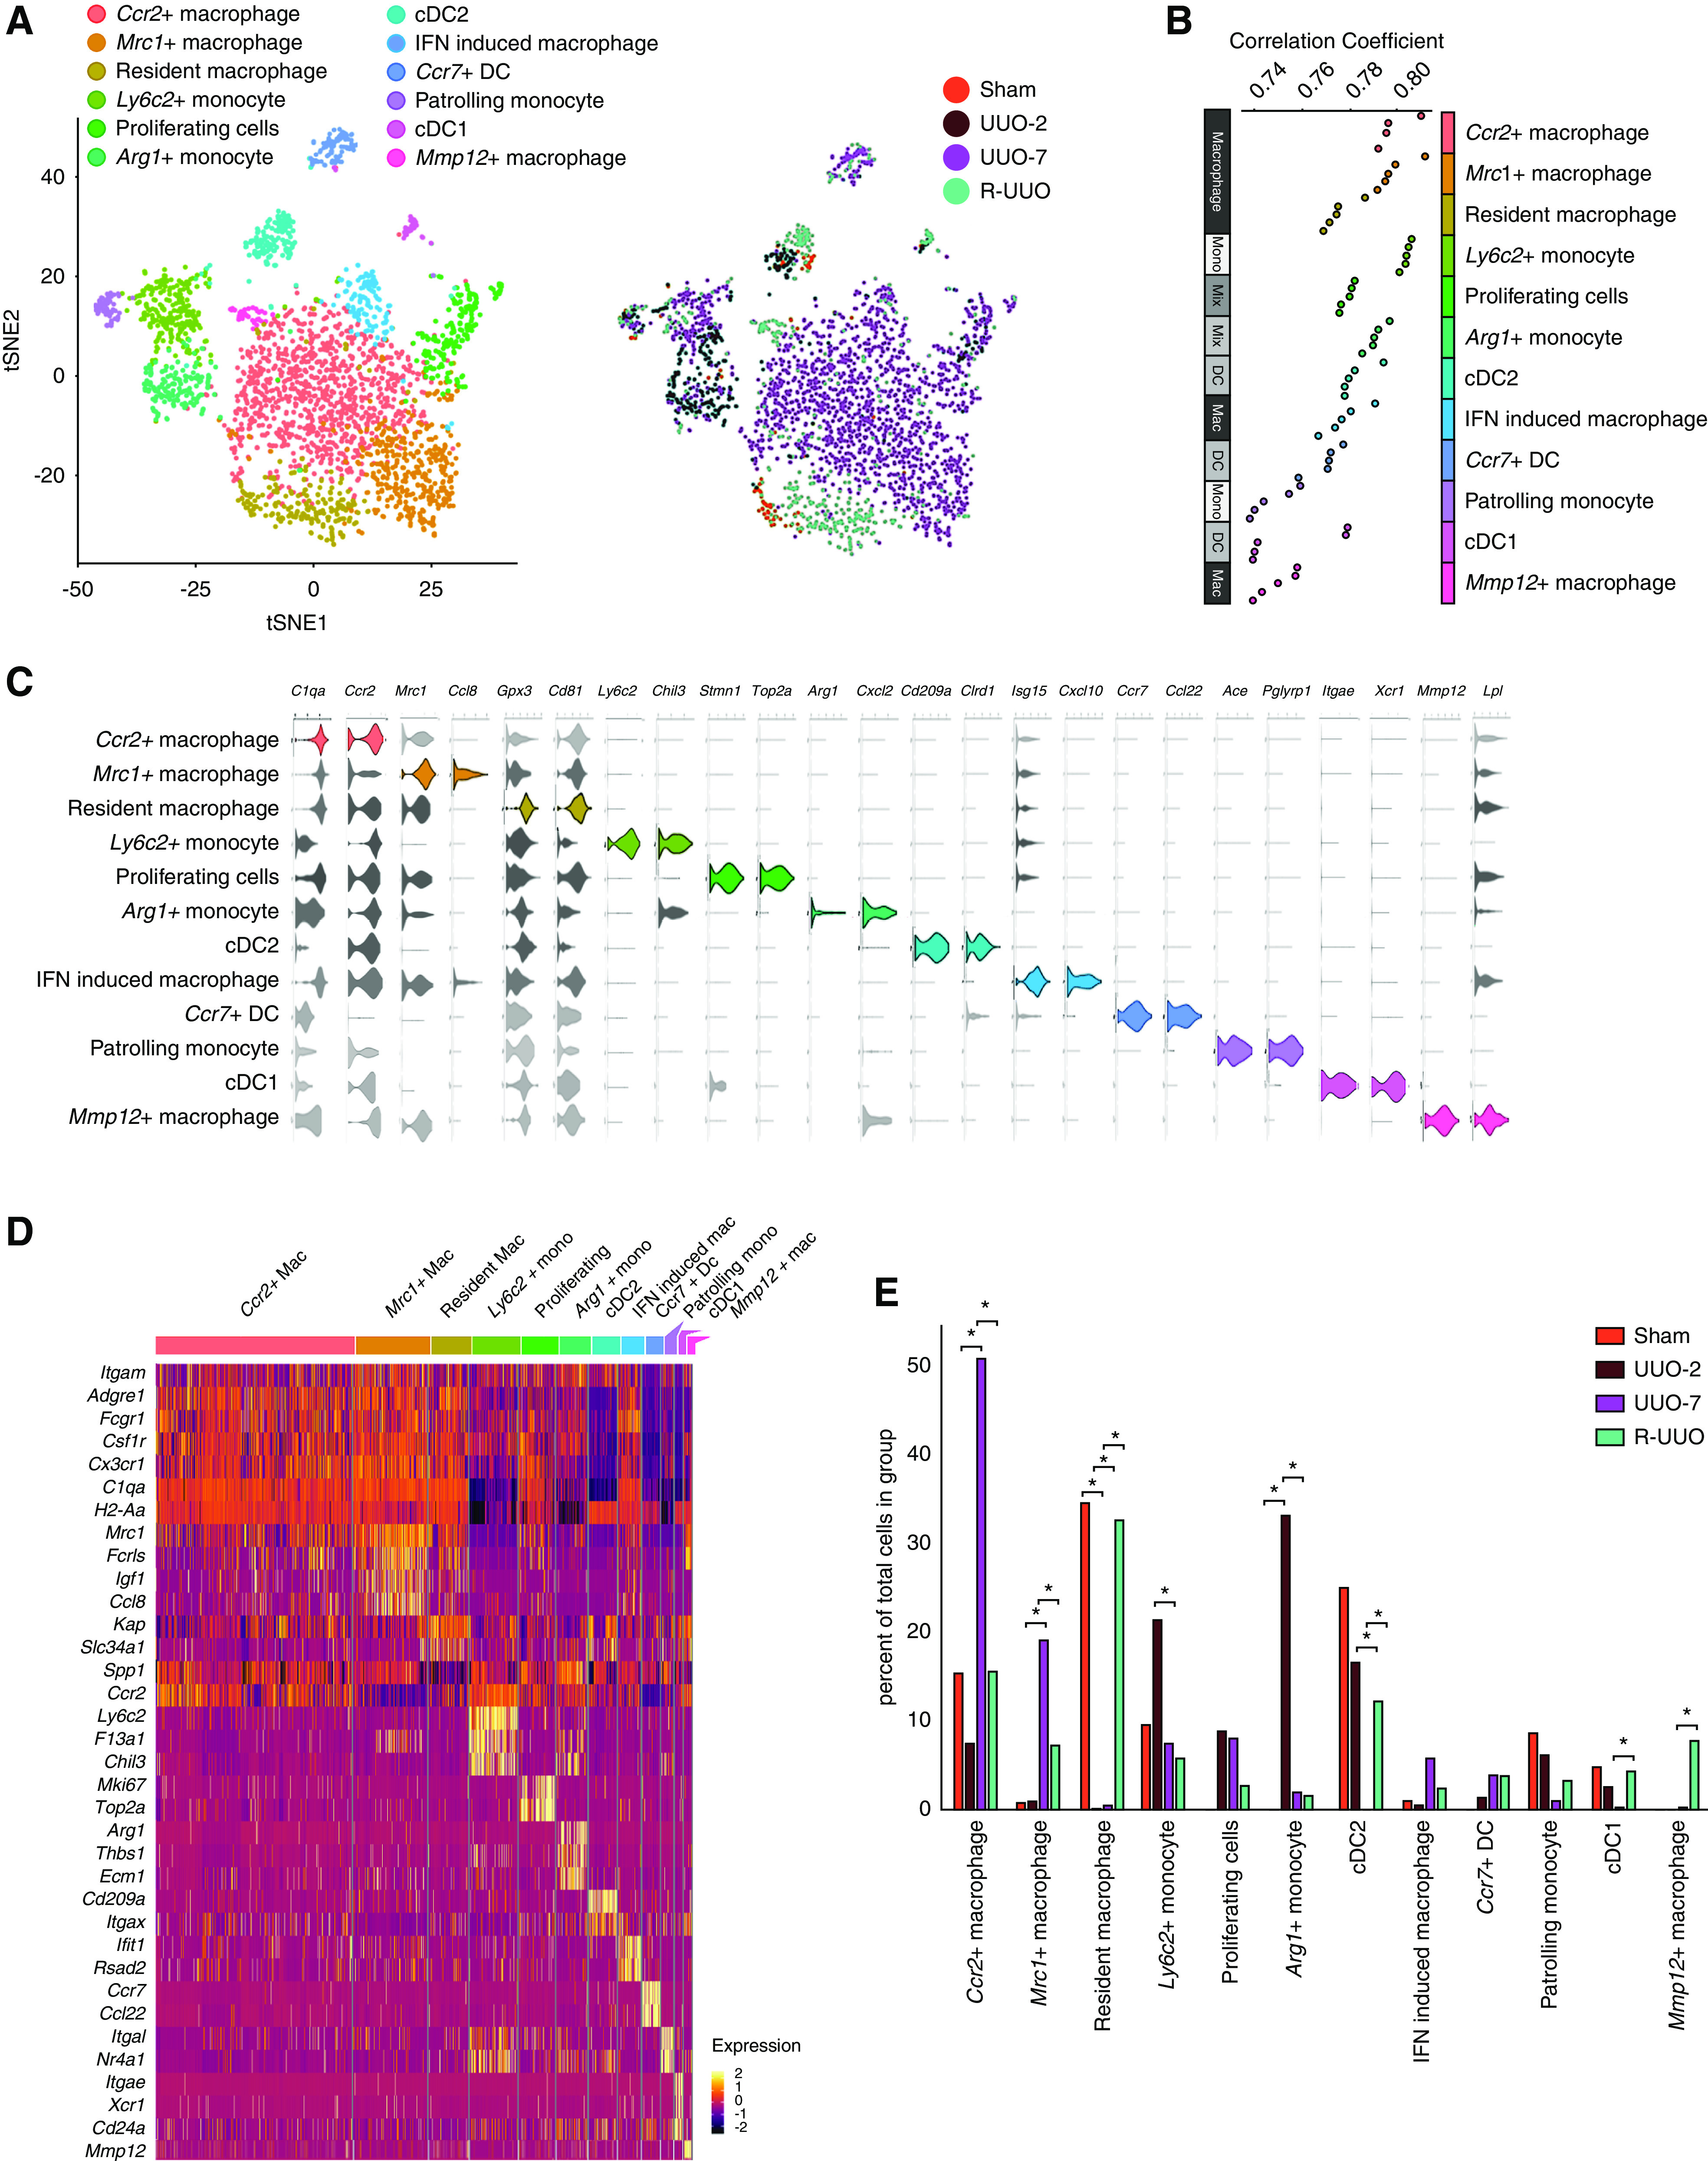
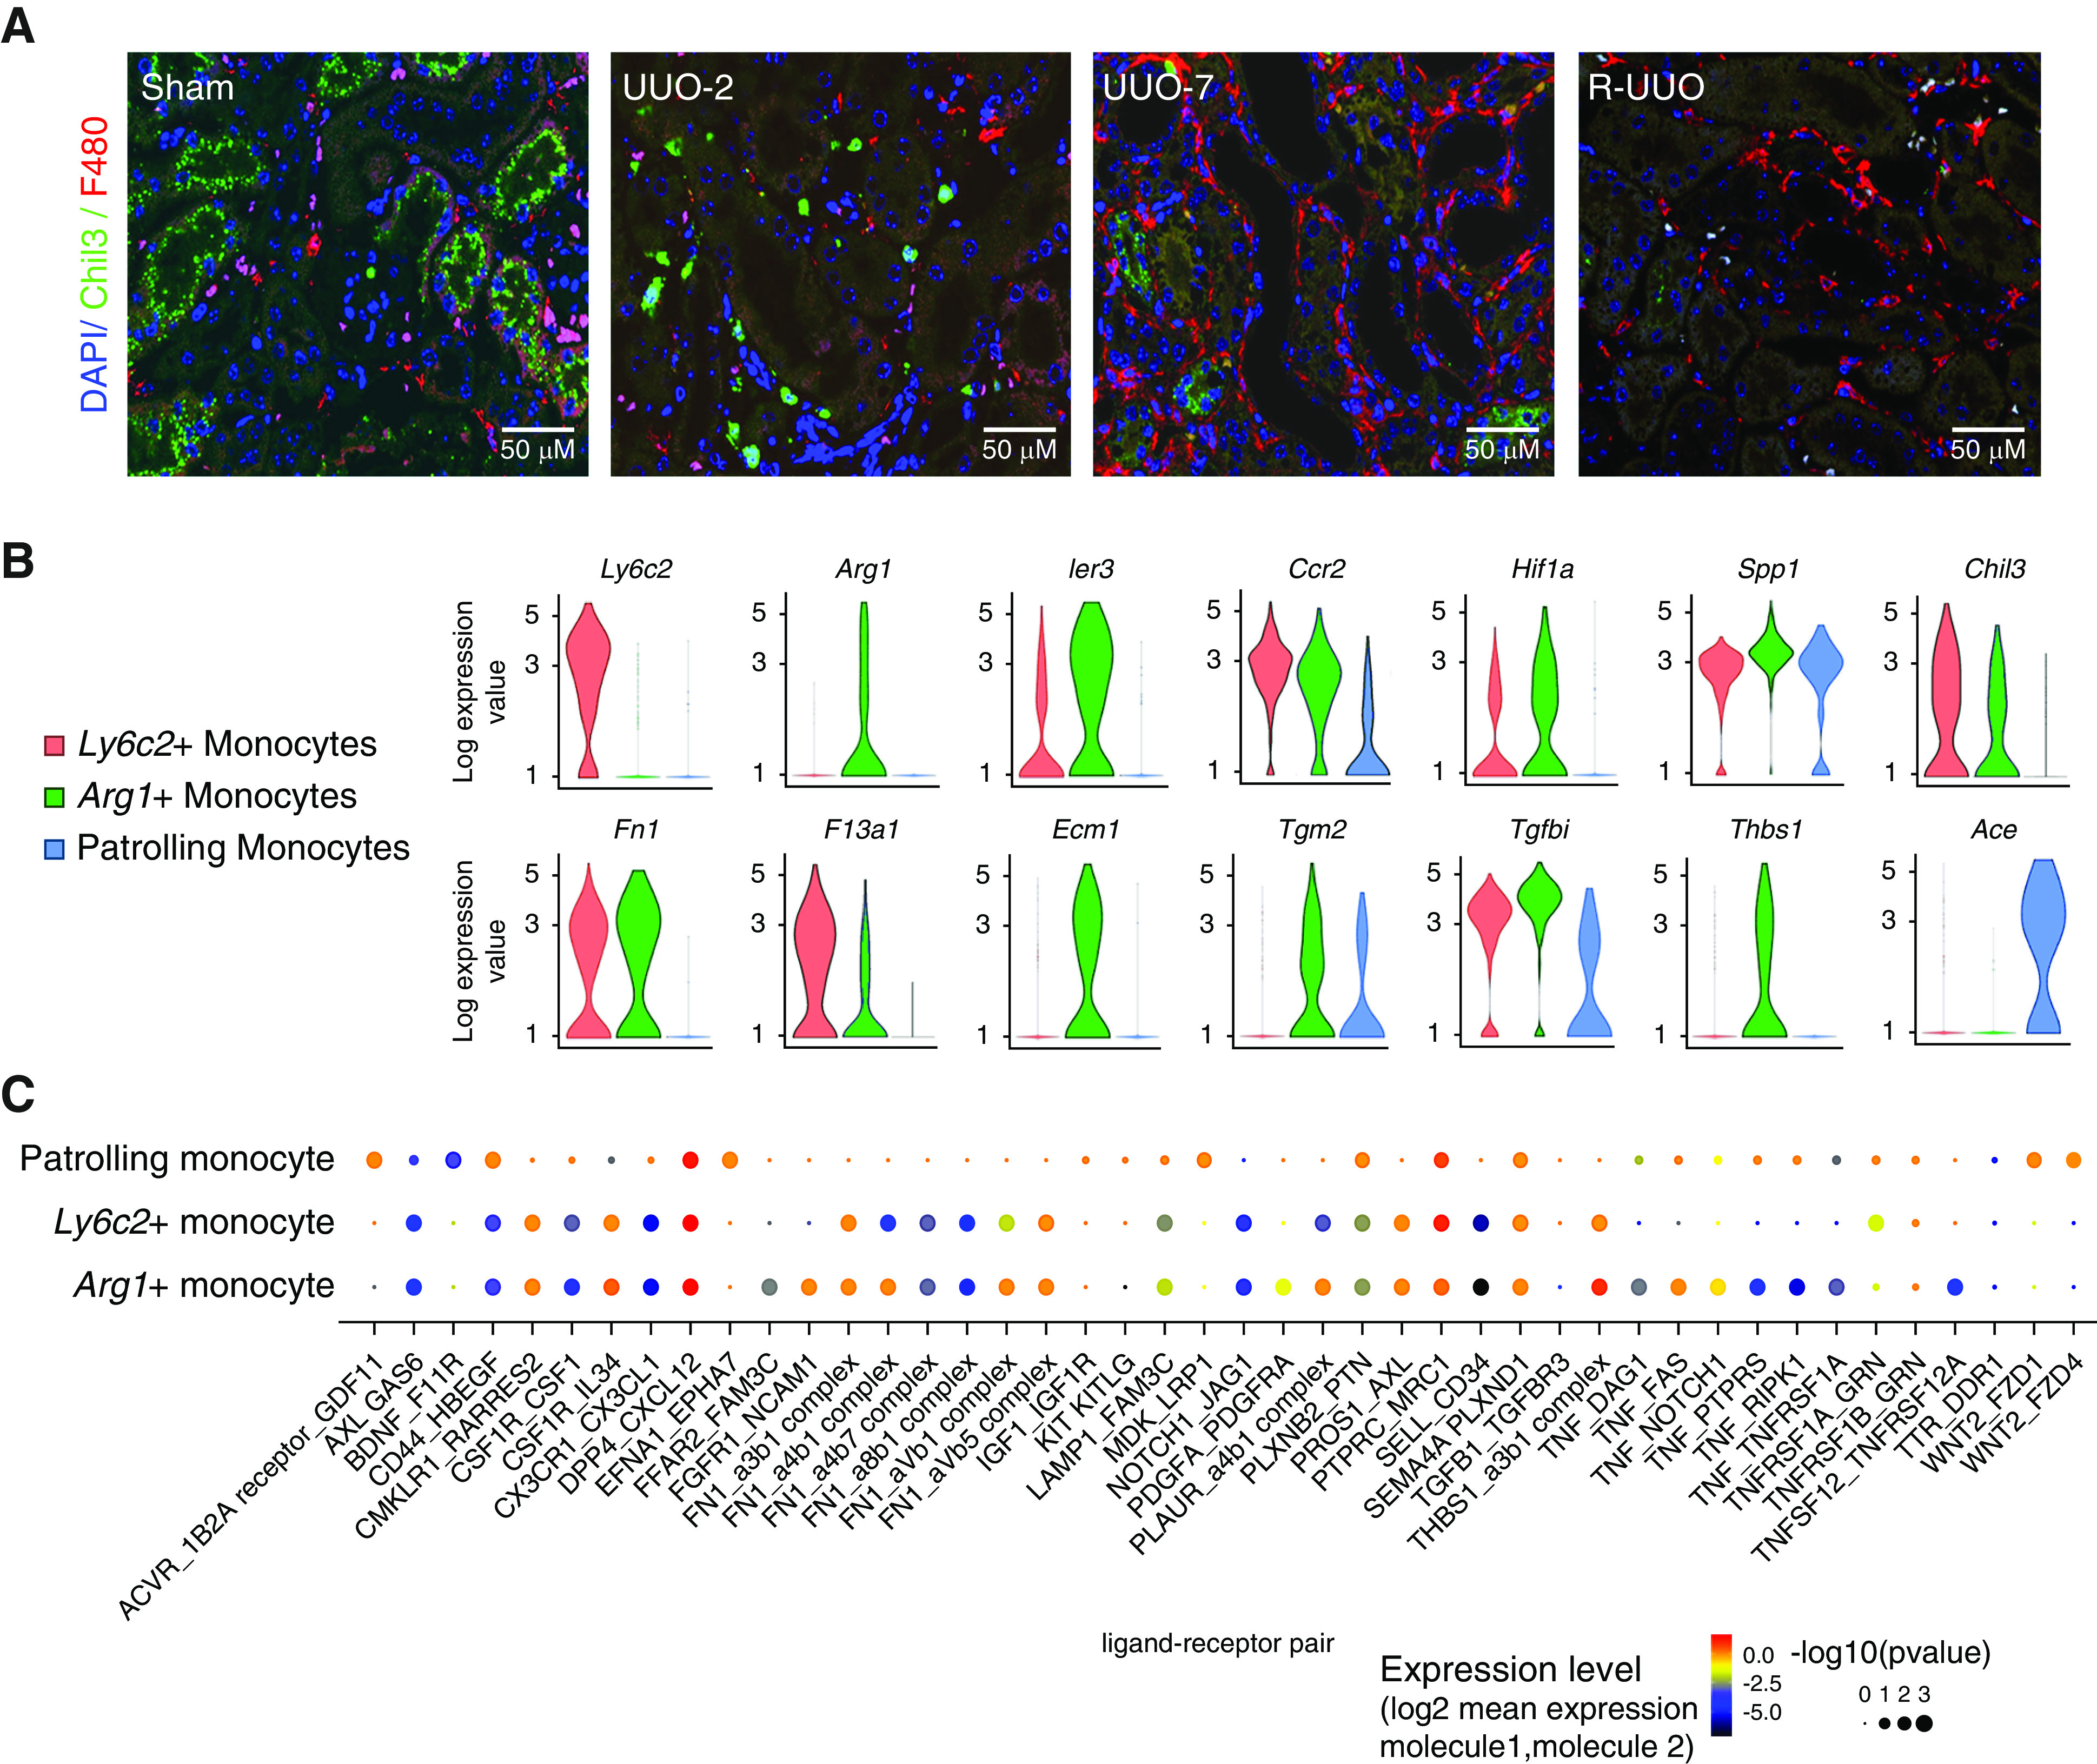
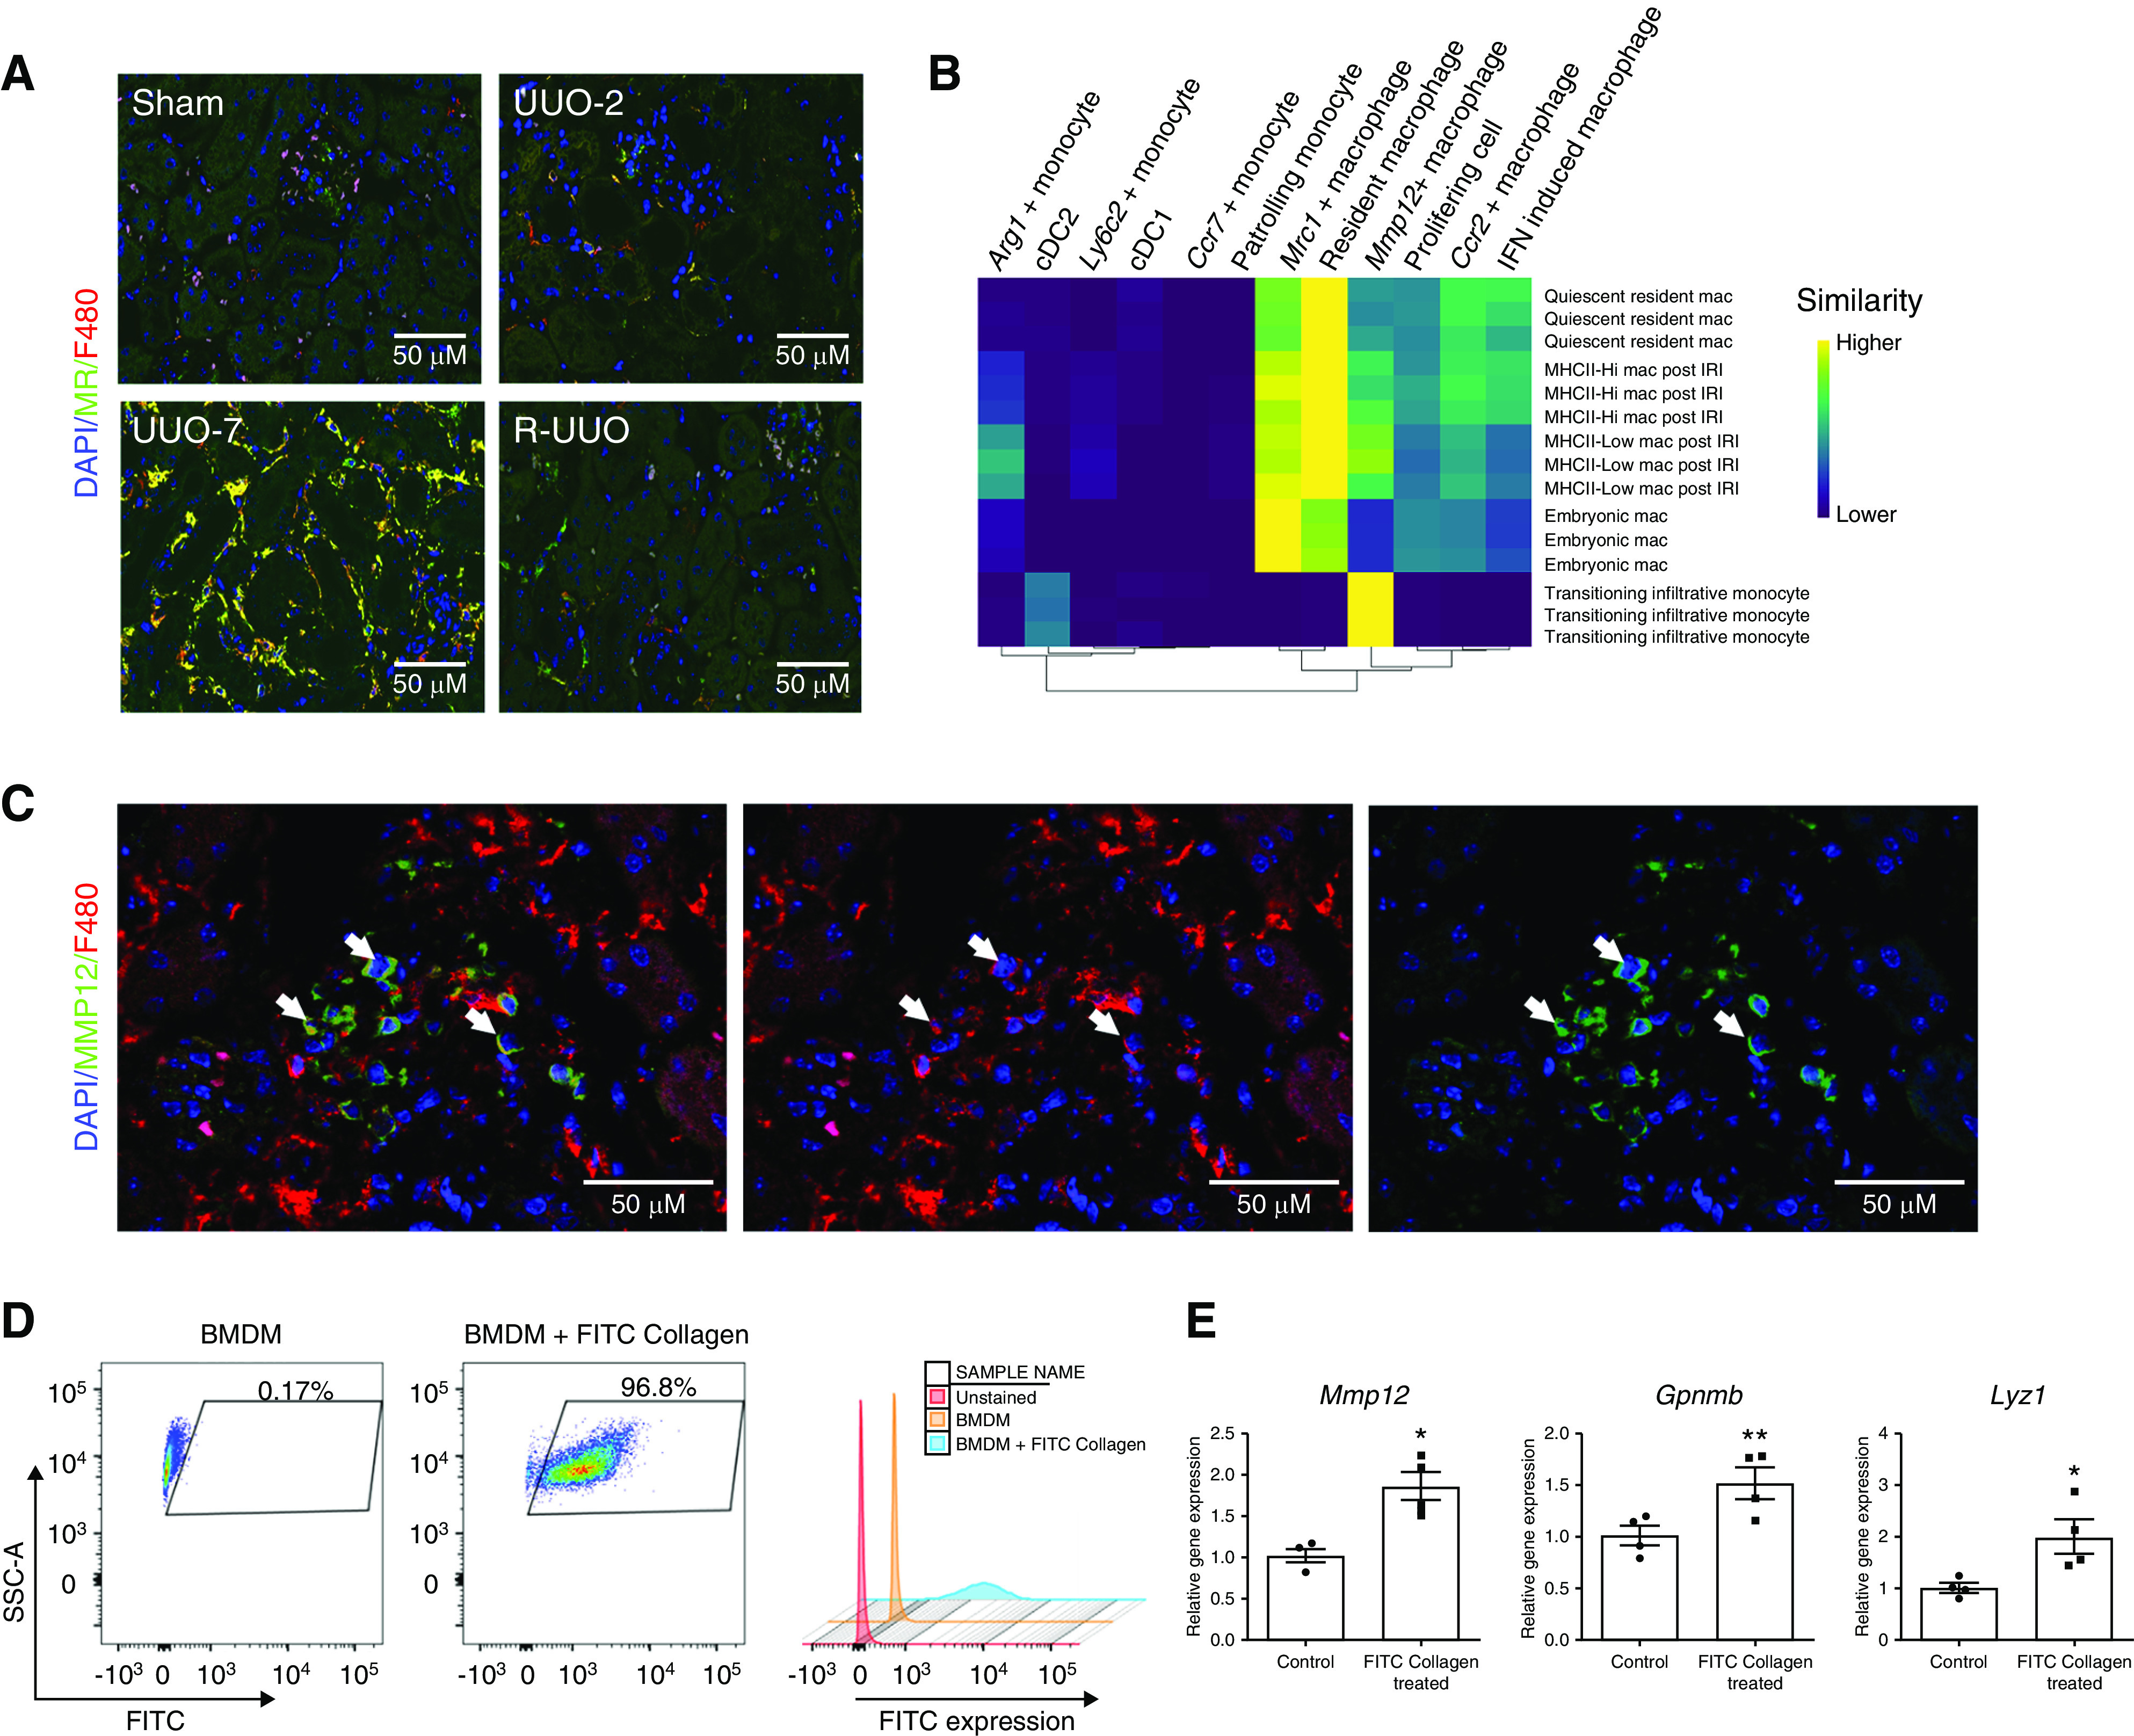
Results: A single-cell atlas of the kidney generated using transcriptomics revealed marked changes in the proportion and gene expression of renal cell types during injury and repair. Conventional flow cytometry markers would not have identified the 12 myeloid cell subsets. Monocytes recruited to the kidney early after injury rapidly adopt a proinflammatory, profibrotic phenotype that expresses Arg1, before transitioning to become Ccr2+ macrophages that accumulate in late injury. Conversely, a novel Mmp12+ macrophage subset acts during repair.

Conclusions: Complementary technologies identified novel myeloid subtypes, based on transcriptomics in single cells, that represent therapeutic targets to inhibit progression or promote regression of kidney disease.

Keywords: fibrosis; kidney disease; myeloid cells; scRNA sequencing.


Figures

None
Graphical abstract
Figure 1.
Figure 1.
Phases of progression and regression of fibrosis in the R-UUO model are associated with dynamic changes in the renal transcriptome. (A) Male 6- to 8-week-old C57BL/6J mice underwent either UUO or sham surgery, and were either euthanized 2 days later, or left obstructed for 7 days and then euthanized, or had their ureter reimplanted to reverse obstruction before euthanasia at 1, 2, or 4 weeks post UUO (n=6–8 per group). (B) Representative images and quantification of fibrosis (collagen III) and fibroblast (PDGFR-β), myofibroblast (α-smooth muscle actin [α-SMA]), or macrophage (F4/80) accumulation during the R-UUO model. Scale bar, 50 µM. ****P<0.0001 versus sham, #P<0.05 versus UUO, ##P<0.01 versus UUO, ###P<0.001, ####P<0.0001 versus UUO. (C) Unbiased clustering analysis of bulk RNA sequencing data from the renal cortex of mice (n=4 per group) during the R-UUO time course identified six discrete temporal patterns of gene expression. Representative genes and enriched pathways are provided for each cluster. The number of genes included in each cluster is as follows: Down-regulated 1562; Early injury, 779; Pan-injury, 1479; Late injury, 1619; Late injury/reversal, 1708; and Reversal specific, 663. Shaded error range is the SD of the mean scaled gene expression for each animal. Dark and light blue pathways are those demonstrating gene enrichment at a false discovery rate of <0.05 and >0.05, respectively. FDR, false discovery rate; IHC, immunohistochemistry; RT-qPCR, quantitative RT-PCR.
Figure 2.
Figure 2.
scRNA-seq analysis identifies discrete renal cell types, with dynamic changes in the proportion and transcriptome of each cell type observed across the R-UUO model. tSNE plots of 17,136 cells from libraries pooled from mice that underwent sham, UUO-2, UUO-7, or R-UUO (2 weeks) (n=3 per time point) classified by (A) cell cluster and (B) time point. (C) Expression of selected marker genes for each cell classification projected onto tSNE plot. Color scale is log10 expression levels of genes. (D) Relative proportions of cells assigned to each cluster by time point. Statistical significance derived using differential proportional analysis, with a mean error of 0.1 over 100,000 iterations. *P<0.05. (E) Violin plots of Egf and Lcn2 (encodes neutrophil gelatinase-associated lipocalin) gene expression in the loop of Henle/distal convoluted cell cluster. The y axis shows the log-scale normalized read count. a–c, PCT subclusters colored by shared nearest neighbor; DCT, distal convoluted tubule; LoH, loop of Henle; Mac, macrophage; Mono, monocyte; NK, natural killer cell; PCT, proximal convoluted tubule; S1, S1 segment.
Figure 3.
Figure 3.
scRNA-seq analysis identifies 12 discrete myeloid cell clusters, with dynamic changes in the proportion of cells assigned to each cluster across the R-UUO model. (A) tSNE plot of 2956 pooled myeloid cells from each time point, annotated by cell type and time point. (B) Top five ImmGen reference immune cell types correlating with each cluster, ranked by Spearman correlation coefficients after a cluster-to-references analysis using Cluster Identify Predictor version 2. (C) Violin plots showing the expression levels of selected marker genes in each cluster. The x axis shows the log-scale normalized read count. (D) Heatmap of selected marker gene expression in each cluster, calculated using Wilcoxon signed-rank test. The color scheme is based on z-score distribution. (E) Relative proportions of each cell type at each time point. Statistical significance tested using differential proportional analysis with a mean error of 0.1 over 100,000 iterations. *P<0.05. Mac, macrophage; mono, monocyte; IFN, interferon.
Figure 4.
Figure 4.
Monocytes recruited to the kidney at UUO-2 exhibit a pro-fibrotic phenotype that may activate mesenchymal cells. (A) Representative immunofluorescence images from each time point in the R-UUO model (sham, UUO-2, UUO-7, and R-UUO [2 weeks]) for Chil3 (marker of Ly6C+ monocytes, red) and the pan-macrophage marker F4/80 (green). (B) Violin plots showing log10 expression levels of selected genes in the three monocyte clusters. The y axis shows the log-scale normalized read count. (C) Significant monocyte ligand–mesenchymal receptor pairs across the three monocyte subclusters. Color of dot is proportional to mean expression values for all of the interacting partners, and size is inversely proportion to P value.
Figure 5.
Figure 5.
Mannose receptor (MR)+ F4/80Hi macrophages and MMP12+F4/80Lo cells are observed in late injury or specifically following reversal of obstruction, respectively. (A) Representative immunofluorescence images across the R-UUO time course (sham, UUO-2, UUO-7, and R-UUO [2 weeks]) for mannose receptor (MR, marker of Mrc1+ macrophages, green) and F4/80 (red). (B) Single R analysis comparing the transcriptome of the myeloid clusters with those of embryonic macrophages, adult macrophages before and after renal IRI, and infiltrating monocytes during repair of renal IRI. (C) Immunofluorescence images showing colocalisation of MMP12 (green) and F4/80 (red) in renal macrophages. (D) Flow cytometry plots of bone marrow–derived macrophages (BMDMs) demonstrating fluorescence after phagocytosis of FITC-collagen. (E) Expression of reparative macrophage genes measured by quantitative RT-PCR in BMDMs after phagocytosis of FITC-collagen versus BMDMs cultured in medium alone (control). n=4 replicates. *P<0.05, **P<0.01. Mac, macrophage.
Figure 6.
Figure 6.
Integration of droplet– and plate-based scRNA-seq datasets determines that clusters identified by scRNA-seq would not be readily discriminated on conventional flow cytometry. (A) Representative flow cytometry plots from kidney cell suspensions from each time point after gating on CD45+MacGreen+TCRβCD19Ly6GSiglec-F myeloid cells. Cells segregated into CD11b+F4/80Lo monocyte and CD11b+F4/80Hi macrophage gates. (B) Strategy to integrate gene and cell surface protein expression at the single-cell level. Kidneys were digested into single-cell suspensions and single CD45+MacGreen+TCR1βCD19Ly6GSiglec-F myeloid cells were sorted into individual wells after index linkage to cell surface marker expression. They underwent scRNA-seq using the SMART-seq2 protocol before integration with the 10× dataset. (C) Uniform Manifold Approximation and Projection (UMAP) of the combined 10× and SMART-seq2 dataset. (D) Dotplot of cell surface protein and corresponding gene expression in each cluster. The size of the dot denotes the percentage of cells in each cluster expressing the relevant gene/protein; the intensity of color represents mean gene/protein expression. (E) Representative flow cytometry plots from UUO-2, UUO-7, and R-UUO (2 weeks) illustrate mapping of cells from each myeloid cluster onto the CD11b+F4/80Lo monocyte and CD11b+F4/80Hi macrophage gates. (F) Mapping of proliferating cells (red) at each time point onto the flow cytometry plots. (G) Pseudotime analysis of the transcriptomes of the Ly6c2+, Arg1+, and Ccr2+ clusters. Mac, macrophage; mono, monocyte.
Figure 7.
Figure 7.
Paired blood exchange (PBE) demonstrates that CCR2+ macrophages observed at UUO-7 are derived from donor monocytes. (A) Schemata of experimental strategy for PBE to track fate of immune cells recruited to the kidney. One day after UUO, whole blood exchange was performed between pairs of C57BL/6 and Ly5.1 mice (n=4) and pairs were euthanized either 2 or 7 days after UUO. (B) Representative flow cytometry plots of circulating CD45+ cells from pairs of mice pre- and immediately post-blood exchange, illustrating approximately 40% of circulating cells were derived from donors after the exchange (CD45.1+CD45.2+ cells in C57BL/6; CD45.2+/+ cells in Ly5.1 mice). (C) Percentage of circulating immune cells derived from paired donor over the experimental time course (n=4 pairs immediately post-PBE and at UUO-2; n=2 pairs at UUO-7). (D) Illustrative flow cytometry plots mapping donor cells (red) and recipient cells (gray) to the CD11b+F4/80Lo monocyte and CD11b+F4/80Hi macrophage gates, the monocyte waterfall in obstructed and contralateral kidneys at 2 days post-UUO, and the expression of CCR2 and MHCII 7 days post-UUO. (E) Average number of donor cells mapping to the CD11b+F4/80Lo monocyte and CD11b+F4/80Hi macrophage gates in obstructed kidneys at 2 and 7 days after UUO. (F) The expression of CCR2 (mean fluorescent intensity, MFI) on the donor cells compared with the host cells from the CD11b+F4/80Hi macrophage gate in obstructed kidneys 7 days after UUO. n=4 per group. *P<0.05 by Mann–Whitney test.
Figure 8.
Figure 8.
Markers of murine myeloid subsets are also observed in human kidney disease. (A) Immunostaining for myeloid cluster–defining markers in human kidney tissue obtained from the Human Protein Atlas. (B) Gene expression of cluster-defining markers for DCs (left), monocytes (center), and macrophages (right) against COL1A1 gene expression in the tubulointerstitium of kidneys from healthy controls (n=9), patients with diabetic nephropathy (n=10), and patients with FSGS (n=18). Data obtained from www.Nephroseq.org.

References

    1. Mills KT, Xu Y, Zhang W, Bundy JD, Chen CS, Kelly TN, et al. .: A systematic analysis of worldwide population-based data on the global burden of chronic kidney disease in 2010. Kidney Int 88: 950–957, 2015. - PMC - PubMed
    1. Astor BC, Matsushita K, Gansevoort RT, van der Velde M, Woodward M, Levey AS, et al. .: Chronic Kidney Disease Prognosis Consortium : Lower estimated glomerular filtration rate and higher albuminuria are associated with mortality and end-stage renal disease. A collaborative meta-analysis of kidney disease population cohorts. Kidney Int 79: 1331–1340, 2011. - PMC - PubMed
    1. Chen TK, Knicely DH, Grams ME: Chronic kidney disease diagnosis and management: A review. JAMA 322: 1294–1304, 2019. - PMC - PubMed
    1. Go AS, Chertow GM, Fan D, McCulloch CE, Hsu CY: Chronic kidney disease and the risks of death, cardiovascular events, and hospitalization. N Engl J Med 351: 1296–1305, 2004. - PubMed
    1. Hu B, Gadegbeku C, Lipkowitz MS, Rostand S, Lewis J, Wright JT, et al. .: African-American Study of Kidney Disease and Hypertension Group : Kidney function can improve in patients with hypertensive CKD. J Am Soc Nephrol 23: 706–713, 2012. - PMC - PubMed

Publication types