. 2020 Sep 25;11(1):4879.
doi: 10.1038/s41467-020-18008-4.

A machine learning Automated Recommendation Tool for synthetic biology

Affiliations

A machine learning Automated Recommendation Tool for synthetic biology

Tijana Radivojević et al. Nat Commun. .

Abstract

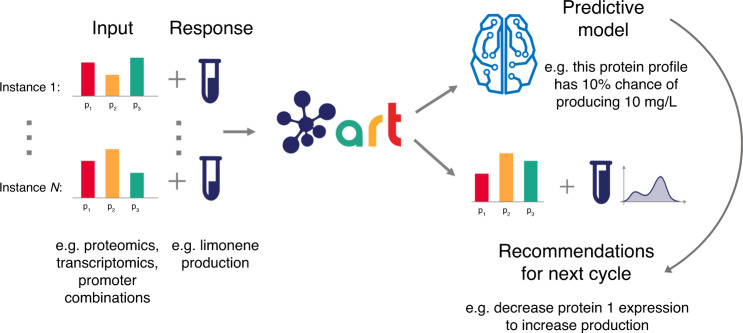
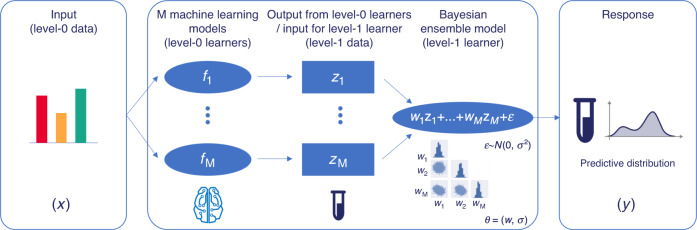
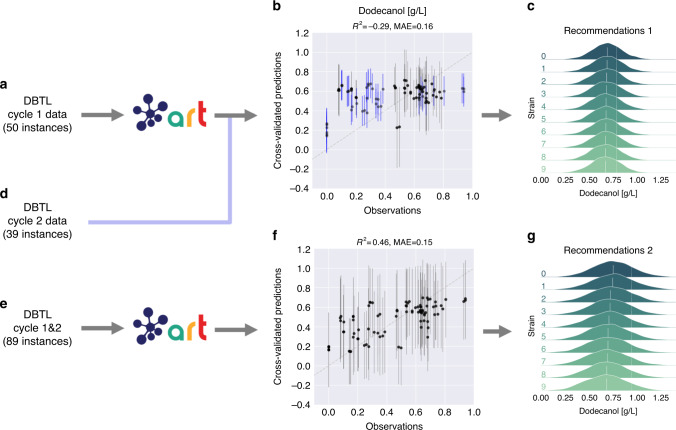
Synthetic biology allows us to bioengineer cells to synthesize novel valuable molecules such as renewable biofuels or anticancer drugs. However, traditional synthetic biology approaches involve ad-hoc engineering practices, which lead to long development times. Here, we present the Automated Recommendation Tool (ART), a tool that leverages machine learning and probabilistic modeling techniques to guide synthetic biology in a systematic fashion, without the need for a full mechanistic understanding of the biological system. Using sampling-based optimization, ART provides a set of recommended strains to be built in the next engineering cycle, alongside probabilistic predictions of their production levels. We demonstrate the capabilities of ART on simulated data sets, as well as experimental data from real metabolic engineering projects producing renewable biofuels, hoppy flavored beer without hops, fatty acids, and tryptophan. Finally, we discuss the limitations of this approach, and the practical consequences of the underlying assumptions failing.


Conflict of interest statement

The authors declare no competing interests.

Figures

Fig. 1
Fig. 1. ART provides predictions and recommendations for the next cycle.
ART uses experimental data (input and responses in the left side) to (i) build a probabilistic predictive model that predicts response (e.g., production) from input variables (e.g., proteomics), and (ii) uses this model to provide a set of recommended inputs for the next experiment (new input) that will help reach the desired goal (e.g., increase response/production). The input phase space, in this case, is composed of all the possible combinations of protein expression levels (or transcription levels, promoters,... for other cases). The predicted response for the recommended inputs is characterized as a full probability distribution, effectively quantifying prediction uncertainty. Instances refer to each of the different examples of input and response used to train the algorithm (e.g., each of the different strains and/or conditions, that lead to different production levels because of different proteomics profiles). See Fig. 2 for details on the predictive model and Fig. 3 for details on the recommendation strategy. An example of the output can be found in Supplementary Fig. 5.
Fig. 2
Fig. 2. ART provides a probabilistic predictive model of the response.
ART combines several machine learning models from the scikit-learn library with a Bayesian approach to predict the probability distribution of the output. The input to ART is proteomics data (or any other input data in vector format: transcriptomics, gene copy, etc.), which we call level-0 data. This level-0 data is used as input for a variety of machine learning models from the scikit-learn library (level-0 learners) that produce a prediction of production for each model (zi). These predictions (level-1 data) are used as input for the Bayesian ensemble model (level-1 learner), which weights these predictions differently depending on its ability to predict the training data. The weights wi and the variance σ are characterized through probability distributions, giving rise to a final prediction in the form of a full probability distribution of response levels. This probabilistic model is the “Predictive model” depicted in Fig. 1.
Fig. 3
Fig. 3. ART chooses recommendations by sampling the modes of a surrogate function.
The true response y (e.g., biofuel production to be optimized) is shown as a function of the input x (e.g., proteomics data), as well as the expected response E(y) after several DBTL cycles (a), and its 95% confidence interval (blue). Depending on whether we prefer to explore (c) the phase space where the model is least accurate or exploit (b) the predictive model to obtain the highest possible predicted responses, we will seek to optimize a surrogate function G(x) (Eq. (5)), where the exploitation-exploration parameter is α = 0 (pure exploitation), α = 1 (pure exploration) or anything in between. Parallel-tempering-based MCMC sampling (d) produces sets of vectors x (colored dots) for different “temperatures”: higher temperatures (red) explore the full phase space, while lower temperature chains (blue) concentrate in the nodes (optima) of G(x). The exchange between different “temperatures” provides more efficient sampling without getting trapped in local optima. Final recommendations (upward-pointing blue arrows) to improve response are provided from the lowest temperature chain, and chosen such that they are not too close to each other and to experimental data (at least 20% difference). These recommendations are the “Recommendations for next cycle” depicted in Fig. 1. In this example, they represent protein expression levels that should be targeted to achieve predicted production levels. See Fig. 7 for an example of recommended protein profiles and their experimental tests.
Fig. 4
Fig. 4. Synthetic data test functions for ART.
These functions present different levels of difficulty to being “learnt”, and are used to produce synthetic data and test ART’s performance (Fig. 5). a FE(x)=1did(xi5)2+expixi2+25; b FM(x)=1didxi416xi2+5xi; c FD(x)=idxisin(xi).
Fig. 5
Fig. 5. ART performance improves significantly beyond the usual two DBTL cycles.
Here we show the results of testing ART’s performance with synthetic data obtained from functions of different levels of complexity (Fig. 4), different phase space dimensions (2, 10, and 50), and different amounts of training data (DBTL cycles). The top row presents the results of the simulated metabolic engineering in terms of highest production achieved so far for each cycle (as well as the corresponding ART predictions). The production increases monotonically with a rate that decreases as the problem is harder to learn, and the dimensionality increases. The bottom row shows the uncertainty in ART’s production prediction, given by the standard deviation of the response distribution (Eq. (2)). This uncertainty decreases markedly with the number of DBTL cycles, except for the highest number of dimensions. In each plot, lines and shaded areas represent the estimated mean values and 95% confidence intervals, respectively, over ten repeated runs. Mean Absolute Error (MAE) and training and test set definitions can be found in Supplementary Fig. 4.
Fig. 6
Fig. 6. ART provides effective recommendations to improve biofuel production.
We used the first DBTL cycle data (a) to train ART and recommend new protein targets with predicted production (c). The ART recommendations were very similar to the protein profiles that eventually led to a 40% increase in production (Fig. 7). ART predicts mean production levels for the second DBTL cycle strains (d), which are very close to the experimentally measured values (three blue points in b). Adding those three points from DBTL cycle 2 provides a total of 30 strains for training (e) that lead to recommendations predicted to exhibit higher production and narrower distributions (g). Uncertainty for predictions is shown as probability distributions for recommendations (c, g) and violin plots for the cross-validated predictions (b, f). The cross-validation graphs (present in Figs. 8, 9 and Supplementary Figs. 8, 9, too) represent an effective way of visualizing prediction accuracy for data the algorithm has not yet seen. The closer the points are to the diagonal line (predictions matching observations) the more accurate the model. The training data are randomly subsampled into partitions, each of which is used to validate the model trained with the rest of the data. The black points and the violins represent the mean values and the uncertainty in predictions, respectively. R2 and mean absolute error (MAE) values are only for cross-validated mean predictions (black data points).
Fig. 7
Fig. 7. All algorithms point similarly to improve limonene production, despite quantitative differences.
Cross sizes indicate experimentally measured limonene production in the proteomics phase space (first two principal components shown from principal component analysis, PCA). The color heatmap indicates the limonene production predicted by a set of base regressors and the final ensemble model (top left) that leverages all the models and conforms the base algorithm used by ART. Although the models differ significantly in the actual quantitative predictions of production, the same qualitative trends can be seen in all models (i.e., explore upper right quadrant for higher production), justifying the ensemble approach used by ART. The ART recommendations (green) are very close to the protein profiles from the PCAP paper (red), which were experimentally tested to improve production by 40%. Hence, we see that ART can successfully guide the bioengineering process even in the absence of quantitatively accurate predictions.
Fig. 8
Fig. 8. ART produces effective recommendations to bioengineer yeast to produce hoppy beer.
The 19 instances in the first DBTL cycle (a) were used to train ART, but it did not show an impressive predictive power (particularly for L (b)). In spite of it, ART is still able to recommend protein profiles predicted to reach the Pale Ale (PA) target flavor profile, and others that were close to the Torpedo (T) metabolite profile (c green points showing mean predictions). Adding the 31 strains for the second DBTL cycle (d, e) improves predictions for G but not for L (f). The expanded range of values for G & L provided by cycle 2 allows ART to recommend profiles which are predicted to reach targets for both beers (g), but not Hop Hunter (HH). Hop Hunter displays a very different metabolite profile from the other beers, well beyond the range of experimentally explored values of G and L, making it impossible for ART to extrapolate that far. Notice that none of the experimental data (red crosses) matched exactly the desired targets (black symbols), but the closest ones were considered acceptable. R2 and mean absolute error (MAE) values are for cross-validated mean predictions (black data points) only. Bars indicate 95% credible interval of the predictive posterior distribution.
Fig. 9
Fig. 9. ART’s predictive power is heavily compromised in the dodecanol case.
Although the 50 instances available for cycle 1 of pathway 1 (a) almost double the 27 available instances for the limonene case (Fig. 6), the predictive power of ART is heavily compromised (R2 = −0.29 for cross-validation, b) by the scarcity of data and, we hypothesize, the strong tie of the pathway to host metabolism (fatty acid production). The poor predictions for the test data from cycle 2 (in blue) confirm the lack of predictive power. Adding data from both cycles (d, e) improves predictions notably (f). These data and model refer to the first pathway in Fig. 1B from ref. . The cases for the other two pathways produce similar conclusions (Supplementary Figs. 8 and 9). Recommendations provided in panels c and g. R2 and mean absolute error (MAE) values are only for cross-validated mean predictions (black data points). Bars indicate 95% credible interval of the predictive posterior distribution.

References

    1. Stephanopoulos G. Metabolic fluxes and metabolic engineering. Metab. Eng. 1999;1:1–11. - PubMed
    1. Beller HR, Lee TS, Katz L. Natural products as biofuels and bio-based chemicals: fatty acids and isoprenoids. Nat. Prod. Rep. 2015;32:1508–1526. - PubMed
    1. Chubukov V, Mukhopadhyay A, Petzold CJ, Keasling JD, Martín HG. Synthetic and systems biology for microbial production of commodity chemicals. npj Syst. Biol. Appl. 2016;2:16009. - PMC - PubMed
    1. Ajikumar PK, et al. Isoprenoid pathway optimization for Taxol precursor overproduction in Escherichia coli. Science. 2010;330:70–74. - PMC - PubMed
    1. Cann, O. These are the top 10 emerging technologies of 2016. World Economic Forum website https://www.weforum.org/agenda/2016/06/top-10-emerging-technologies-2016 (2016).

Publication types