. 2020 Sep 25;10(1):15748.
doi: 10.1038/s41598-020-72719-8.

The tetraspanin CD151 marks a unique population of activated human T cells

Affiliations

The tetraspanin CD151 marks a unique population of activated human T cells

Mildred D Perez et al. Sci Rep. .

Abstract

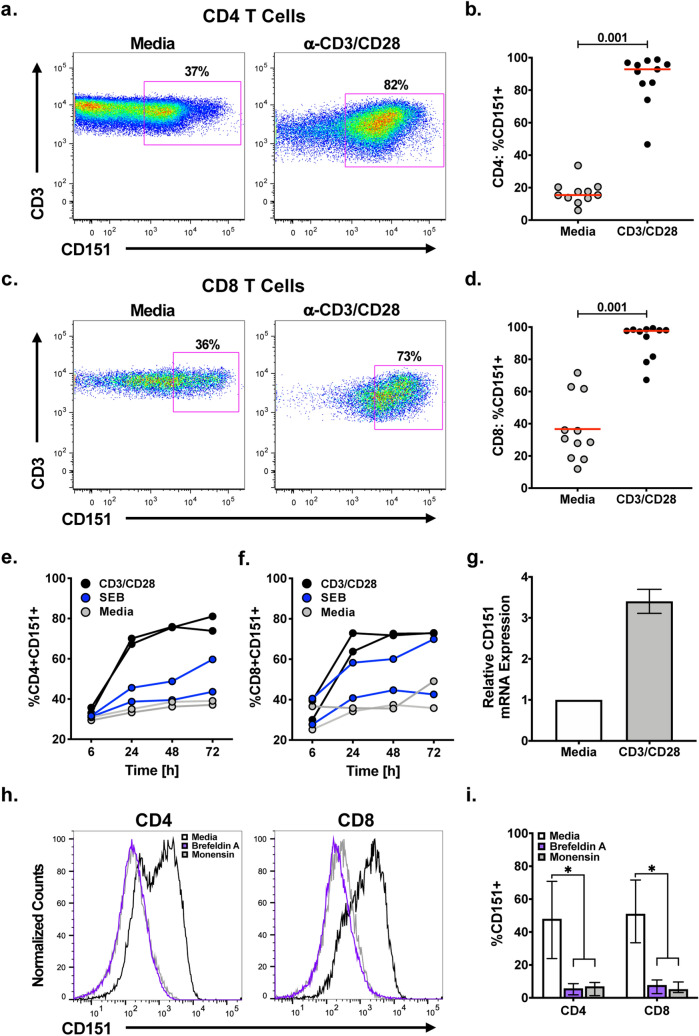
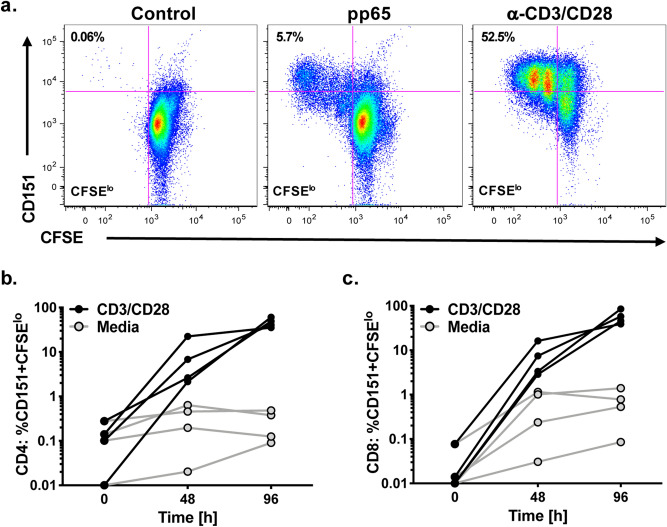
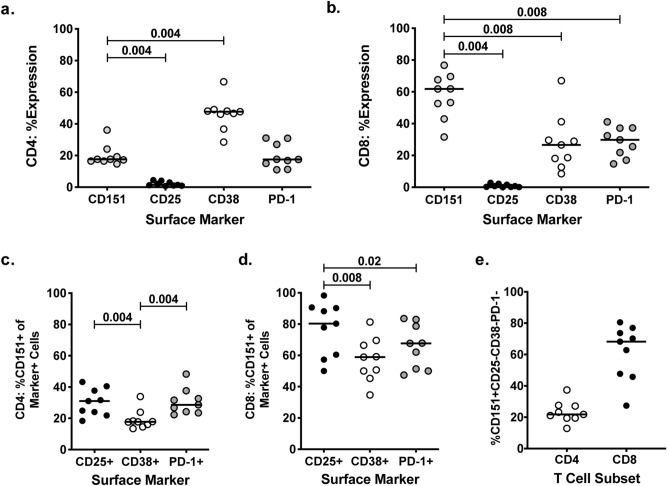
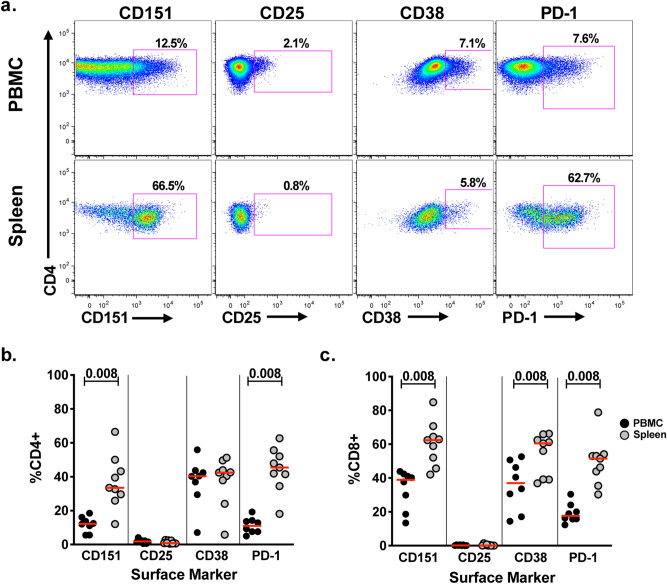
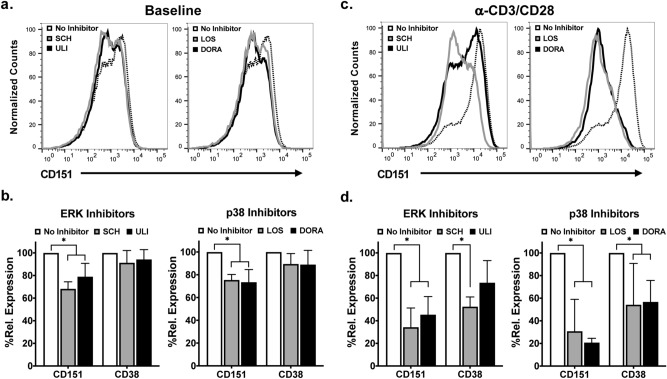
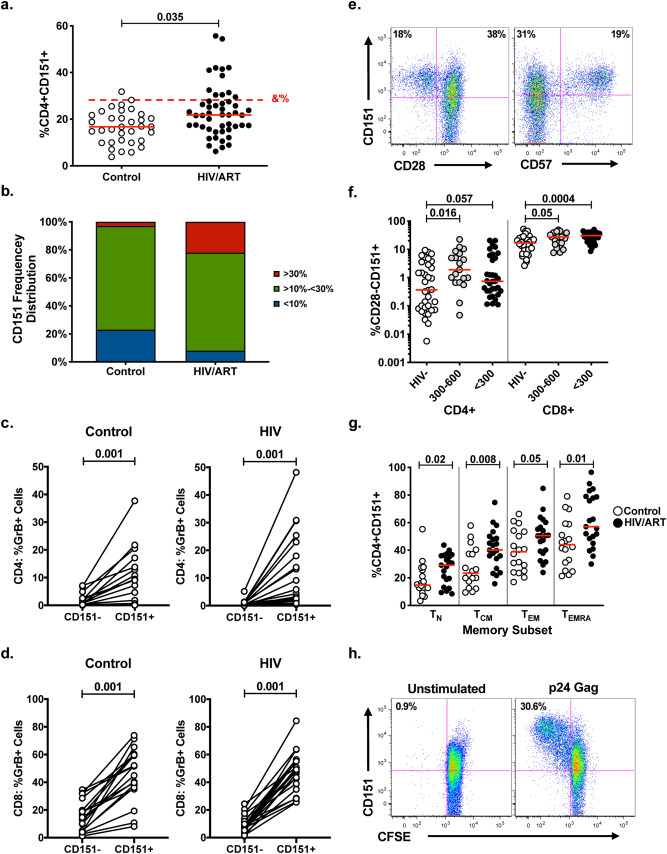
Tetraspanins are a family of proteins with an array of functions that are well studied in cancer biology, but their importance in immunology is underappreciated. Here we establish the tetraspanin CD151 as a unique marker of T-cell activation and, in extension, an indicator of elevated, systemic T-cell activity. Baseline CD151 expression found on a subset of T-cells was indicative of increased activation of the MAPK pathway. Following TCR/CD3 activation, CD151 expression was upregulated on the overall T-cell population, a quintessential feature of an activation marker. CD151+ T-cell frequencies in the spleen, an organ with increased immune activity, were twice as high as in paired peripheral blood samples. This CD151+ T-cell frequency increase was not paralleled by an increase of CD25 or CD38, demonstrating that CD151 expression is regulated independently of other T-cell activation markers. CD151+ T-cells were also more likely to express preformed granzyme B, suggesting that CD151+ T cells are pro-inflammatory. To this end, HIV-1 patients on antiretroviral therapy who are reported to exhibit chronically elevated levels of immune activity, had significantly higher CD4+CD151+ T-cell frequencies than healthy controls, raising the possibility that proinflammatory CD151+ T cells could contribute to the premature immunological aging phenotype observed in these patients.


Conflict of interest statement

The authors declare no competing interests.

Figures

Figure 1
Figure 1
CD151 expression is upregulated on T cells following TCR activation. CD151 expression on CD4+ and CD8+ T cells in PBMCs was determined at baseline or following activation with an anti-CD3/CD28 mAb combination (OKT3/CD28.2) using flow cytometric analysis. Representative flow plots for (a) CD4+ and (c) CD8+ T cells showing the increase in the CD151 expression frequency following stimulation. The percentage of CD151+ (b) CD4+ and (d) CD8+ T cells in the peripheral blood of 11 healthy individuals at baseline (gray circles) and on day 4 following stimulation with an anti-CD3/CD28 mAb combination (black circles) presented as a beeswarm plot. The red lines represent the median values. PBMC from 2 healthy volunteers were stimulated with anti-CD3/CD28 mAb (black line) or with SEB (blue line), and CD151 expression was determined on (e) CD4+ T cells and (f) CD8+ T cells over a period of 72 h. CD151 expression on unstimulated cells is depicted by gray circles. (g) Twenty-four hours after anti-CD3/CD28 mAb stimulation, the increase in relative CD151 mRNA expression in CD4+ T cells was measured using qRT-PCR. (h) Representative histograms of PBMC stimulated with anti-CD3/CD28 mAb and treated with brefeldin A (purple line) or monensin (gray line) after 6 h to block cell surface transport of newly synthesized proteins. CD151 expression was then determined 24 h post activation. The black histograms represent stimulated cultures with no transport inhibitor treatment. (i) CD4+CD151 + and CD8+CD151+ T cell frequencies in PBMCs from six donors 24 h post anti-CD3/CD28 stimulation cultured in either the absence or presence of brefeldin A or monensin treatment.
Figure 2
Figure 2
CD151 expression as a function of T cell proliferation. (a) CFSE-labeled PBMCs were stimulated with either a CMV pp65 antigen peptide library or anti-CD3/CD28 mAbs. Four days post stimulation, cell proliferation was determined as the reduction of the CFSE signal in relation to the regulation of CD151 expression using flow cytometric analysis. Flow plots show CD151 expression on proliferating CD4+ T cells (CFSElo) and non-proliferating CD4+ T cells. The depicted experiment is representative for four tested donors. PBMC from four healthy individuals were stimulated with anti-CD3/CD28 mAb (black lines) or left unstimulated (media, gray lines) for various lengths of time and the expression of CD151 on proliferating cells (CFSElo) was determined for (b) CD4+ T cells and (c) CD8+ T cells. Unstimulated cells served the negative controls.
Figure 3
Figure 3
CD151 expression on CD4+ and CD8+ T cells in relation to established T cell activation markers. PBMC from 9 healthy individuals were co-stained for CD151 and the established T cell activation markers CD25, CD38 and PD-1. Beeswarm plots show the expression frequency of CD151, CD25, CD38 and PD-1 on (a) CD4+ T cells and (b) CD8+ T cells. Percentage of CD25+, CD38+ and PD1+ (c) CD4+ T cells and (d) CD8+ T cells that also expressed CD151. (e) The frequency CD4+ and CD8+ T cells that expressed CD151 and not CD25, CD38, or PD-1. Median values are shown as black lines.
Figure 4
Figure 4
Increased CD151 expression frequency on human splenocytes. (a) PBMCs and matched splenocytes from 8 organ donors were analyzed for the expression of CD151, CD25, CD38 and PD-1 using flow cytometric analysis. Representative flow plots showing the expression of the various markers on CD3+CD4+ T cells from paired PBMCs and splenocytes. The frequency of CD151+, CD25+, CD38+ and PD1+ (b) CD4+ T cells and (c) CD8+ T cells in the peripheral blood and in splenocytes is depicted as a beeswarm plot. Median values are shown as red lines.
Figure 5
Figure 5
Effect of ERK and p38 pathway inhibition on CD151 expression in CD4+ T cells. PBMCs from four healthy individuals were treated with the ERK inhibitors (Ulixertinib, ULI or SCH772984, SCH), the p38 inhibitors (Losmapimod, LOS or Doramapimod, DORA), or DMSO as control, and 3 days post treatment analyzed for the expression of CD151 and CD38 using flow cytometric analysis. (a) Representative flow cytometry histogram plots showing the expression of CD151. (b) The effect of each inhibitor on baseline CD151 expression levels in comparison to the inhibitor effect on CD38 expression as determined for four individuals. (c) Representative flow cytometry histogram plots showing the expression of CD151 following anti-CD3/CD28 mAb stimulation in the absence or presence of the indicated inhibitors. (d) The effect of each inhibitor on activation-induced CD151 expression levels analyzed for the expression of CD151 and CD38 using flow cytometric analysis for CD4+ T cells. Due to extensive donor variation regarding CD151 expression levels (baseline MFI range 216–875) data are represented as relative MFI normalized for the CD151 baseline expression in untreated cells.
Figure 6
Figure 6
Increased CD4+CD151+ T cell frequencies in the peripheral blood of HIV-1 patients on fully suppressive ART. (a) Beeswarm plots describing the frequencies of CD4+CD151+ T cells from healthy donors (controls), and HIV-seropositive individuals on ART (HIV/ART). Red lines indicate median frequencies. The 95% interval for the normal distribution of CD151+ T cell frequencies in healthy donors (95% reference range) was calculated and is indicated as a red dotted line. (b) The bar graphs show the distribution of individuals based on their CD4+CD151+ T cell frequencies into groups with < 10% CD4+CD151+ T cells (blue), between 10%-30% (green) and > 30% (red), in healthy controls and HIV/ART patients. The frequency of CD151- and CD151+Cells in healthy and HIV/ART patients with preformed Granzyme B for (c) CD4+ T cells and (d) CD8+ T cells. (e) CD151+ T cell expression in relation to CD28 or CD57 expression on CD4+ T cells from HIV/ART patients. Numbers indicate the percentage of cells within each quadrant. (f) Relative contribution of the CD28− T cell population to the total CD151+ T cell population in healthy controls and HIV/ART patients with CD4+ T cells counts between 300 and 600 or < 300 cells/mm3. (g) Comparison of the frequency of CD4+CD151+ T cells as a function of the memory differentiation state between healthy control individuals (open symbols) and HIV/ART patients (closed symbols). T cell subsets were defined by patterns of CD45RA and CCR7 expression: Naïve T cells (TN: CD45RA+CCR7+), central memory T cells (TCM: CD45RA–CCR7+), effector memory T cells (TEM: CD45RA CCR7) and T effector memory RA-positive cells (TEMRA: CD45RA+CCR7–). Median values are depicted by red lines. (h) CFSE-labeled PBMCs from a HIV-seropositive individual were stimulated with overlapping Gag peptides for 4 days and increased CD151 expression on proliferating Gag-specific T cells was quantified using flow cytometric analysis. Unstimulated cells served as the negative control.

Similar articles

Cited by

References

    1. Berditchevski F. Complexes of tetraspanins with integrins: More than meets the eye. J. Cell Sci. 2001;114:4143–4151. - PubMed
    1. Berditchevski F, Odintsova E. Tetraspanins as regulators of protein trafficking. Traffic. 2007;8:89–96. doi: 10.1111/j.1600-0854.2006.00515.x. - DOI - PubMed
    1. Hemler ME. Tetraspanin functions and associated microdomains. Nat. Rev. Mol. Cell Biol. 2005;6:801–811. doi: 10.1038/nrm1736. - DOI - PubMed
    1. Tarrant JM, Robb L, van Spriel AB, Wright MD. Tetraspanins: Molecular organisers of the leukocyte surface. Trends Immunol. 2003;24:610–617. doi: 10.1016/j.it.2003.09.011. - DOI - PubMed
    1. Wright MD, Moseley GW, van Spriel AB. Tetraspanin microdomains in immune cell signalling and malignant disease. Tissue Antigens. 2004;64:533–542. doi: 10.1111/j.1399-0039.2004.00321.x. - DOI - PubMed

Publication types