. 2021 Mar;19(3):738-752.
doi: 10.1111/jth.15110. Epub 2021 Feb 5.

Hydrogen sulfide-loaded microbubbles combined with ultrasound mediate thrombolysis and simultaneously mitigate ischemia-reperfusion injury in a rat hindlimb model

Affiliations

Hydrogen sulfide-loaded microbubbles combined with ultrasound mediate thrombolysis and simultaneously mitigate ischemia-reperfusion injury in a rat hindlimb model

Jiayuan Zhong et al. J Thromb Haemost. 2021 Mar.

Abstract

Background: Thromboembolism and subsequent ischemia/reperfusion injury (IRI) remain major clinical challenges.

Objectives: To investigate whether hydrogen sulfide (H2 S)-loaded microbubbles (hs-Mbs) combined with ultrasound (US) radiation (hs-Mbs+US) dissolve thrombi and simultaneously alleviate tissue IRI through local H2 S release.

Methods: hs-Mbs were manufactured and US-triggered H2 S release was recorded. White and red thromboembolisms were established ex vivo and in rats left iliac artery. All subjects randomly received control, US, Mbs+US, or hs-Mbs+US treatment for 30 minutes.

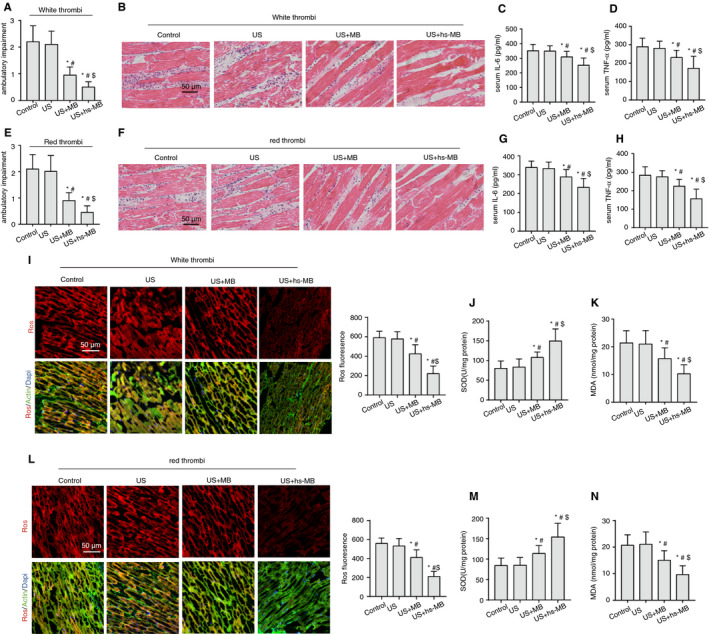
Results: H2 S was released from hs-Mbs+US both ex vivo and in vivo. Compared with control and US, hs-Mbs+US and Mbs+US showed comparable substantial decreases in thrombotic area, clot mass, and flow velocity increases for both ex vivo macrothrombi. In vivo, hs-Mbs+US and Mbs+US caused similarly increased recanalization rates, blood flow velocities, and hindlimb perfusion for both thrombi compared with the other treatments, with no obvious influence on hemodynamics, respiration, and macrophage vitality. More importantly, hs-Mbs+US substantially alleviated skeletal muscle IRI by reducing reactive oxygen species, cellular apoptosis, and proapoptotic Bax, caspase-3, and caspase-9 and increasing antiapoptotic Bcl-2 compared with other treatments. In vitro, hypoxia/reoxygenation-predisposed skeletal muscle cells and endothelial cells treated with normal saline solution exhibited similar trends, which were largely reversed by an H2 S scavenger or an inhibitor of Akt phosphorylation.

Conclusion: hs-Mbs+US effectively dissolved both white and red macrothrombi and simultaneously alleviated skeletal muscle IRI through the US-triggered, organ-specific release of H2 S. This integrated therapeutic strategy holds promise for treating thromboembolic diseases and subsequent IRI.

Keywords: hydrogen sulfide; ischemia/reperfusion injury; microbubbles; thrombolysis; ultrasound.


Conflict of interest statement

The manuscript has been read and approved for submission by all authors. They declare no conflicts of interest.

Figures

FIGURE 1
FIGURE 1
Ultrasound‐triggered H2S release from hs‐Mbs to tissues. (A) H2S content in various tissues in nonthromboembolized rats immediately after US+hs‐MB treatment (n = 3). *P < .05 vs control; #P < .05 vs hs‐MB.H2S content in hindlimb skeletal muscle immediately after treatments in (B) white and (C) red left iliac artery‐thromboembolized rats (n = 6). *P < .05 vs control; #P < .05 vs US+MB. Representative (D) pictures and (E) quantification of L6 cell sections stained with TUNEL. (F) Evaluation of cellular apoptosis by Comp‐FITC‐A/Comp‐PI A double staining and flow cytometry. (G) Quantification. *P < .05 vs 0 μmol/L NaHS; #P < .05 vs 10 μmol/L NaHS; $P < .05 vs 30 μmol/L NaHS; &P < .05 vs 50 μmol/L NaHS. Control, saline infusion; hs‐MB, microbubble loaded with hydrogen sulfide; US, ultrasound; H/R, hypoxia for 2 h with subsequent reoxygenation for 12 h; H/R+NaHS, hypoxia for 2 h followed by immediate addition of NaHS solution, then reoxygenation for 12 h
FIGURE 2
FIGURE 2
Thrombolytic effect of hs‐Mbs+US and Mbs+US in ex vivo macrothrombi. (A) H&E staining and scanning electron microscopy (SEM) of in vitro white macrothrombi. (B) White macrothrombi in the transverse view of the rubber tube before and after treatment. Quantification of (C) increased blood flow velocity, (D) thrombus reduction in the transverse section, and (E) decreased clot mass in white macrothrombi after treatment. (F) H&E staining and scanning electron microscopy of in vitro red macrothrombi. (G) Red macrothrombi in the transverse view of the rubber tube before and after treatment. Quantification of (H) increased blood flow velocity, (I) thrombus reduction in the transverse section, and (J) decreased clot mass in red macrothrombi after treatment. Control, controlled saline infusion; US, ultrasound; hs‐Mbs, microbubble loaded with hydrogen sulfide. *P < .05 vs control; #P < .05 vs US, n = 15 per group
FIGURE 3
FIGURE 3
Thrombolytic effect of hs‐Mbs+US and Mbs+US in rat left iliac artery thromboembolism models. (A) Representative images of H&E staining and CD41 immunohistochemical staining of in vivo white thrombi. (B) Diagnostic US imaging of white thrombi and CEUS imaging of hindlimb perfusion before and after treatment. Quantitation of the (C) recanalization rate, (D) blood flow velocity, and (E) video intensity of CEUS imaging after treatment in white thromboembolism models. (F) Representative images of H&E staining and CD41 immunohistochemical staining of in vivo red thrombi. (G) Diagnostic US imaging of red thrombi and CEUS imaging of hindlimb perfusion before and after treatment. Quantitation of the (H) recanalization rate, (I) blood flow velocity, and (J) video intensity of CEUS imaging after treatment in red thromboembolism models. Control, controlled saline infusion; US, ultrasound; hs‐Mbs, microbubble loaded with hydrogen sulfide. *P < .05 vs control; #P < .05 vs US, n = 15 per group.
FIGURE 4
FIGURE 4
In vivo mitigation of IRI‐induced skeletal muscle oxidative stress and inflammation by hs‐Mbs+US. (A) Ambulatory impairment score of white thrombus model rats left hindlimb a week after the treatment. (B) H&E staining of white thrombus model rats hindlimb skeletal muscle after different treatments. Serum (C) IL‐6 and (D) TNF‐α in white thrombus model rats after treatments. (E) Ambulatory impairment score of red thrombus model rats left hindlimb a week after the treatment. (F) H&E staining of red thrombus model rats hindlimb skeletal muscle after different treatments. Serum (G) IL‐6 and (H) TNF‐α in white red model rats after treatments. (I) Representative immunofluorescence images of ROS‐stained skeletal muscle sections from rats hindlimb with white thrombi. (J) SOD and (K) MDA levels in rat skeletal muscle with white thrombi after different treatments. (L) Representative immunofluorescence images of ROS‐stained skeletal muscle sections from rats hindlimb with red thrombi. (M) SOD and (N) MDA levels in rat skeletal muscle with red thrombi after different treatments. Control, controlled saline infusion; US, ultrasound; hs‐MB, microbubble loaded with hydrogen sulfide. *P < .05 vs control; #P < .05 vs US, $P < .05 vs US+MB, n = 15 per group
FIGURE 5
FIGURE 5
In vivo alleviation of IRI‐induced skeletal muscle cell apoptosis by hs‐Mbs+US. (A) Representative immunofluorescence images and quantification of TUNEL‐stained skeletal muscle sections from rats in the white left iliac artery macrothrombus model. (B) Representative Western blotting images and statistical analysis of Bcl‐2, Bax, caspase‐9, and caspase‐3 in rat skeletal muscle in the white thrombus model. Representative (C) immunohistochemical staining for caspase‐3, (D) caspase‐9, and (E) quantification in the white thrombus model. (F) Representative immunofluorescence images and quantification of TUNEL‐stained skeletal muscle sections from rats in the red left iliac artery macrothrombus model. (G) Representative Western blotting images and statistical analysis of Bcl‐2, Bax, caspase‐9, and caspase‐3 in rat skeletal muscle in the red thrombus model. Representative (H) immunohistochemical staining for caspase‐3, (I) caspase‐9, and (J) quantification in the red thrombus model. Control, controlled saline infusion; US, ultrasound; hs‐Mbs, microbubble loaded with hydrogen sulfide. *P < .05 vs control; #P < .05 vs US, $P < .05 vs Mbs+US, n = 15 per group
FIGURE 6
FIGURE 6
In vitro therapeutic effect of NaHS on hypoxia/reoxygenation L6 cells. L6 cells were pretreated with hypoxia (3% O2) for 2 h, treated with various solutions, and then subjected to normoxia (20% O2) for 12 h. (A) Representative immunofluorescence images of cellular ROS and statistical analysis. (B) Protein expression of total and phosphorylated AKT in L6 cells and statistical analysis. (C) Protein expression of NQO1 and SOD2 in L6 cells and statistical analysis. (D) Representative immunofluorescence images of TUNEL‐stained sections of L6 cells and statistical analysis. (E) Protein expression of Bcl‐2, Bax, caspase‐9, and caspase‐3 in L6 cells and statistical analysis. *P < .05 vs the H/R group; #P < .05, H/R+NaHS vs H/R+NaHS+HT; &P < .05, H/R+NaHS vs H/R+NaHS+H2O2. (F) Representative immunofluorescence images of cellular ROS and statistical analysis. (G) Protein expression of total and phosphorylated AKT in L6 cells with various treatments and statistical analysis. (H) Protein expression of NQO1 and SOD2 in L6 cells and statistical analysis. (I) Representative immunofluorescence images of TUNEL‐stained sections of L6 cells and statistical analysis. (J) Protein expression of Bcl‐2, Bax, caspase‐9, and caspase‐3 in L6 cells and statistical analysis. NaHS, sodium hydrosulfide; HT, hypotaurine, an H2S scavenger; H2O2, hydrogen peroxide, stimulus production of ROS. GSK690693 (GSK), AKT protein phosphorylation inhibitor; SC79, AKT protein phosphorylation agonist. *P < .05 vs the H/R group; #P < .05 vs H/R+NaHS+GSK690693; &P < .05 vs H/R+NaHS+SC79; $P < .05+vs H/R+NaHS+GSK690693

References

    1. Wendelboe AM, Raskob GE. Global burden of thrombosis: epidemiologic aspects. Circ Res. 2016;118(9):1340‐1347. - PubMed
    1. Kim JT, Fonarow GC, Smith EE, et al. Treatment with tissue plasminogen activator in the golden hour and the shape of the 4.5‐hour time‐benefit curve in the National United States Get With the Guidelines‐Stroke population. Circulation. 2017;135(2):128‐139. - PubMed
    1. Zerna C, Siepmann T, Barlinn K, et al. Association of time on outcome after intravenous thrombolysis in the elderly in a telestroke network. J Telemed Telecare. 2016;22(1):18‐24. - PubMed
    1. Eltzschig HK, Eckle T. Ischemia and reperfusion–from mechanism to translation. Nat Med. 2011;17(11):1391‐1401. - PMC - PubMed
    1. Jennings RB. Historical perspective on the pathology of myocardial ischemia/reperfusion injury. Circ Res. 2013;113(4):428‐438. - PubMed

Publication types

Substances