. 2020 Oct 1;143(10):2929-2944.
doi: 10.1093/brain/awz307.

Defining the clinical, molecular and imaging spectrum of adaptor protein complex 4-associated hereditary spastic paraplegia

Darius Ebrahimi-Fakhari  1 Julian Teinert  1   2 Robert Behne  1   3 Miriam Wimmer  1 Angelica D'Amore  1   4 Kathrin Eberhardt  1 Barbara Brechmann  1 Marvin Ziegler  1 Dana M Jensen  5 Premsai Nagabhyrava  1   6 Gregory Geisel  1   6 Erin Carmody  1   6 Uzma Shamshad  1   6 Kira A Dies  1   6 Christopher J Yuskaitis  1 Catherine L Salussolia  1 Daniel Ebrahimi-Fakhari  7   8 Toni S Pearson  9 Afshin Saffari  2 Andreas Ziegler  2 Stefan Kölker  2 Jens Volkmann  3 Antje Wiesener  10 David R Bearden  11 Shenela Lakhani  12 Devorah Segal  12   13 Anaita Udwadia-Hegde  14 Andrea Martinuzzi  15 Jennifer Hirst  16 Seth Perlman  17 Yoshihisa Takiyama  18 Georgia Xiromerisiou  19 Katharina Vill  20 William O Walker  21 Anju Shukla  22 Rachana Dubey Gupta  23 Niklas Dahl  24 Ayse Aksoy  25 Helene Verhelst  26 Mauricio R Delgado  27 Radka Kremlikova Pourova  28 Abdelrahim A Sadek  29 Nour M Elkhateeb  30 Lubov Blumkin  31 Alejandro J Brea-Fernández  32 David Dacruz-Álvarez  33 Thomas Smol  34 Jamal Ghoumid  34 Diego Miguel  35 Constanze Heine  36 Jan-Ulrich Schlump  37 Hendrik Langen  38 Jonathan Baets  39 Saskia Bulk  40 Hossein Darvish  41 Somayeh Bakhtiari  42 Michael C Kruer  42 Elizabeth Lim-Melia  43 Nur Aydinli  44 Yasemin Alanay  45 Omnia El-Rashidy  46 Sheela Nampoothiri  47 Chirag Patel  48 Christian Beetz  49 Peter Bauer  49 Grace Yoon  50 Mireille Guillot  51 Steven P Miller  51 Thomas Bourinaris  52 Henry Houlden  52 Laura Robelin  53 Mathieu Anheim  53 Abdullah S Alamri  54 Adel A H Mahmoud  55 Soroor Inaloo  56 Parham Habibzadeh  57 Mohammad Ali Faghihi  57   58 Anna C Jansen  59 Stefanie Brock  59 Agathe Roubertie  60 Basil T Darras  1 Pankaj B Agrawal  61 Filippo M Santorelli  4 Joseph Gleeson  62 Maha S Zaki  63 Sarah I Sheikh  64 James T Bennett  5 Mustafa Sahin  1   6
Affiliations

Defining the clinical, molecular and imaging spectrum of adaptor protein complex 4-associated hereditary spastic paraplegia

Darius Ebrahimi-Fakhari et al. Brain. .

Erratum in

Abstract

Bi-allelic loss-of-function variants in genes that encode subunits of the adaptor protein complex 4 (AP-4) lead to prototypical yet poorly understood forms of childhood-onset and complex hereditary spastic paraplegia: SPG47 (AP4B1), SPG50 (AP4M1), SPG51 (AP4E1) and SPG52 (AP4S1). Here, we report a detailed cross-sectional analysis of clinical, imaging and molecular data of 156 patients from 101 families. Enrolled patients were of diverse ethnic backgrounds and covered a wide age range (1.0-49.3 years). While the mean age at symptom onset was 0.8 ± 0.6 years [standard deviation (SD), range 0.2-5.0], the mean age at diagnosis was 10.2 ± 8.5 years (SD, range 0.1-46.3). We define a set of core features: early-onset developmental delay with delayed motor milestones and significant speech delay (50% non-verbal); intellectual disability in the moderate to severe range; mild hypotonia in infancy followed by spastic diplegia (mean age: 8.4 ± 5.1 years, SD) and later tetraplegia (mean age: 16.1 ± 9.8 years, SD); postnatal microcephaly (83%); foot deformities (69%); and epilepsy (66%) that is intractable in a subset. At last follow-up, 36% ambulated with assistance (mean age: 8.9 ± 6.4 years, SD) and 54% were wheelchair-dependent (mean age: 13.4 ± 9.8 years, SD). Episodes of stereotypic laughing, possibly consistent with a pseudobulbar affect, were found in 56% of patients. Key features on neuroimaging include a thin corpus callosum (90%), ventriculomegaly (65%) often with colpocephaly, and periventricular white-matter signal abnormalities (68%). Iron deposition and polymicrogyria were found in a subset of patients. AP4B1-associated SPG47 and AP4M1-associated SPG50 accounted for the majority of cases. About two-thirds of patients were born to consanguineous parents, and 82% carried homozygous variants. Over 70 unique variants were present, the majority of which are frameshift or nonsense mutations. To track disease progression across the age spectrum, we defined the relationship between disease severity as measured by several rating scales and disease duration. We found that the presence of epilepsy, which manifested before the age of 3 years in the majority of patients, was associated with worse motor outcomes. Exploring genotype-phenotype correlations, we found that disease severity and major phenotypes were equally distributed among the four subtypes, establishing that SPG47, SPG50, SPG51 and SPG52 share a common phenotype, an 'AP-4 deficiency syndrome'. By delineating the core clinical, imaging, and molecular features of AP-4-associated hereditary spastic paraplegia across the age spectrum our results will facilitate early diagnosis, enable counselling and anticipatory guidance of affected families and help define endpoints for future interventional trials.

Keywords: SPG47; SPG50; SPG51; SPG52; neurodegeneration.


Figures

Figure 1
Figure 1
Demographic data of the study cohort. (A) A total of 156 patients were enrolled in the study, the majority carrying bi-allelic variants in AP4B1 and AP4M1. (B) Most patients were under the age of 18 years at the last follow-up with only a few adult patients reported. (C and D) Enrolled patients cover all major ethnicities with the majority being Caucasian or of Arab descent. Most families are located in Europe, the Middle East, North America and North Africa.
Figure 2
Figure 2
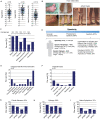
Key clinical features in AP-4-HSP. (A) Distribution of height, weight and head circumference according to sex- and age-appropriate CDC growth charts. A subset of patients shows significant growth failure with a height and/or weight under the −2 SD mark (hash symbol indicates two patients with a weight above +3 SD). Postnatal microcephaly is found in the majority of patients, most commonly in a moderate range between −2 SD and −4 SD. (B) Foot deformities may include macrodactyly (top, macrodactyly of the right foot shown before and after surgical debulking), and pes equinovarus as well as pes planus. (C) Developmental delay is a universal feature and motor milestones are often prominently delayed. The bar graph shows the percentage of patients who achieved a given motor milestone. The average age at which each milestone was achieved is shown above the graph. White numbers on bars indicate the number of individuals for whom information was available. (D) Motor symptoms evolve from mild hypotonia in infancy to spastic diplegia and later tetraplegia. Progressive spasticity is a hallmark feature of AP-4-HSP and accounts for a large part of the morbidity. (E and F) Extrapyramidal movement disorders and cerebellar signs are found in a subset of patients, often with advanced disease. (G and H) Seizures in AP-4-HSP include frequent seizures in the setting of fever as well unprovoked seizures leading to a diagnosis of epilepsy in about two-thirds of patients. (I) About 40% of all patients present with at least one episode of status epilepticus, often with their first seizure. White numbers on bars indicate the number of individuals for whom information was available.
Figure 3
Figure 3
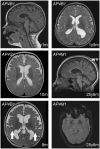
Key imaging features in AP-4-HSP. Brain MR images of AP-4-HSP patients [mean age: 7.4 ± 7.3 years (SD)]. Representative images of key imaging features are shown. Top left: Thinning of the corpus callosum, shown here on a sagittal T1-weighted image, is found in 90% (94/104) of patients and is prominent in the posterior parts. Non-specific white matter abnormalities are noted in 68% (69/102). Top right: Ventriculomegaly, shown here on an axial T2-weighted image, is common (65%, 67/103) and often presents as asymmetric colpocephaly. Middle left: Cortical atrophy, shown here on an axial T2-weighted image, is more commonly found in patients with advanced disease but can be present in young patients as well. Cerebral atrophy is overall found in 37% of cases (38/102). Middle right: Cerebellar atrophy, shown here on a sagittal T1-weighted image, is found in a subset of patients (23%, 20/89). Bottom left: Bilateral perisylvian polymicrogryria (arrows), shown on an axial T2-weighted image. Bottom right: Bilateral symmetric hypointensity of the globus pallidus on axial susceptibility-weighted imaging is suggestive of iron accumulation in this previously reported patient with AP4M1-associated HSP (Roubertie et al., 2018).
Figure 4
Figure 4
The molecular spectrum of AP-4-HSP. Schematic representation showing the four genes encoding subunits of the AP-4 (AP4B1, AP4M1, AP4E1, AP4S1) and the distribution of the reported variants. Parentheses indicate the number of alleles with that variant. Reference sequences: AP4B1: NM_001253852.1; AP4M1: NM_004722.3; AP4E1: NM_007347.4; AP4S1: NM_007077.4. NC = non-coding.
Figure 5
Figure 5
Clinical rating scales and disease progression in AP-4-HSP. Standardized assessment of disease severity using the (A) SPRS, (B) SPRS spasticity subscore (items 7–10 of the SPRS), (C) Modified Ashworth Scale (MAS), (D) SPATAX EUROSPA disability score (0 = no functional handicap, 1 = no functional handicap but signs at examination, 2 = mild, able to run, walking unlimited, 3 = moderate, unable to run, limited walking without aid, 4 = severe, walking with one stick, 5 = walking with two sticks or four-wheel walker, 6 = unable to walk, requiring wheelchair, 7 = confined to bed), (E) Four Stage Functional Mobility score (1 = mild symptoms walking without an aid; 2 = walking without aid but unable to run; 3 = walking with aid; and 4 = wheelchair dependent). The number of individuals with data available is indicated above each graph. Assessing disease severity across the age spectrum, we found a moderate but significant linear correlation between the (F) SPRS total score (n = 37) and (G) SPRS spasticity subscore (n = 36) with age as determined by Pearson correlation index for linear regression. The red line indicates a linear regression curve while the blue line indicated a non-linear (exponential) curve. (H) Longitudinal assessment of SPATAX-EUROPA disability stages in patients who achieved ambulation (n = 39). Each patient is shown in a different colour with lines between different time points. A general trend towards higher scores, indicating greater motor disability, with increasing age becomes apparent. (I and J) A subanalysis by genotype showed no significant difference in disease severity by (I) SPRS total score and (J) SPRS spasticity subscore. (K) Significantly higher SPRS scores are present in individuals with epilepsy (unpaired t-test, P = 0.04).

Comment in

References

    1. Abou Jamra R, Philippe O, Raas-Rothschild A, Eck SH, Graf E, Buchert R, et al.Adaptor protein complex 4 deficiency causes severe autosomal-recessive intellectual disability, progressive spastic paraplegia, shy character, and short stature. Am J Hum Genet 2011; 88: 788–95. - PMC - PubMed
    1. Accogli A, Hamdan FF, Poulin C, Nassif C, Rouleau GA, Michaud JL, et al.A novel homozygous AP4B1 mutation in two brothers with AP-4 deficiency syndrome and ocular anomalies. Am J Med Genet A 2018; 176: 985–91. - PubMed
    1. Aguilar RC, Boehm M, Gorshkova I, Crouch RJ, Tomita K, Saito T, et al.Signal-binding specificity of the mu4 subunit of the adaptor protein complex AP-4. J Biol Chem 2001; 276: 13145–52. - PubMed
    1. Appleton RE, Gupta R. Cerebral palsy: not always what it seems. Arch Dis Child 2019; 104: 809–14. - PubMed
    1. Bax M, Tydeman C, Flodmark O. Clinical and MRI correlates of cerebral palsy: the European Cerebral Palsy Study. JAMA 2006; 296: 1602–8. - PubMed

Publication types

Substances