. 2021 Jun;37(3):461-478.
doi: 10.1007/s10565-020-09557-x. Epub 2020 Sep 26.

Significance of hematopoietic surface antigen CD34 in neuroblastoma prognosis and the genetic landscape of CD34-expressing neuroblastoma CSCs

Affiliations

Significance of hematopoietic surface antigen CD34 in neuroblastoma prognosis and the genetic landscape of CD34-expressing neuroblastoma CSCs

Natarajan Aravindan et al. Cell Biol Toxicol. 2021 Jun.

Abstract

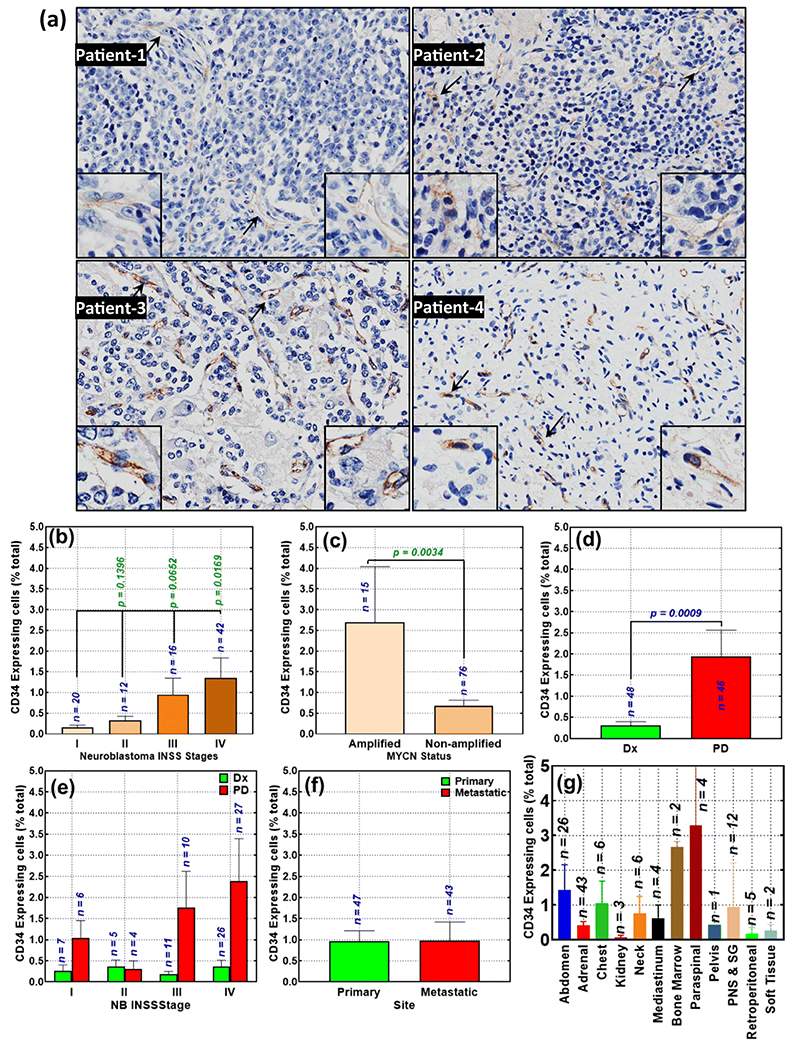
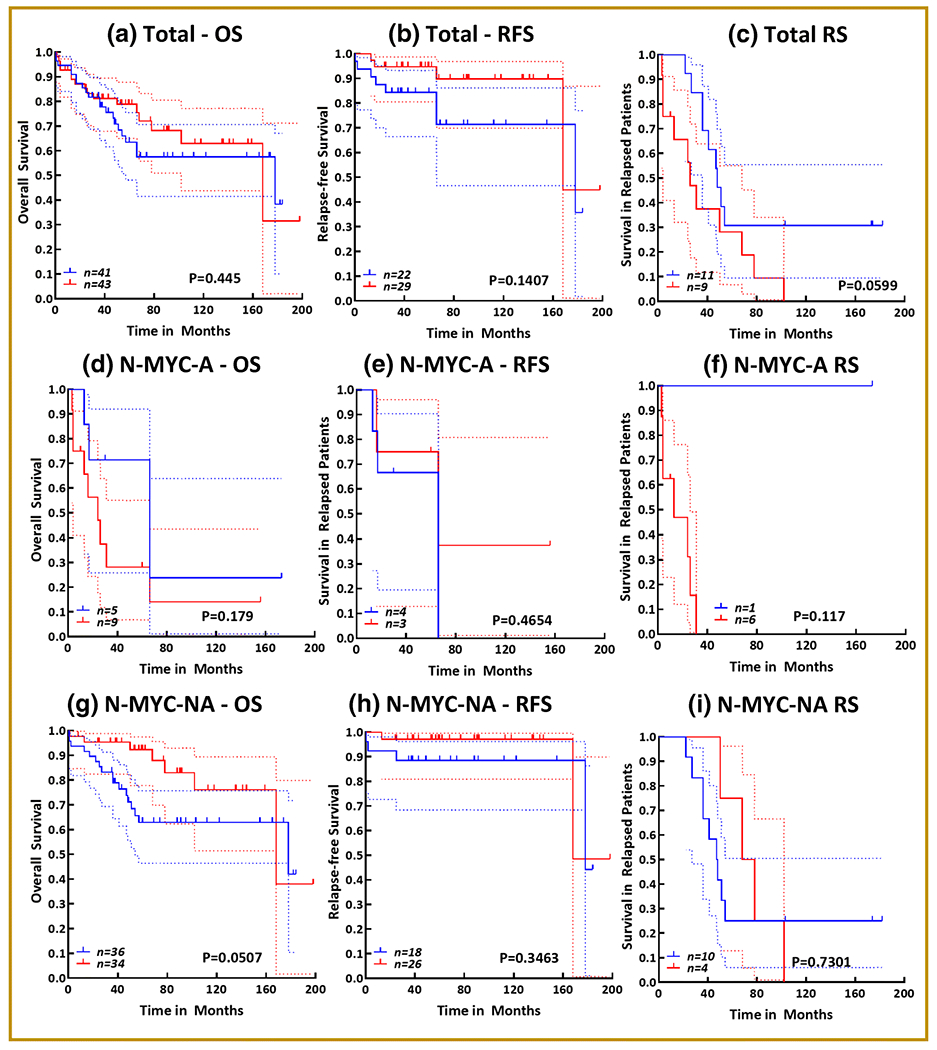
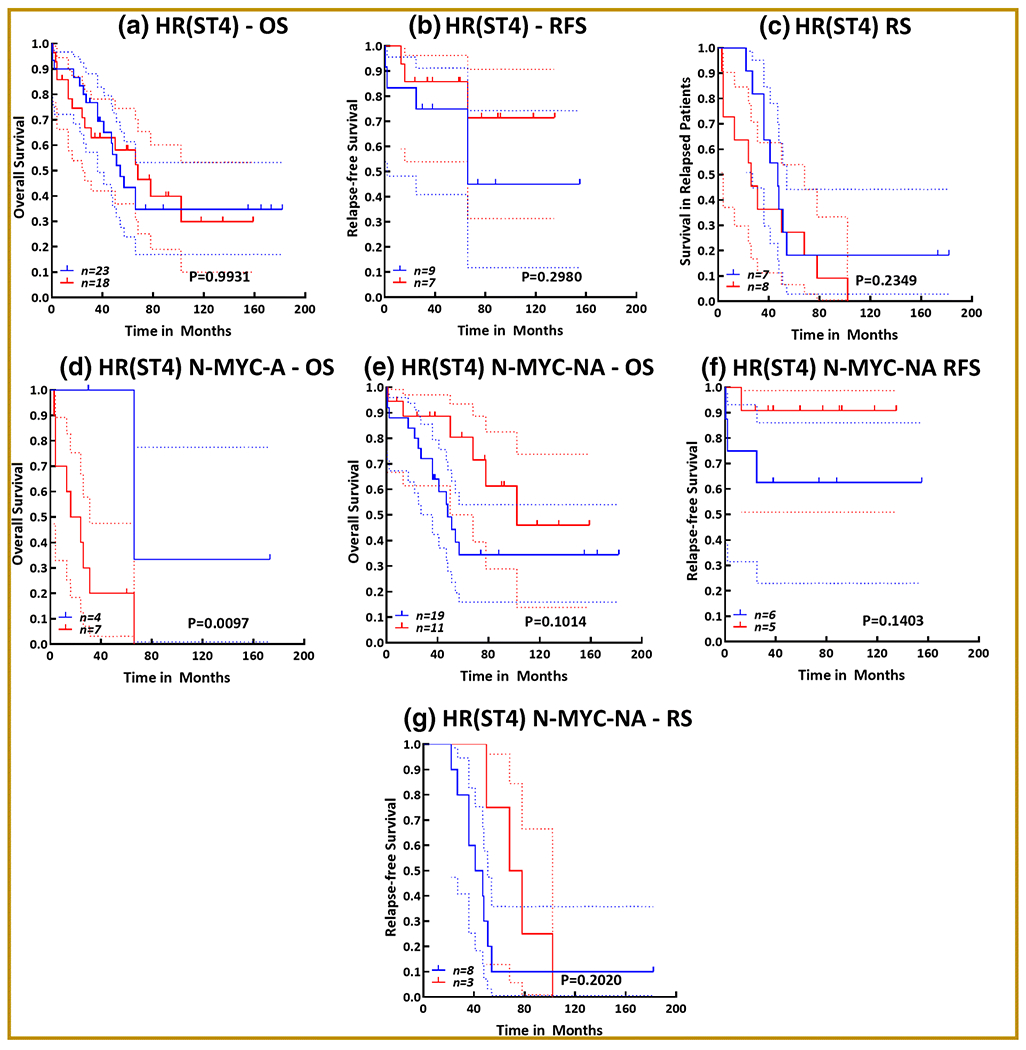
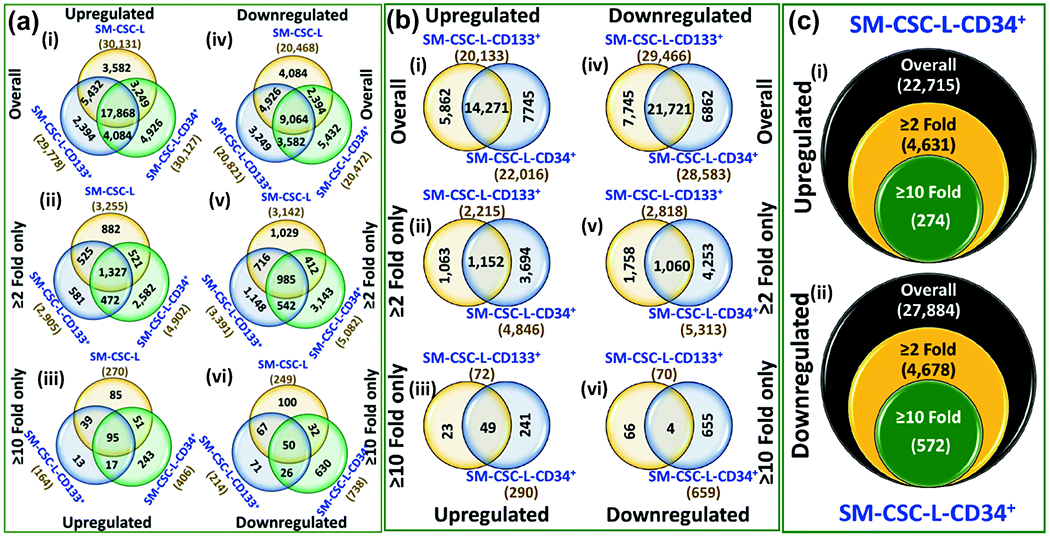
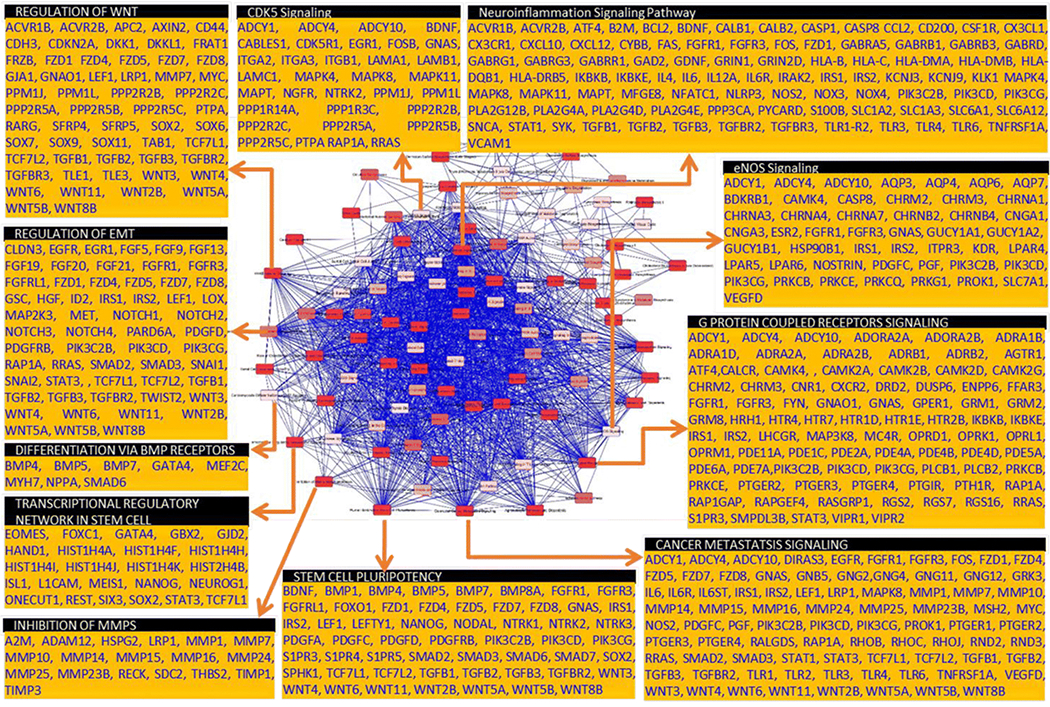
High-risk neuroblastoma (HR-NB) is branded with hematogenous metastasis, relapses, and dismal long-term survival. Intensification of consolidation therapy with tandem/triple autologous stem cell (SC) rescue (with bone marrow [BM]/peripheral blood [PB] CD34+ selection) after myeloablative chemotherapy has improved long-term survival. However, the benefit is limited by the indication of NB cells in CD34+ PBSCs, CD34 expression in NB cells, and the risk of reinfusing NB cancer stem cells (NB CSCs) that could lead to post-transplant relapse. We investigated the association of CD34 surface expression (92 patients) with NB evolution/clinical outcomes. CD34 gene-level status in NB was assessed through RNA-Seq data mining (18 cohorts, n, 3324). Genetic landscape of CD34-expressing NB CSCs (CD133+CD34+) was compared with CD34- CSCs (CD133+CD34-). RNA-seq data revealed equivocal association patterns of CD34 expression with patient survival. Our immunohistochemistry data revealed definite, but rare (mean, 0.73%; range 0.00-7.87%; median, 0.20%) CD34 positivity in NB. CD34+ significantly associated with MYCN amplification (p, 0.003), advanced disease stage (p, 0.016), and progressive disease (PD, p < 0.0009) after clinical therapy. A general high-is-worse tendency was observed in patients with relapsed disease. High CD34+ correlated with poor survival in patients with N-MYC-amplified HR-NB. Gene expression analysis of CD34+-NB CSCs identified significant up (4631) and downmodulation (4678) of genes compared with NB CSCs that lack CD34. IPA recognized the modulation of crucial signaling elements (EMT, stemness maintenance, differentiation, inflammation, clonal expansion, drug resistance, metastasis) that orchestrate NB disease evolution in CD34+ CSCs compared with CD34- CSCs. While the function of CD34 in NB evolution requires further in-depth investigation, careful consideration should be exercised for autologous stem cell rescue with CD34+ selection in NB patients. Graphical abstract.

Keywords: CD34; Cancer stem cells; Disease evolution; Neuroblastoma; Stem cell rescue; Tumor progression.


Conflict of interest statement

Conflicts of interest: All other authors have nothing to disclose.

Figures

Figure 1.
Figure 1.. Availability of CD34-expressing cells with advanced disease in neuroblastoma patients:
(a) Representative microphotographs showing surface expression of CD34 in human NB [Magnification 20x; Insert, 40x], Histograms constructed from Aperio TMA image analysis of CD34 strong positivity identified (b) significant association of CD34 expression with advanced disease stage; (c) profound correlation of high CD34 expression with N-MYC amplification compared with N-MYC non-amplified subset; (d) acquired gain of CD34-expressing cells in progressive tumors after intensive multimodal clinical therapy (PD, progressive disease) compared with the disease at diagnosis (Dx); (e) acquired gain of CD34-expressing cells in progressive tumors after IMCT in patients presenting with various stages of disease; (f) no significant association with primary or metastatic disease; and (g) the levels of CD34-expressing cells in NB tumors from various recovery sites, irrespective of the primary or metastatic status. Group-wise comparisons were performed with GraphPad Prism. P values of less than 0.05 were considered significant.
Figure 2.
Figure 2.. Presence of CD34+ expressing cells in NB clinical outcomes:
Kaplan-Meier curves showing the association of the presence of CD34+ cells with (a) overall survival, (b) relapse-free survival, and (c) survival in patients with relapsed disease in a cohort of 84 NB patients. Kaplan-Meier curves showing the association of the presence of CD34+ cells with (d) overall survival, (e) relapse-free survival, and (f) survival in patients with relapsed disease in a cohort of 14 N-MYC amplified NB patient subset. Kaplan-Meier curves showing the association of the presence of CD34+ cells with (g) overall survival, (h) relapse-free survival, and (i) survival in patients with relapsed disease in a cohort of 70 N-MYC non-amplified NB patient subset. All survival analysis (log rank Mantle cox test and hazard ratio) and Kaplan-Meier curves were performed in GraphPad Prism. Blue = absence of CD34+ cells; Red = presence of CD34+ cells; dotted lines = 95% confidence interval.
Figure 3.
Figure 3.. Association of CD34+-expressing cells with clinical outcomes in high-risk NB patients:
Kaplan-Meier curves showing the association of the presence of CD34+ cells with (a) overall survival, (b) relapse-free survival, and (c) survival in patients with relapsed disease in a cohort of 41 high-risk (stage 4) NB patients. Kaplan-Meier curves showing the association of the presence of CD34+ cells with (d) overall survival in a cohort of 11 N-MYC amplified high-risk patient subset. Kaplan-Meier curves showing the association of the presence of CD34+ cells with (e) overall survival, (f) relapse-free survival, and (g) survival in patients with relapsed disease in a cohort of 30 N-MYC non-amplified high-risk (stage 4) NB patient subset. All survival analysis (log rank Mantle cox test and hazard ratio) and Kaplan-Meier curves were performed in GraphPad Prism. Blue = absence of CD34+ cells; Red = presence of CD34+ cells; dotted lines = 95% confidence interval.
Figure 4.
Figure 4.. Genetic landscape of NB-CSCs:
(a) Venn diagrams of gene comparison analysis from whole genome gene expression profile showing genes that are upmodulated and downmodulated in NB-CSCs (SM-CSC-L, SM-CSC-L-CD133+, vs. SM-CSC-L-CD34+) compared with non-CSC tumor cells (SH-SY5Y). (b) Venn diagrams of gene comparison analysis from whole genome gene expression profile showing genes that are upmodulated and downmodulated in designated NB-CSCs (SM-CSC-L-CD 133+, vs. SM-CSC-L-CD34+) compared with unsorted CSCs (SM-CSC-L). (c) Venn diagrams of gene comparison analysis from whole genome gene expression profile showing genes that are upmodulated and downmodulated in CD133+CD34+ (SM-CSC-L-CD34+) CSCs compared with CD133+CD34 (SM-CSC-L-CD133+) CSCs. Venn diagrams constructed for overall modulated, significantly modulated (≥2 fold) .and highly significant (≥10 fold) are arranged vertically. Numbers outside the circle are the total number of genes that are upregulated or downregulated in any given CSCs; numbers inside the circle are specific to the particular CSC; numbers in overlapping regions between two circles are the genes commonly modulated between those specific CSCs; numbers in the center are the commonly modulated genes.
Figure 5.
Figure 5.. Relevance of CD34+ NB-CSC gene signature in stemness maintenance and tumor evolution:
Overlay of top 100 statistically significant canonical pathways identified by IPA analysis with direct relationship showing tightly inter-regulated signaling events that drive stemness maintenance, self-renewal capacity, EMT, clonal expansion, tumor progression, and evolution. Pull out boxes for some of the canonical pathways showing the list of candidate genes involved in these pathways that are modulated in the CD34+NB-CSCs.

References

    1. Abdullah LN, Chow EK (2013). Mechanisms of chemoresistance in cancer stem cells. Clin Transl Med 2:3. - PMC - PubMed
    1. Ahmed AA, Zhang L, Reddivalla N, Hetherington M (2017). Neuroblastoma in children: Update on clinicopathologic and genetic prognostic factors. Pediatr Hematol Oncol 34:165–185 - PubMed
    1. Alisi A, Cho WC, Locatelli F, Fruci D (2013). Multidrug resistance and cancer stem cells in neuroblastoma and hepatoblastoma. Int J Mol Sci 14:24706–25 - PMC - PubMed
    1. Ambros PF, Ambros IM, Brodeur GM, Haber M, Khan J, Nakagawara A, Schleiermacher G, Speleman F, Spitz R, London WB, Cohn SL, Pearson AD, Maris JM (2009). International consensus for neuroblastoma molecular diagnostics: report from the International Neuroblastoma Risk Group (INRG) Biology Committee. Br J Cancer 100:1471–82 - PMC - PubMed
    1. American-Cancer-Society. (2013). Cancer Facts & Figures Atlanta: American Cancer Society 1–64

Publication types

MeSH terms