. 2020 Nov;29(11):2259-2273.
doi: 10.1002/pro.3958. Epub 2020 Oct 5.

Learning peptide recognition rules for a low-specificity protein

Affiliations

Learning peptide recognition rules for a low-specificity protein

Lucas C Wheeler et al. Protein Sci. 2020 Nov.

Abstract

Many proteins interact with short linear regions of target proteins. For some proteins, however, it is difficult to identify a well-defined sequence motif that defines its target peptides. To overcome this difficulty, we used supervised machine learning to train a model that treats each peptide as a collection of easily-calculated biochemical features rather than as an amino acid sequence. As a test case, we dissected the peptide-recognition rules for human S100A5 (hA5), a low-specificity calcium binding protein. We trained a Random Forest model against a recently released, high-throughput phage display dataset collected for hA5. The model identifies hydrophobicity and shape complementarity, rather than polar contacts, as the primary determinants of peptide binding specificity in hA5. We tested this hypothesis by solving a crystal structure of hA5 and through computational docking studies of diverse peptides onto hA5. These structural studies revealed that peptides exhibit multiple binding modes at the hA5 peptide interface-all of which have few polar contacts with hA5. Finally, we used our trained model to predict new, plausible binding targets in the human proteome. This revealed a fragment of the protein α-1-syntrophin that binds to hA5. Our work helps better understand the biochemistry and biology of hA5, as well as demonstrating how high-throughput experiments coupled with machine learning of biochemical features can reveal the determinants of binding specificity in low-specificity proteins.

Keywords: S100 proteins; X-ray crystallography; binding specificity; hydrophobicity; machine learning; peptides.


Figures

FIGURE 1
FIGURE 1
S100 proteins interact with peptides in a canonical peptide binding interface in a calcium‐dependent manner. (a) Overlay of S100:peptide structures shown in panels (b)–(f). The two chains of the homodimer are shown in black and white. The bound calcium ions are shown as blue spheres. The peptide binding surfaces are highlighted with arrows. Panels (b)–(f) show five different S100:peptide pairs. The S100 chains shown as surfaces and the peptides shown as tubes, colored as a rainbow from N‐ to C‐terminal. (b) S100B interacting with TRTK12 peptide (PDB ID: 3IQQ); (c) S100A1 interacting with TRTK12 peptide (PDB ID: 2KBM); (d) S100A11 interacting with Annexin I N‐terminus (PDB ID: 1QLS); (e) S100A4 interacting with myosin‐IIA peptide (PDB ID: 3ZWH); and (f) S100A6 interacting with Siah‐1 interacting peptide (PDB ID: 2JTT). To better show the peptide binding interface, this structure is rotated 90° relative to the other structures, as indicated
FIGURE 2
FIGURE 2
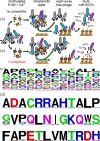
Interacting peptides can be identified using phage display. Panels (a) and (b) Rows show two different experiments, done in parallel, for each protein. Biotinylated, Ca 2+‐loaded, hA5 is added to a population of phage either alone (row a) or in the presence of saturating competitor peptide (row b). Phage that bind to the protein (blue or purple) are pulled down using a streptavidin plate. Bound phage are then eluted using EDTA, which disrupts the peptide binding interface. In the absence of competitor (row a), phage bind adventitiously (purple) as well as at the interface of interest (blue). In the presence of competitor (row b), only adventitious binders are present. (c) Sequence logo for all peptides in the phage display dataset for which E < −1.37. Each position is highly variable in the position‐weight‐matrix. (d) Frequency sequence logos representing three of the 28 peptide clusters identified using DBSCAN
FIGURE 3
FIGURE 3
Machine learning model predicts phage display enrichment. (a) Diagram of the process for training the machine‐learning model. Peptides are broken into sliding windows and a set of predicted biochemical features is calculated for each window. These are the features used in the machine‐learning model. (b) We found best model input parameters using cross‐validation. Pairs of bars represent the average Rtrain2 (blue) or Rtest2 (orange) for 10‐fold cross‐validation replicates of the data using the model parameters below. Square indicates whether the feature was used in the model (filled) or not (empty). “Window”: whether sliding windows were used. “HOPS” and “CIDER” features are listed in Table S1. “Num. estimators” is number of estimators included in the Random Forest. The Rtrain2 and Rtest2 are indicated for the chosen model. (c) Points are individual peptides. Red line is the a linear regression between the predicted E and measured E for each peptide in the test set. Dashed line blue line indicates the threshold below which we can measure enrichment (E = −1.37). (d) ROC curve for classifying peptides as above or below the E cutoff. The area under the curve is shown on the plot. (e) Heat map shows the contribution of each site (position 1–12) and aggregated chemical feature (top‐to‐bottom) to the final model. Color indicates relative contribution from red (strong) to white (no contribution). The marginal contribution of each chemical feature is shown to the right of the plot. Table S1 describes which chemical features went into which aggregate bins
FIGURE 4
FIGURE 4
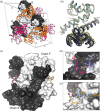
Crystal structure of hA5 reveals variability of the peptide interaction surface. (a) The unit cell of the hA5 crystal structure showing the packing of the asymmetric unit, which contains three homodimers (white/dark gray surface). Crystallographic symmetry mates that occupy the peptide‐binding in three distinct conformations are shown as ribbon (orange, pink, and light pink). Unit cell axes are labeled in gray. (b) Overlay of all calcium‐bound structures of hA5: 1.25 Å crystal structure from this study (white/dark gray, 6 chains), a 2.60 Å crystal structure (PDB: 4dir, teal/blue, 2 chains), and an NMR solution structure (PDB: 2kay, yellow/olive, 2 chains). (c) The homodimer containing chains E and F (dark gray, white) with the regions of crystal symmetry mates that occupy the peptide‐binding site shown as sticks. D‐E) Electron density showing the binding site occupied by Met1 and Leu44, from separate chains, or Leu88 and Phe86 from the same chain. 2Fo‐Fc density shown as blue mesh at 1.5 σ
FIGURE 5
FIGURE 5
Docked peptides show multiple binding modes. (a–d) Docking results for peptides indicated above each graph. Each point is a single model. The color of each point indicates its cluster membership, ranked from the cluster with the best to the worst score: black, blue, green, brown, and purple. We excluded models from outside the top five clusters from this plot. The x‐axis is the ROSETTA score for the model; the y‐axis is the C α RMSD for each model against the best model for that peptide. (e–h) Plausible models for the peptide are indicated on the structure. The hA5 input structure is shown as a surface, with chain A and B shown in gray and white. The peptide is shown as a tube, colored from blue (N‐terminus) to red (C‐terminus). We show the top five highest‐scoring peptides for each model. (i) Molecular detail of the highest scoring overall peptide model (A5cons). C α atoms are highlighted with colors matching panel f. The three hydrogen bonds formed between the peptide and hA5 are indicated with arrows; hydrophobic interactions are indicated with “*”. Sidechains that do not interact with S100 have been removed for clarity. (j) Overlay of all 20 peptide docks shown in panels e–h
FIGURE 6
FIGURE 6
hA5 binds tightly to one of the predicted peptide targets. (a) Histogram showing the distribution of E scores for proteomic 12‐mers predicted to bind to hA5. Red dashed line indicates the cutoff of E = −1.37. (b) Sequences of the five proteomic peptides predicted to bind to hA5. Newly discovered target, α‐1‐syn, is highlighted in red. (c) Isothermal Titration Calorimetry (ITC) trace showing binding of peptide α‐1‐syn to hA5. We estimated parameters for a single‐site binding model to the data using the Bayesian MCMC sampler in pytc. 62 Lines show 100 individual fits sampled from the Bayesian posterior probability distribution. Inset shows structure of human α‐1‐syntrophin (PDB entry 1Z87) with the Q13424 peptide fragment (GERWQRVLLSLA) labeled in red. Detailed data on predicted peptides can be found in Table 3

References

    1. London N, Raveh B, Schueler‐Furman O. Druggable protein–protein interactions – From hot spots to hot segments. Curr Opin Chem Biol. 2013;17:952–959. - PubMed
    1. Ivarsson Y, Jemth P. Affinity and specificity of motif‐based protein–protein interactions. Curr Opin Struct Biol. 2019;54:26–33. - PubMed
    1. Li P, Banjade S, Cheng H‐C, et al. Phase transitions in the assembly of multivalent signalling proteins. Nature. 2012;483:336–340. - PMC - PubMed
    1. Seo M‐H, Kim PM. The present and the future of motif‐mediated protein–protein interactions. Curr Opin Struct Biol. 2018;50:162–170. - PubMed
    1. Ren S, Uversky VN, Chen Z, Dunker AK, Obradovic Z. Short linear motifs recognized by SH2, SH3 and Ser/Thr kinase domains are conserved in disordered protein regions. BMC Genomics. 2008;9:S26. - PMC - PubMed

Publication types

MeSH terms