. 2020 Dec:14:62-72.
doi: 10.1016/j.ijpddr.2020.09.002. Epub 2020 Sep 20.

New insights into the use of a mite count reduction test for the detection of therapeutic acaricide efficacy in Psoroptes ovis in cattle

Affiliations

New insights into the use of a mite count reduction test for the detection of therapeutic acaricide efficacy in Psoroptes ovis in cattle

Wouter van Mol et al. Int J Parasitol Drugs Drug Resist. 2020 Dec.

Abstract

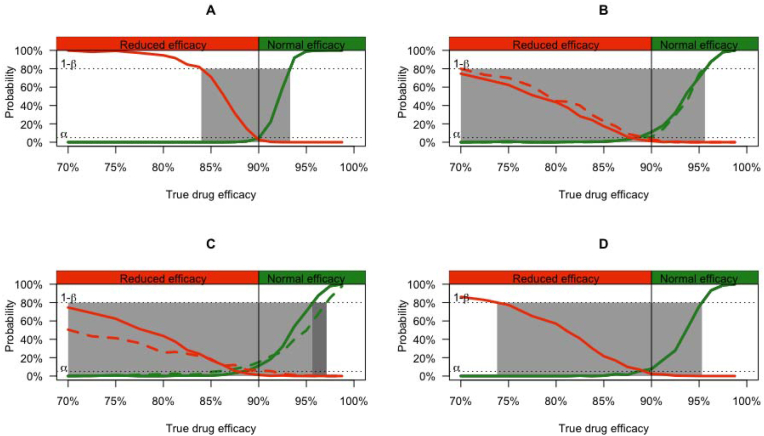
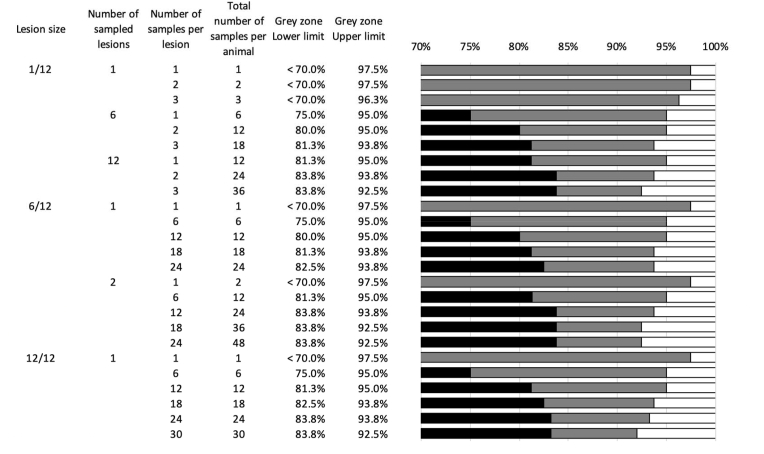
When used for the evaluation of drug efficacy against Psoroptes ovis, the diagnostic performance of different sampling strategies for a mite count reduction test (MCRT) remains unclear. In the present study, a novel simulation framework was constructed that accounted for relevant biological features of P. ovis infestations in cattle and that was parameterized with field data from 16 farms (154 animals). Second, this framework was applied to explore the impact of study specific factors (number of animals, number of sampled lesions, and number of scrapings per lesion) and biological factors (mite infestation intensity and size of lesions) on the diagnostic performance of MCRT. Its outcome provided a basis to determine the diagnostic performance of MCRT when it was applied according to the World Association for the Advancement in Veterinary Parasitology (WAAVP) and the European Medicine Agency (EMA) guidelines, and to formulate recommendations to ensure a good diagnostic performance of the MCRT. For both guidelines, the MCRT allowed to correctly detect (power 80%) reduced and normal efficacy when the therapeutic efficacy was <70%, and ≥95%, respectively. The results highlighted a reliable diagnostic performance of the MCRT when performed as recommended by WAAVP and EMA for the detection of normal drug efficacy. When used for the detection of reduced efficacy, therapeutic efficacies between 70% and 90% could not be detected with sufficient reliability. The diagnostic performance can be improved by increasing the total number of skin scrapings (increasing the number of animals, number of sampled lesions and/or number of samples per lesion). In order to help researchers and veterinarians to optimize the design of the MCRT to their field settings, the findings were translated into a simple tool.

Keywords: Acaricide resistance –Psoroptes ovis–cattle–mite count reduction test–monitoring drug efficacy.


Conflict of interest statement

The authors declare that they have no known competing financial interests or personal relationships that could have appeared to influence the work reported in this paper.

Figures

Image 1
Graphical abstract
Fig. 1
Fig. 1
General overview of the simulation framework for mite counts. On a given farm f (Level 1) with predetermined mean (μf), variation (σf) in mite counts and level of aggregation (kf), a number of animals (na) with their respective mean (μfa), variation (σfa) in mite counts and level of aggregation (kfa) were drawn (Level 2) from a negative binomial distribution (NBD) or Poisson distribution. Subsequently, 1000 skin areas were generated per animal and divided over their respective quintiles, each quintile representing a different level of mite infestation. From these quintiles, nllesions were proportionally1 - π5) drawn with their respective mean (μfal), variation (σfal) in mite counts and level of aggregation (kfal) (Level 3). Then, nsskin scrapings were sampled from these lesions with a surface equal to Sfal. Post-drug administration mite counts (MC) within each lesion were generated by multiplying the pre-drug administration by 1 – TDEd(= the true underlying drug efficacy of the drug d) and nsskin scrapings were sampled from the same lesion. The observed drug efficacy (ODE), consisting of the mite count reduction (MCR) and the 95% confidence intervals (95%CI), were calculated, resulting in the mite count reduction test (MCRT). Depending on the preferred definition of normal drug efficacy, MCR≥90% or MCR≥95%, efficacy was classified as either normal (lower limit (LL) of 95%CI was at least 90% or 95%) or reduced (upper limit (UL) of 95%CI was less than 90% or 95%). Finally, the outcome of the MCRT was compared to the true drug efficacy of the given mite population.
Fig. 2
Fig. 2
The parameterisation of a simulation framework for P. ovis mite counts. Panel A describes the distribution of mean mite counts per 9 cm2across 16 farms, whereas the full vertical line represents the median, and the vertical dashed lines indicate the 5th(left of median) and the 95thpercentile (right of median). Panel B illustrates the output of the linear regression model with the variance in mite counts at farm level (σ2f) as dependent variable and mean mite counts at farm level (μf) as independent variable. The black dots represent the data, the straight black line the estimated σ2fas function of μfand the red dashed lines represent the 95% prediction intervals. Panel C illustrates the distribution of the length and the width. The length of the individual animals is given on the horizontal axis, whereas the average width of an animal is given on the vertical axis. Panel D illustrates the output of the linear regression model with the variance in mite counts at animal level (σ2fa) as dependent variable and mean mite counts at animal level (μfa) as independent variable. The black dots represent the data, the straight black line the estimated σ2fas function of μfand the red dashed lines represent the 95% prediction intervals. Panel E describes the distribution of the mite counts found in lesions (black bars) and healthy skin areas (white bars) over 5 levels of mite infestation. Panel F illustrates the output of the linear model with the variance in mite counts at lesion level (σ2fal) as dependent variable and mean mite counts at lesion level (μfal) as independent variable. The black dots represent the data, the straight black line the estimated σ2fas function of μfand the red dashed lines represent the 95% prediction intervals. (For interpretation of the references to colour in this figure legend, the reader is referred to the Web version of this article.)
Fig. 3
Fig. 3
The maximum number of skin scrapings for different surfaces of lesions and mite reduction thresholds. The maximum number of scrapings of 9 cm2 for different surfaces of lesions that resulted in a mite reduction not exceeding 1% (green lines), 5% (red lines) and 10% (black lines) in at least half of the iterations. The size of the lesions is expressed as a proportion of an animal's back (1/12 to 12/12). The dot represents a medium sized animal (surface back = 4380 cm2), with the top and bottom whiskers representing a large (surface back = 6656 cm2) and small animal (surface back = 2592 cm2), respectively. (For interpretation of the references to colour in this figure legend, the reader is referred to the Web version of this article.)
Fig. 4
Fig. 4
The diagnostic performance of a mite count reduction test to detect reduced and normal drug efficacy against P. ovis across a selection of combinations. Panel A represents a general format of the results of the simulation of a given combination. The true underlying drug efficacy of drug d (TDEd) is given in the x-axis, with the reduced drug efficacy threshold (90%) represented by a vertical line. The probability (or proportion of iterations) is given in the y-axis. The green line represents the probability of classifying the efficacy of drug d as normal based on the mite count reduction test (MCRT), while the red line represents the probability of classifying the efficacy of drug d as reduced based on the MCRT. Type I (α) and type II errors (β) were set at 5% and 20% respectively. The grey area indicates the range of TDEdfor which α ≥5% or β ≥20. Panel B and C illustrate the WAAVP guidelines (Panel B: 6 animals and 6 skin scrapings per animal; Panel C: 2 skin scrapings per animal), and Panel D the EMA guideline (15 animals and 3 skin scrapings per animal). In each Panel, the green line depicts the probability of classifying the efficacy of drug d as normal based on the MCRT, while the red line represents the probability of classifying the efficacy of drug d as reduced based on the MCRT. In Panels B and C, the solid line represents multiple skin scrapings (Panel B: 6; Panel C: 2) taken from 1 lesion, whereas the dotted line indicates that 1 skin scraping was collected from multiple lesions (Panel B: 6; Panel C: 2). Type I (α) and type II errors (β) were set at 5% and 20%, respectively. The grey area indicates the range of TDEdfor which α ≥5% or β ≥20%. In these Figures, it was assumed that the mean infestation at the farm equalled 15.4 mites/9 cm2, all animals where of medium size (back=4380 cm2) and that only lesions covering 1/12 of the back where sampled. (For interpretation of the references to colour in this figure legend, the reader is referred to the Web version of this article.)
Fig. 5
Fig. 5
The diagnostic performance of MCRT for a farm with an average mite infestation in 10 medium sized animals. The grey zone of the different combinations is illustrated through the grey horizontal bar. The TDE values with a type II error <20% for the detection of normal and reduced efficacy are depicted by a white and black bar respectively. All combinations have a fixed mite infestation intensity (50th percentile = 15.4 mites/9 cm2) and a fixed number (n = 10) of medium sized (total surface back = 4380 cm2) animals.

Similar articles

References

    1. Adas An evidence base for new legislation and guidance for implementation of a compulsory treatment period for sheep scab. 2008. https://www.webarchive.org.uk/wayback/archive/20180516214411/http://www.... Wolverhampton.
    1. Bridi A.A., Carvalho L.A., Cramer L.G., Barrick R.A. Efficacy of a long-acting formulation of ivermectin against Psoroptes ovis (Hering, 1838) on cattle. Vet. Parasitol. 2001;97:277–283. - PubMed
    1. Committee for medicinal products for veterinary use CVMP Guideline on specific efficacy requirements for ectoparasiticides in cattle. 2005. https://www.ema.europa.eu/en/documents/scientific-guideline/guideline-sp...
    1. Danckaert S., Demuynck E., de Regt E., De Samber J., Lambrechts G., Lenders S., Vanhee M., Vervloet D., Vermeyen V., Vrints G. VLEESVEE. 2018. https://lv.vlaanderen.be/sites/default/files/attachments/gr_201807_lara2...
    1. Fischer K., Walton S. Parasitic mites of medical and veterinary importance – is there a common research agenda? Int. J. Parasitol. 2014;44:955–967. - PubMed