. 2020 Oct 6;33(1):108234.
doi: 10.1016/j.celrep.2020.108234. Epub 2020 Sep 19.

Evasion of Type I Interferon by SARS-CoV-2

Affiliations

Evasion of Type I Interferon by SARS-CoV-2

Hongjie Xia et al. Cell Rep. .

Abstract

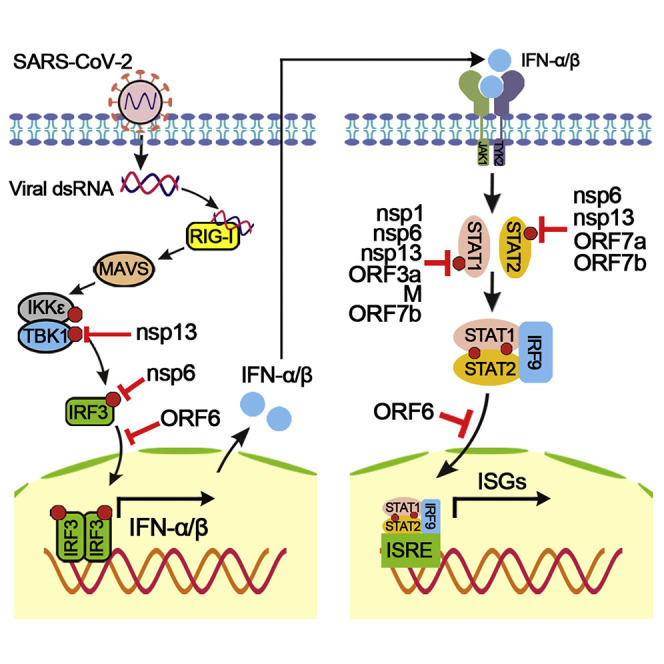
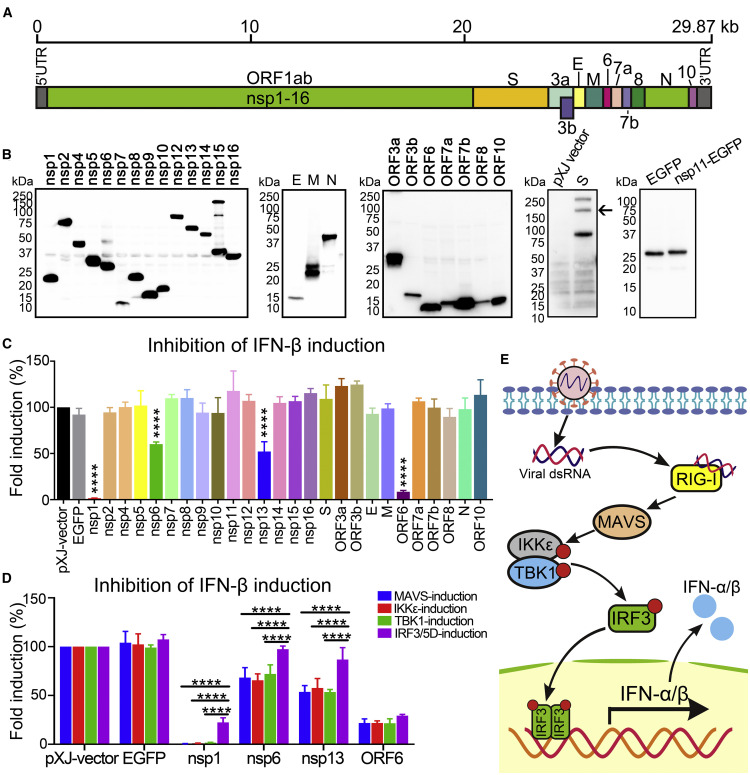
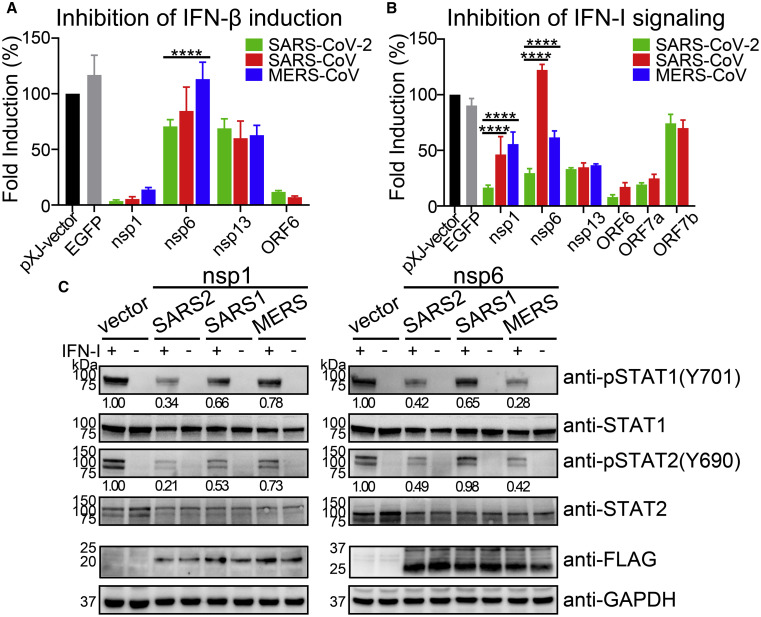
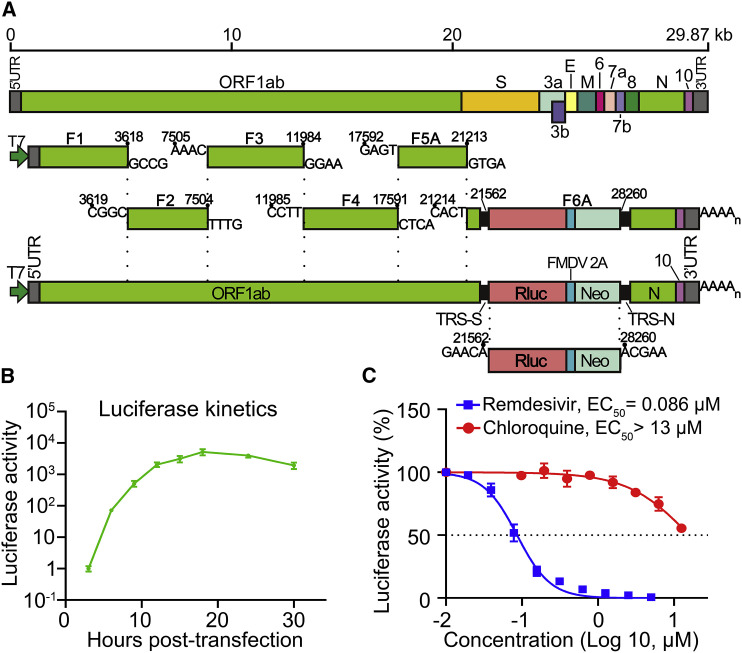
Severe acute respiratory syndrome coronavirus 2 (SARS-CoV-2) replication and host immune response determine coronavirus disease 2019 (COVID-19), but studies evaluating viral evasion of immune response are lacking. Here, we use unbiased screening to identify SARS-CoV-2 proteins that antagonize type I interferon (IFN-I) response. We found three proteins that antagonize IFN-I production via distinct mechanisms: nonstructural protein 6 (nsp6) binds TANK binding kinase 1 (TBK1) to suppress interferon regulatory factor 3 (IRF3) phosphorylation, nsp13 binds and blocks TBK1 phosphorylation, and open reading frame 6 (ORF6) binds importin Karyopherin α 2 (KPNA2) to inhibit IRF3 nuclear translocation. We identify two sets of viral proteins that antagonize IFN-I signaling through blocking signal transducer and activator of transcription 1 (STAT1)/STAT2 phosphorylation or nuclear translocation. Remarkably, SARS-CoV-2 nsp1 and nsp6 suppress IFN-I signaling more efficiently than SARS-CoV and Middle East respiratory syndrome coronavirus (MERS-CoV). Thus, when treated with IFN-I, a SARS-CoV-2 replicon replicates to a higher level than chimeric replicons containing nsp1 or nsp6 from SARS-CoV or MERS-CoV. Altogether, the study provides insights on SARS-CoV-2 evasion of IFN-I response and its potential impact on viral transmission and pathogenesis.

Keywords: COVID-19; SARS-CoV-2; coronavirus disease 2019; immune evasion; interferon; replicon; severe acute respiratory syndrome coronavirus 2.


Conflict of interest statement

Declaration of Interests The authors declare no competing interests.

Figures

None
Graphical abstract
Figure 1
Figure 1
SARS-CoV-2 Proteins Inhibit IFN-I Production (A) Genome structure of SARS-CoV-2. (B) Expression of SARS-CoV-2 proteins. C-Terminally FLAG-tagged viral proteins were expressed in HEK293T cells and analyzed by western blotting using anti-FLAG antibody. S protein was probed by anti-S antibody and is indicated by an arrow; an empty pXJ-plasmid-transfected cell lysate was included as a negative control. EGFP was fused to the C terminus of nsp11 and probed by anti-GFP antibody. All viral proteins were cloned from SARS-CoV-2 strain 2019-nCoV/USA_WA1/2020. (C) IFN-β promoter luciferase assay. HEK293T cells were co-transfected with Firefly luciferase reporter plasmid pIFN-β-luc, Renilla luciferase control plasmid phRluc-TK, viral protein expressing plasmid, and stimulator plasmid RIG-I (2CARD). Empty plasmid and EGFP-encoding plasmid were used as controls. Cells were assayed for luciferase activity at 24 hpt. The data were analyzed by normalizing the Firefly luciferase activity to the Renilla luciferase (Rluc) activity and then normalized by non-stimulated samples to obtain fold induction. Empty vector control was set to 100%. Statistics were determined by comparing with EGFP control and one-way ANOVA with Dunnett’s correction, ∗∗∗∗p < 0.0001. (D) MAVS-, IKKε-, TBK1-, or IRF3/5D-activated IFN-β promoter luciferase assay. The experiments were performed as in (C) except that the assay was activated by MAVS, IKKε, TBK1, or IRF3/5D. Data were from three independent experiments in triplicate (mean ± SD). Statistics were determined by comparing each respective IRF3/5D-induction group using two-way ANOVA with Dunnett’s correction, ∗∗∗∗p < 0.0001. (E) Scheme of RIG-I-mediated IFN-I production pathway.
Figure 2
Figure 2
SARS-CoV-2 Proteins Inhibit TBK1 and IRF3 Activation (A) Analysis of IRF3 phosphorylation. HEK293T cells were transfected with viral protein-encoding plasmid (1 μg); treated with poly(I:C) (10 μg); and analyzed for phosphorylated IRF3 (anti-pIRF3 at S396), total IRF3 (anti-IRF3), viral protein (anti-FLAG), and GAPDH (anti-GAPDH) by western blot. (B) Analysis of TBK1 phosphorylation. HEK293T cells were co-transfected with TBK1-expressing plasmid and varying amounts of nsp6- or nsp13-encoding plasmids. At 24 hpt, western blot was used to analyze the cell lysates for phosphorylated TBK1 (anti-pTBK1 at S172), total TBK1 (anti-TBK1), phosphorylated IRF3 (S396; anti-pIRF3), total IRF3 (anti-IRF3), viral nsp 6 or nsp13 (anti-FLAG), and GAPDH (anti-GAPDH). Protein band intensity was quantitated using Image Lab software. (C) Co-immunoprecipitation (coIP) of TBK1 and nsp6 or nsp13. HEK293T cells were co-transfected with plasmids expressing TBK1 and hemagglutinin (HA)-tagged nsp6 or nsp13. At 24 hpt, whole-cell lysate (WCL) was incubated with anti-HA beads for immunoprecipitation and TBK1 was detected by western blot. (D) Nuclear translocation of IRF3. A549 cells were transfected with ORF6-expressing plasmid. At 24 hpt, cells were treated with poly(I:C) and fixed with 4% paraformaldehyde and permeabilized with 0.1% Triton X-100. After blocking with PBS containing 2% fetal bovine serum (FBS) and 0.1% Tween 20, the cells were probed with primary antibodies (anti-FLAG and anti-IRF3) and secondary antibodies (anti-Alexa Fluor 488 and anti-Alexa Fluor 568). Images were obtained using a fluorescence microscope and analyzed by ImageJ. Scale bar, 10 μm. (E) coIP of ORF6 and KPNA1–6. HEK293T cells were co-transfected with FLAG-tagged ORF6-expressing plasmid and HA-tagged KPNA1–6 plasmid or empty plasmid. At 24 hpt, coIP was performed by incubating anti-HA antibody overnight, followed by addition of magnetic beads. After extensively washing, the eluate was analyzed by western blot with indicated antibodies. (F) Summary of antagonism of IFN-I production. The inhibitory steps are indicated for individual viral proteins.
Figure 3
Figure 3
SARS-CoV-2 Proteins Block IFN-I Signaling (A) ISRE promoter luciferase assay. HEK293T cells were co-transfected with an ISRE promoter-driven Firefly luciferase reporter plasmid pISRE-luc, Renilla luciferase control plasmid phRluc-TK, and viral protein expressing plasmid. At 24 hpt, cells were treated 1,000 U/mL IFN-α for 8 h, followed by dual-luciferase reporter assays. Data processing was the same as described in Figure 1. Error bars indicate SDs from three independent experiments. Statistical values were determined by comparing with EGFP control and one-way ANOVA with Dunnett’s correction, p < 0.05, ∗∗p < 0.01, ∗∗∗p < 0.001, ∗∗∗∗p < 0.0001. (B) Inhibition of STAT1 and STAT2 phosphorylation. HEK293T cells were transfected with viral protein expressing plasmids. At 24 hpt, cells were treated with 1,000 U/mL IFN-α for 30 min and analyzed by western blot using anti-phosphorylated STAT1 at Y701, anti-total STAT1, anti-phosphorylated STAT2 at Y690, and anti-total STAT2 antibodies. Protein band intensity was quantitated using Image Lab software. (C) Nuclear translocation of STAT1. Vero cells were transfected with ORF6 expressing plasmids for 24 h, treated with 1,000 U/mL IFN-α for 30 min, fixed and permeabilized, and probed with anti-STAT1 and anti-FLAG as primary antibodies and anti-Alexa Fluor 488 and anti-Alexa Fluor 568 as secondary antibodies. Images were obtained through fluorescence microscope and analyzed using ImageJ. Scale bar, 10 μm. (D) Summary of antagonism of IFN-I signaling. The inhibitory steps are indicated for individual viral proteins.
Figure 4
Figure 4
Comparison of IFN-I Inhibition by Different Coronaviruses (A) IFN-β promoter luciferase assay. Viral proteins from SARS-CoV-2 (2019-nCoV/USA_WA1/2020, GenBank: MN985325), SARS-CoV (SARS MA15 strain, GenBank: DQ497008), and MERS-CoV (MERS EMC/2012 strain, GenBank: JX869059) were compared for their inhibition of IFN-I production. RIG-I-induced IFN-β promoter luciferase assay was performed by co-transfection of HEK293T cells as described in Figure 1. (B) ISRE promoter luciferase assay. HEK293T cells were co-transfected with pISRE-luc luciferase reporter plasmid, phRluc-TK control plasmid, and viral protein expressing plasmid. At 24 hpt, the cells were treated with 1,000 U/mL IFN-α and assayed for luciferase activities after 8 h. Error bars represent mean ± SD from three independent experiments. Statistical significance was determined by comparing with SARS-CoV-2 and two-way ANOVA with Dunnett’s correction, p < 0.05, ∗∗p < 0.01, ∗∗∗p < 0.001, ∗∗∗∗p < 0.0001. (C) Western blot of phosphorylated STAT1 and STAT2. HEK293T cells were transfected with viral protein expressing plasmid and then treated with 1,000 U/mL IFN-α at 24 hpt for 30 min. Western blot was performed to analyze the cell lysates using anti-phosphorylated STAT1 (Y701) and STAT2 (Y690), and anti-total STAT1 and STAT2 antibodies. Protein band intensities were quantitated by Image Lab software.
Figure 5
Figure 5
A SARS-CoV-2 Luciferase Replicon (A) Construction of SARS-CoV-2 luciferase replicon. The replicon was constructed by deleting nucleotides 21,563–28,259 from the SARS-CoV-2 genome. The deleted viral segment was replaced by a Rluc, a foot-and-mouth disease virus 2A (FMDV 2A), and a neomycin phosphotransferase (Neo). The Rluc/FMDV 2A/Neo reporter is under the control of transcription regulatory sequence (TRS) of the deleted S gene. Replicon cDNA was assembled by six contiguous cDNA fragments through in vitro ligation. Replicon RNA was in vitro transcribed. (B) Replicon luciferase assay. Huh-7 cells were co-electroporated with replicon RNA and N-encoding mRNA (20 μg), seeded into a 48-well plate, and assayed for Rluc activities at indicated time points. (C) Antiviral testing of remdesivir and chloroquine. Huh-7 cells, electroporated with replicon RNA from (B), were seeded into a 96-well plate (50 μL per well), treated with compounds (50 μL per well) for 24 h, and quantified for Rluc activities. The DMSO control treatment was set to 100%. Data are mean ± SD from three independent experiments. EC50 values were calculated by nonlinear regression.
Figure 6
Figure 6
Effects of SARS-CoV and MERS-CoV nsp1 and nsp6 on SARS-CoV-2 Replication (A) SARS-CoV-2 replicon (RlucRep-SARS-CoV-2) and chimeric replicons containing SARS-CoV or MERS-CoV nsp1 or nsp6. (B–E) Transient replicon assay and IFN-α inhibition. BHK-21 cells were co-electroporated with different replicon RNAs and N-encoding mRNA (20 μg), seeded into 48-well plates, and harvested at different time points to indicate viral replication. Data were normalized by luciferase activities at 3 hpt. (B and D) Alternatively, the electroporated cells in the 48-well plates were treated with IFN-α for 24 h and assayed for luciferase activities. The data were normalized by non-treated group. (C and E) Data are mean ± SD from three independent experiments. Statistical values were analyzed by comparing with RlucRep-SARS-CoV-2 and two-way ANOVA with Dunnett’s correction, p < 0.05, ∗∗p < 0.01, ∗∗∗p < 0.001, ∗∗∗∗p < 0.0001.

Similar articles

Cited by

References

    1. Acharya D., Liu G., Gack M.U. Dysregulation of type I interferon responses in COVID-19. Nat. Rev. Immunol. 2020;20:397–398. - PMC - PubMed
    1. Angelini M.M., Akhlaghpour M., Neuman B.W., Buchmeier M.J. Severe acute respiratory syndrome coronavirus nonstructural proteins 3, 4, and 6 induce double-membrane vesicles. MBio. 2013;4:e00524-13. - PMC - PubMed
    1. Assiri A., Al-Tawfiq J.A., Al-Rabeeah A.A., Al-Rabiah F.A., Al-Hajjar S., Al-Barrak A., Flemban H., Al-Nassir W.N., Balkhy H.H., Al-Hakeem R.F., et al. Epidemiological, demographic, and clinical characteristics of 47 cases of Middle East respiratory syndrome coronavirus disease from Saudi Arabia: a descriptive study. Lancet Infect. Dis. 2013;13:752–761. - PMC - PubMed
    1. Au-Yeung N., Mandhana R., Horvath C.M. Transcriptional regulation by STAT1 and STAT2 in the interferon JAK-STAT pathway. JAK-STAT. 2013;2:e23931. - PMC - PubMed
    1. Balachandran S., Roberts P.C., Brown L.E., Truong H., Pattnaik A.K., Archer D.R., Barber G.N. Essential role for the dsRNA-dependent protein kinase PKR in innate immunity to viral infection. Immunity. 2000;13:129–141. - PubMed

Publication types

MeSH terms