. 2020 Oct 29;183(3):730-738.e13.
doi: 10.1016/j.cell.2020.09.018. Epub 2020 Sep 6.

Molecular Architecture of the SARS-CoV-2 Virus

Affiliations

Molecular Architecture of the SARS-CoV-2 Virus

Hangping Yao et al. Cell. .

Abstract

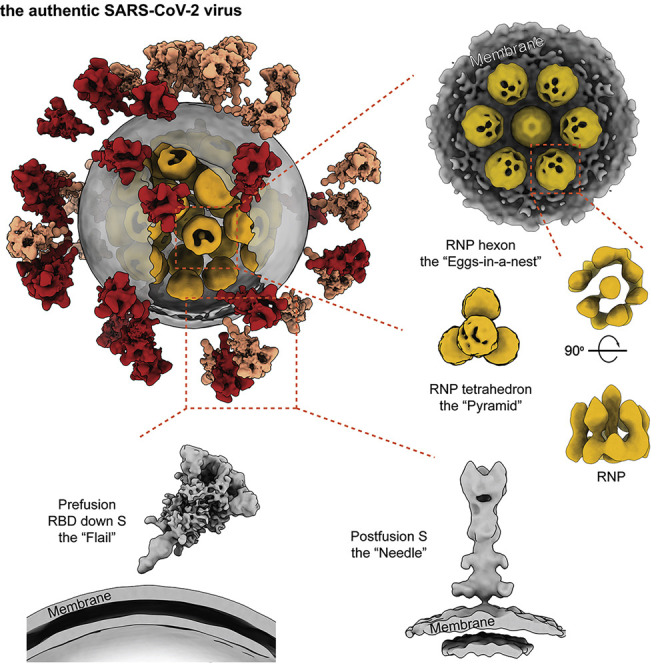
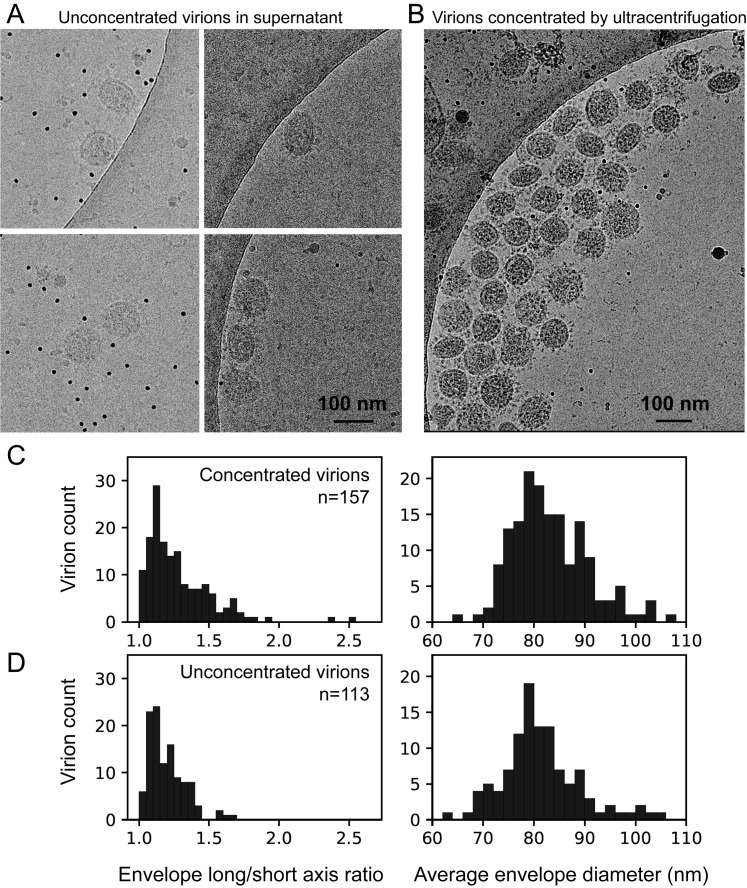
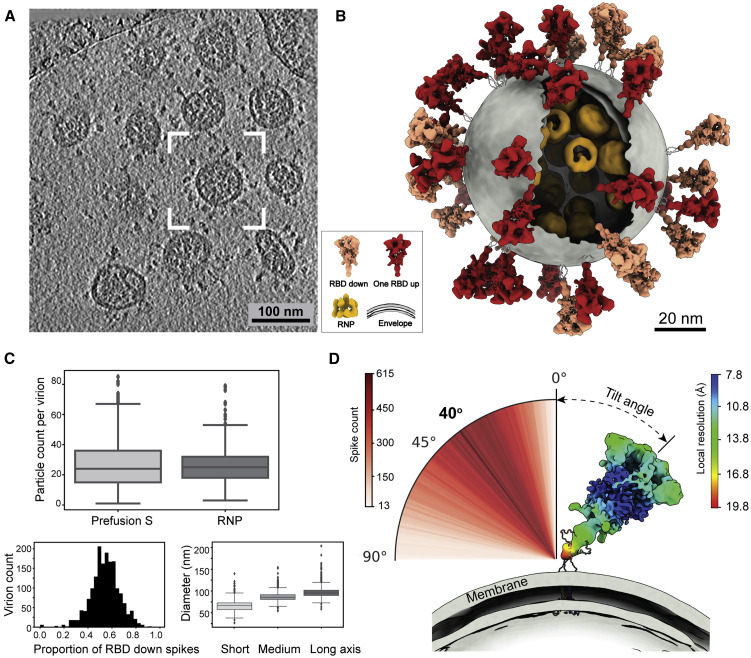
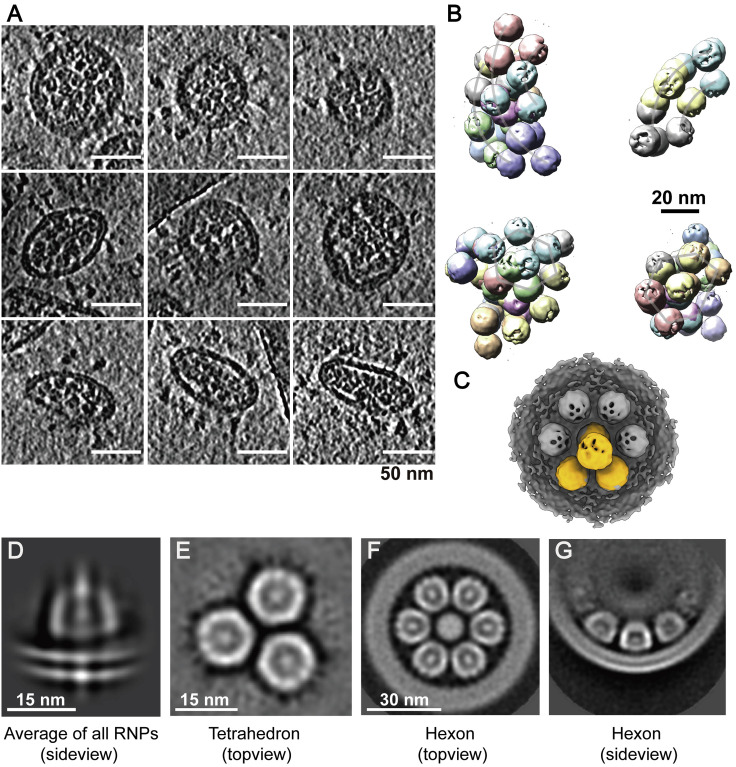
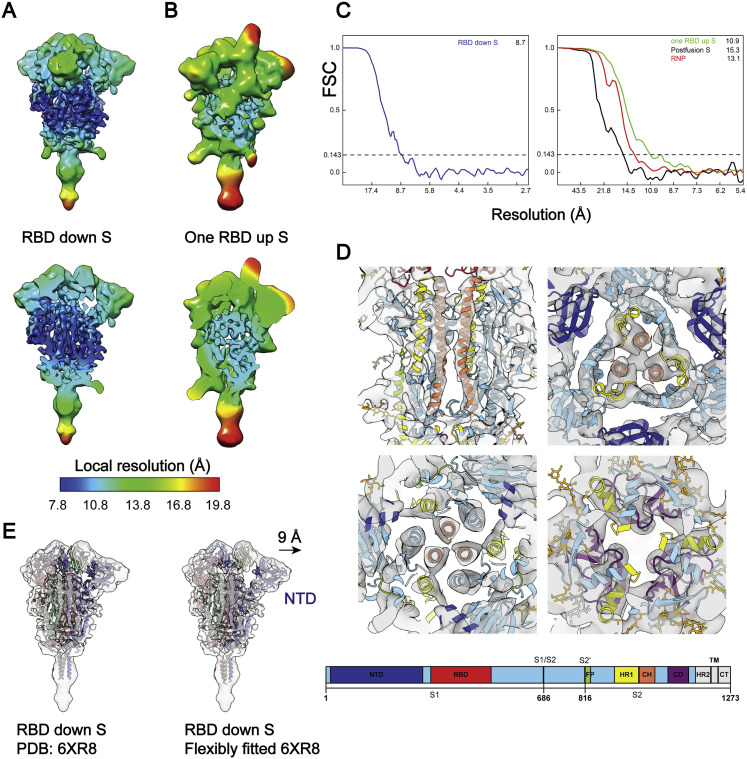
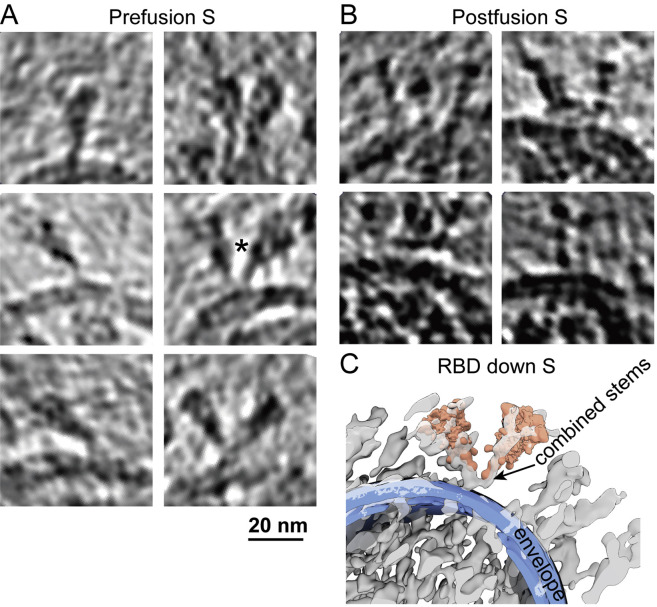
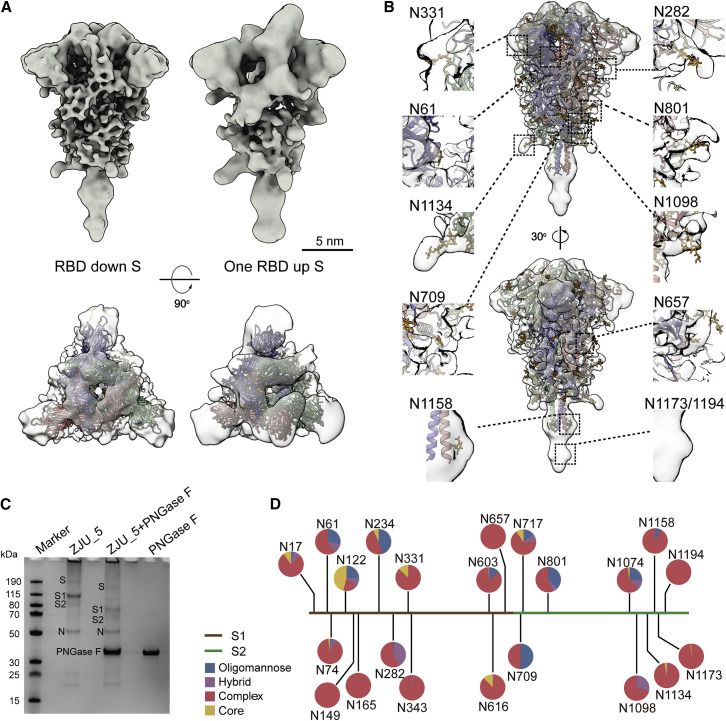
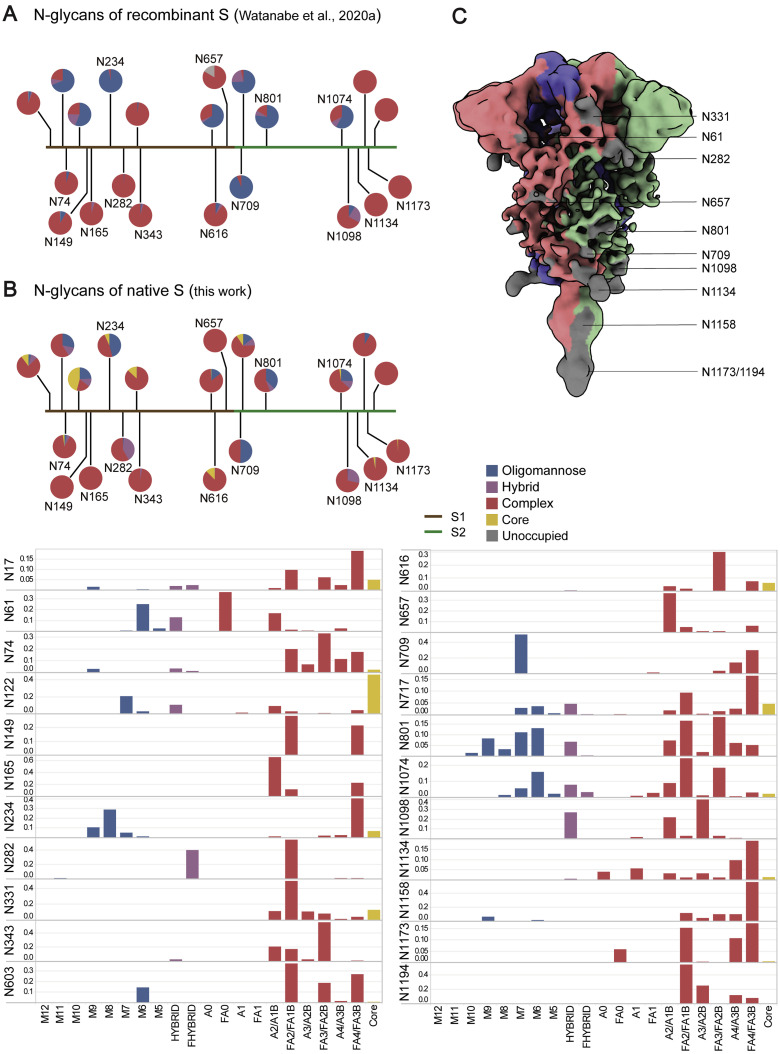
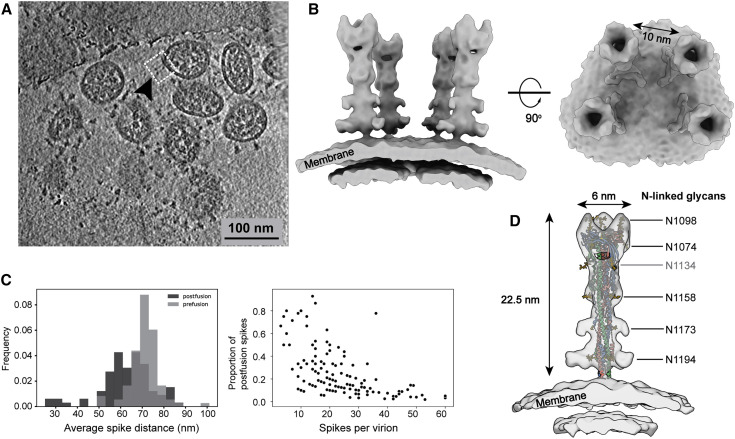
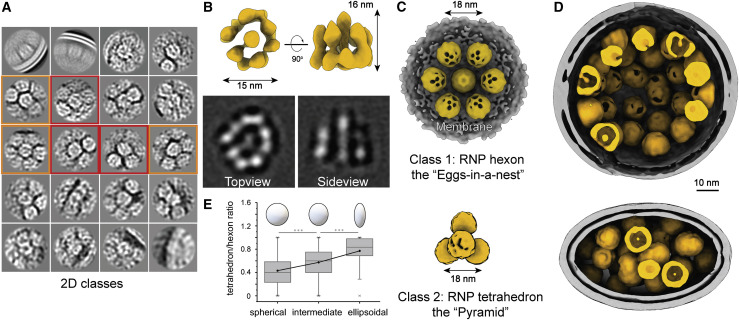
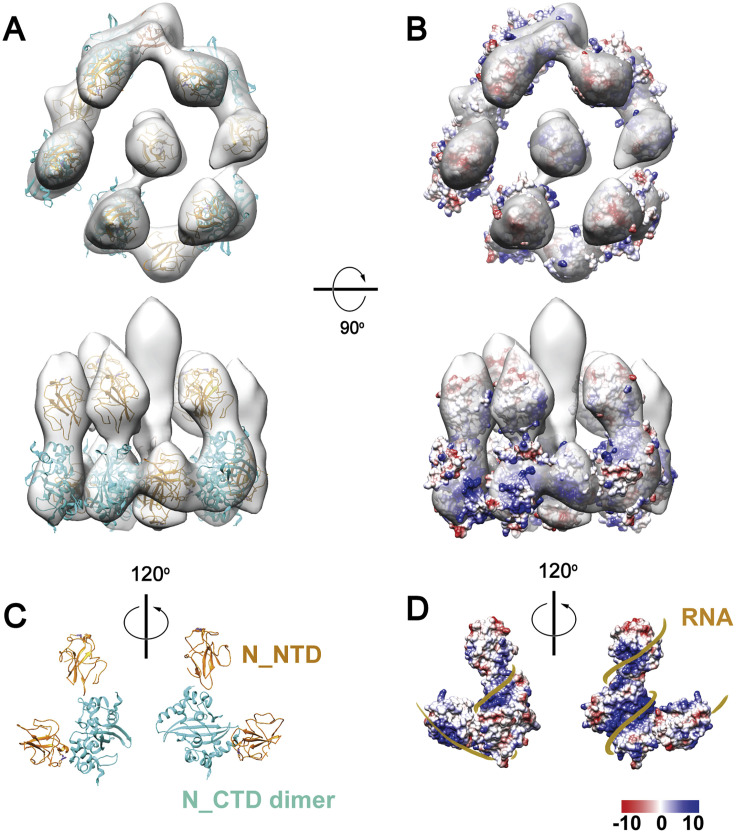
SARS-CoV-2 is an enveloped virus responsible for the COVID-19 pandemic. Despite recent advances in the structural elucidation of SARS-CoV-2 proteins, the detailed architecture of the intact virus remains to be unveiled. Here we report the molecular assembly of the authentic SARS-CoV-2 virus using cryoelectron tomography (cryo-ET) and subtomogram averaging (STA). Native structures of the S proteins in pre- and postfusion conformations were determined to average resolutions of 8.7-11 Å. Compositions of the N-linked glycans from the native spikes were analyzed by mass spectrometry, which revealed overall processing states of the native glycans highly similar to that of the recombinant glycoprotein glycans. The native conformation of the ribonucleoproteins (RNPs) and their higher-order assemblies were revealed. Overall, these characterizations revealed the architecture of the SARS-CoV-2 virus in exceptional detail and shed light on how the virus packs its ∼30-kb-long single-segmented RNA in the ∼80-nm-diameter lumen.

Keywords: SARS-CoV-2; coronavirus; cryo-EM; cryo-electron tomography; ribonucleoprotein; spike glycoprotein; subtomogram averaging; virus assembly; virus structure.


Conflict of interest statement

Declaration of Interests The authors declare no competing interests.

Figures

None
Graphical abstract
Figure S1
Figure S1
Comparison of Unconcentrated and Concentrated SARS-CoV-2 Virions, Related to Figure 1 Cryo-electron microscopy of virions present in the supernatant of infected Vero cells (A), and virions concentrated by ultracentrifugation (B), showing both spherical and ellipsoidal particles. The long/short axis ratio, as well as the average diameters of the viral envelope measured from the micrographs, are similar between the concentrated (157 virions) (C) and unconcentrated (113 virions) virions (D).
Figure 1
Figure 1
The Molecular Architecture of the SARS-CoV-2 Virus (A) A representative tomogram slice (5 Å thick) showing pleomorphic SARS-CoV-2 virions. (B) A representative virus (boxed in A) is reconstructed by projecting the prefusion S in the “RBD down” conformation (salmon) and “one RBD up” conformation (red), the lipid envelope (gray), and RNPs (yellow) onto their refined coordinates. RNPs away from the envelope are hidden for clarity. The unsolved stem regions of the spikes are sketched from a predicted model (https://zhanglab.ccmb.med.umich.edu/COVID-19). (C) Summary of structural observations. Top: number of prefusion Ss and RNPs per virion. An average of 26 prefusion Ss and RNPs are found in a virion. Bottom left: ratio of the S proteins between the “RBD down” and “one RBD up” conformations. An average of 54% prefusion Ss are in the “RBD down” conformation. Bottom right: statistics of the dimension of SARS-CoV-2 viral envelopes. The average diameters for the short, medium, and long axis of the envelope are 64.8, 85.9, and 96.6 nm, respectively. A boxplot shows the outliers, minimum, first quartile, medium, third quartile, and maximum of the data. (D) Distribution of the spike tilt angle reveals a prevailing tilt of 40° relative to the normal axis of the envelope. Shown is a representative “RBD down” spike in authentic orientation to the envelope (gray). The spike is colored by local resolution, and the predicted model of the stem is fitted for illustration purpose. See also Figure S1 and Video S1.
Figure S5
Figure S5
Ultrastructure of the RNPs, Related to Figure 4 (A) Example tomogram slices (lowpassed to 80 Å) of in situ RNP assembly. Thickness of the slice is 5 Å. (B) RNP tetrahedrons are projected onto their coordinates to show their characteristic higher-order organization. (C) An RNP tetrahedron is overlaid with hexon, showing identical spacing between two neighboring RNPs on either of the assembly. (D) Lipid bilayer density appears, when all RNPs are aligned and averaged using a large spherical mask. (E-G) Topview and sideview of the RNP tetrahedron and hexon reconstructions, showing RNPs are tightly packed in the viral lumen.
Figure S3
Figure S3
Local Resolution and Fourier Shell Correlation (FSC) Curves, Related to Figure 2 (A, B) Maps of prefusion S in RBD down or one RBD up conformations are colored by their local resolution ranging between 7.8-19.8 Å. Among all domains, the central helical (CH) region is the best resolved, as evidenced by tubular densities of the alpha-helix bundles. (C) Resolution of the spikes in RBD down, one RBD up, the postfusion conformations, and the RNP was estimated from the FSC curves, using a criterion 0.143. (D) The best solved domains of the RBD down S, HR1 and CH from the S2 subunit, are highlighted with the fitted PDB: 6XR8. The domains are colored as in the schematic. NTD, N-terminal domain; RBD, receptor binding domain; S1/S2, S1/S2 cleavage site; S2′, S2′ cleavage site; FP, fusion peptide; HR1, heptad repeat 1; CH, central helix; CD, connector domain; HR2, heptad repeat 2; TM, transmembrane anchor; CT, cytoplasmic tail. (E) Comparison of the rigidly and flexibly fitted PDB: 6XR8 to the RBD down S. The NTD has shifted by 9 Å away from the CH (centroid distance).
Figure S2
Figure S2
Example Tomogram Slices of Spikes, Related to Figures 1 and 3 S in (A) prefusion (5 Å thick) and (B) postfusion (5 nm thick) conformations. (C) A representative pair of Y-shaped spikes in RBD down conformation (marked with in A) is illustrated by projecting the refined structures onto their coordinates and overlaying with the raw tomogram (lowpassed to 80 Å resolution).
Figure 2
Figure 2
The Native Structure of the S Protein in the Prefusion Conformation (A) S in the “RBD down” (resolution, 8.7 Å; threshold, 1.2) and “one RBD up” (resolution, 10.9 Å; threshold, 1.5) conformations. Shown are a side view (top) and top view (bottom) of the maps fitted with PDB: 6XR8, 6VYB. (B) The “RBD down” S maps fitted with PDB: 6XR8. Densities of ten glycans are highlighted in the insets. (C) Compositional analysis of the virus sample. The treated viruses, designated ZJU_5, were resolved by SDS-PAGE and visualized by Coomassie blue staining. Lane 1, protein ladder; lane 2, purified ZJU_5; lane 3, ZJU_5 treated with PNGase F; lane 4, PNGase F as control. After PNGase F treatment, the molecular weight of the S1 subunit is reduced by ~30 kDa and that of S2 by ~20 kDa. (D) Compositional analysis of the surface glycans. The identity and proportion of 22 N-linked glycans from the native S glycans were analyzed by MS and are presented in pie charts. See also Figures S3 and S4.
Figure S4
Figure S4
N-linked Glycans of the Native S Proteins, Related to Figure 2 (A) Glycan composition of recombinant S, as reported by Watanabe et al. (2020a). (B) Glycan composition of the native full-length S (Oligomannose: M12-M5; Hybrid: Hybrid, Fhybrid; Complex: A0, FA0, A1, FA1, A2/A1B, FA2/FA1B, A3/A2B, FA3/FA2B, A4/A3B, FA4/FA3B). Please check the attached excel data form for the detailed glycan composition. (C) The RBD down S colored by its oligomer subunits. Densities of ten glycans are visible on the map (gray).
Figure 3
Figure 3
The Native Structure of S2 in the Postfusion Conformation (A) A representative tomogram slice (5 nm thick), showing a cluster of spikes in the postfusion conformation on a SARS-CoV-2 virion. (B) 3D reconstructions of S2 in the postfusion state. The boxed region in (A) is reconstructed by projecting the solved postfusion S structure onto the refined coordinates. Resolution, 15.3 Å; threshold, 1.0. (C) Distribution of the postfusion Ss. Left: statistics indicate that the postfusion Ss are closer to each other on the viral surface compared with the prefusion Ss. Right: viruses possessing less spikes in total tend to have more postfusion Ss (only virions possessing postfusion Ss were counted). (D) The postfusion S structure fitted with PDB: 6XRA, displaying densities of N1098, N1074, N1158, N1173, and N1194. The density of N1134 is not visible on the map and is colored gray.
Figure 4
Figure 4
Native Assembly of the Ribonucleoproteins (RNPs) (A) 2D class averages of RNPs reveal two distinct types of RNP ultrastructure: hexameric (boxed in orange) and tetrahedral (boxed in red) assembly. (B) 3D reconstruction and 2D slices of the RNP. Resolution, 13.1 Å; threshold, 1.0. (C) Ultrastructure of the RNP hexon and tetrahedron assemblies. Seven RNPs are packed against the viral envelope (gray), forming an “eggs in a nest”-shaped hexagonal assembly (top). Four RNPs are packed as a membrane-free tetrahedral assembly (bottom), most of which were found in the virus away from the envelope. The structural features of the RNPs on the assembly are smeared because of the symmetry mismatch between individual RNPs and the assembly. (D) Representative projection of RNP hexons assembling into a spherical virus and tetrahedrons into an ellipsoidal virus. (E) Statistics of the ratio of tetrahedron/hexon assembly reveals that spherical and ellipsoidal virions are more likely to be packed with hexons and tetrahedrons, respectively. The ratio is estimated by sorting 382 virions that have over 5 RNP assemblies by their ratio of long/short axis and counting their ratio of tetrahedron to hexon RNPs. A boxplot shows the minimum, first quartile, medium, third quartile, and maximum of the data. See also Figure S5, Figure S6, Figure S7.
Figure S6
Figure S6
A Tentative Model of the SARS-CoV-2 RNP, Related to Figure 4 (A) Alignment of all single RNPs in regardless of their assembly types using a tight spherical mask revealed a 13.1 Å resolution reverse G-shaped architecture of the RNP, measuring 15 nm in diameter and 16 nm in height. (C) The map was segmented into five head-to-tail reverse L-shaped densities, each fitted with a pair of N (N_NTD: 6WKP, N_CTD: 6WJI) dimerized by the N-CTD, leaving two upper segments unoccupied. Based on the electrostatic potential distribution on the surface of the decamer (B), we propose a tentative model of RNP winded with RNA (D).
Figure S7
Figure S7
Environmental Challenges for SARS-CoV-2 Virions, Related to Figure 4 (A-C) SARS-CoV-2 virions remained intact after five cycles of freeze-and-thaw treatment, as shown by negative staining microscopy.

References

    1. Bárcena M., Oostergetel G.T., Bartelink W., Faas F.G., Verkleij A., Rottier P.J., Koster A.J., Bosch B.J. Cryo-electron tomography of mouse hepatitis virus: Insights into the structure of the coronavirion. Proc. Natl. Acad. Sci. USA. 2009;106:582–587. - PMC - PubMed
    1. Belouzard S., Chu V.C., Whittaker G.R. Activation of the SARS coronavirus spike protein via sequential proteolytic cleavage at two distinct sites. Proc. Natl. Acad. Sci. USA. 2009;106:5871–5876. - PMC - PubMed
    1. Bharat T.A.M., Scheres S.H.W. Resolving macromolecular structures from electron cryo-tomography data using subtomogram averaging in RELION. Nat. Protoc. 2016;11:2054–2065. - PMC - PubMed
    1. Cai Y., Zhang J., Xiao T., Peng H., Sterling S.M., Walsh R.M., Jr., Rawson S., Rits-Volloch S., Chen B. Distinct conformational states of SARS-CoV-2 spike protein. Science. 2020:eabd4251. - PMC - PubMed
    1. Cao L., Pauthner M., Andrabi R., Rantalainen K., Berndsen Z., Diedrich J.K., Menis S., Sok D., Bastidas R., Park S.R. Differential processing of HIV envelope glycans on the virus and soluble recombinant trimer. Nat. Commun. 2018;9:3693. - PMC - PubMed

Publication types