. 2020 Dec;47(12):6470-6483.
doi: 10.1002/mp.14494. Epub 2020 Oct 20.

Deterministic linear Boltzmann transport equation solver for patient-specific CT dose estimation: Comparison against a Monte Carlo benchmark for realistic scanner configurations and patient models

Affiliations

Deterministic linear Boltzmann transport equation solver for patient-specific CT dose estimation: Comparison against a Monte Carlo benchmark for realistic scanner configurations and patient models

Sara Principi et al. Med Phys. 2020 Dec.

Abstract

Purpose: Epidemiological evidence suggests an increased risk of cancer related to computed tomography (CT) scans, with children exposed to greater risk. The purpose of this work is to test the reliability of a linear Boltzmann transport equation (LBTE) solver for rapid and patient-specific CT dose estimation. This includes building a flexible LBTE framework for modeling modern clinical CT scanners and to validate the resulting dose maps across a range of realistic scanner configurations and patient models.

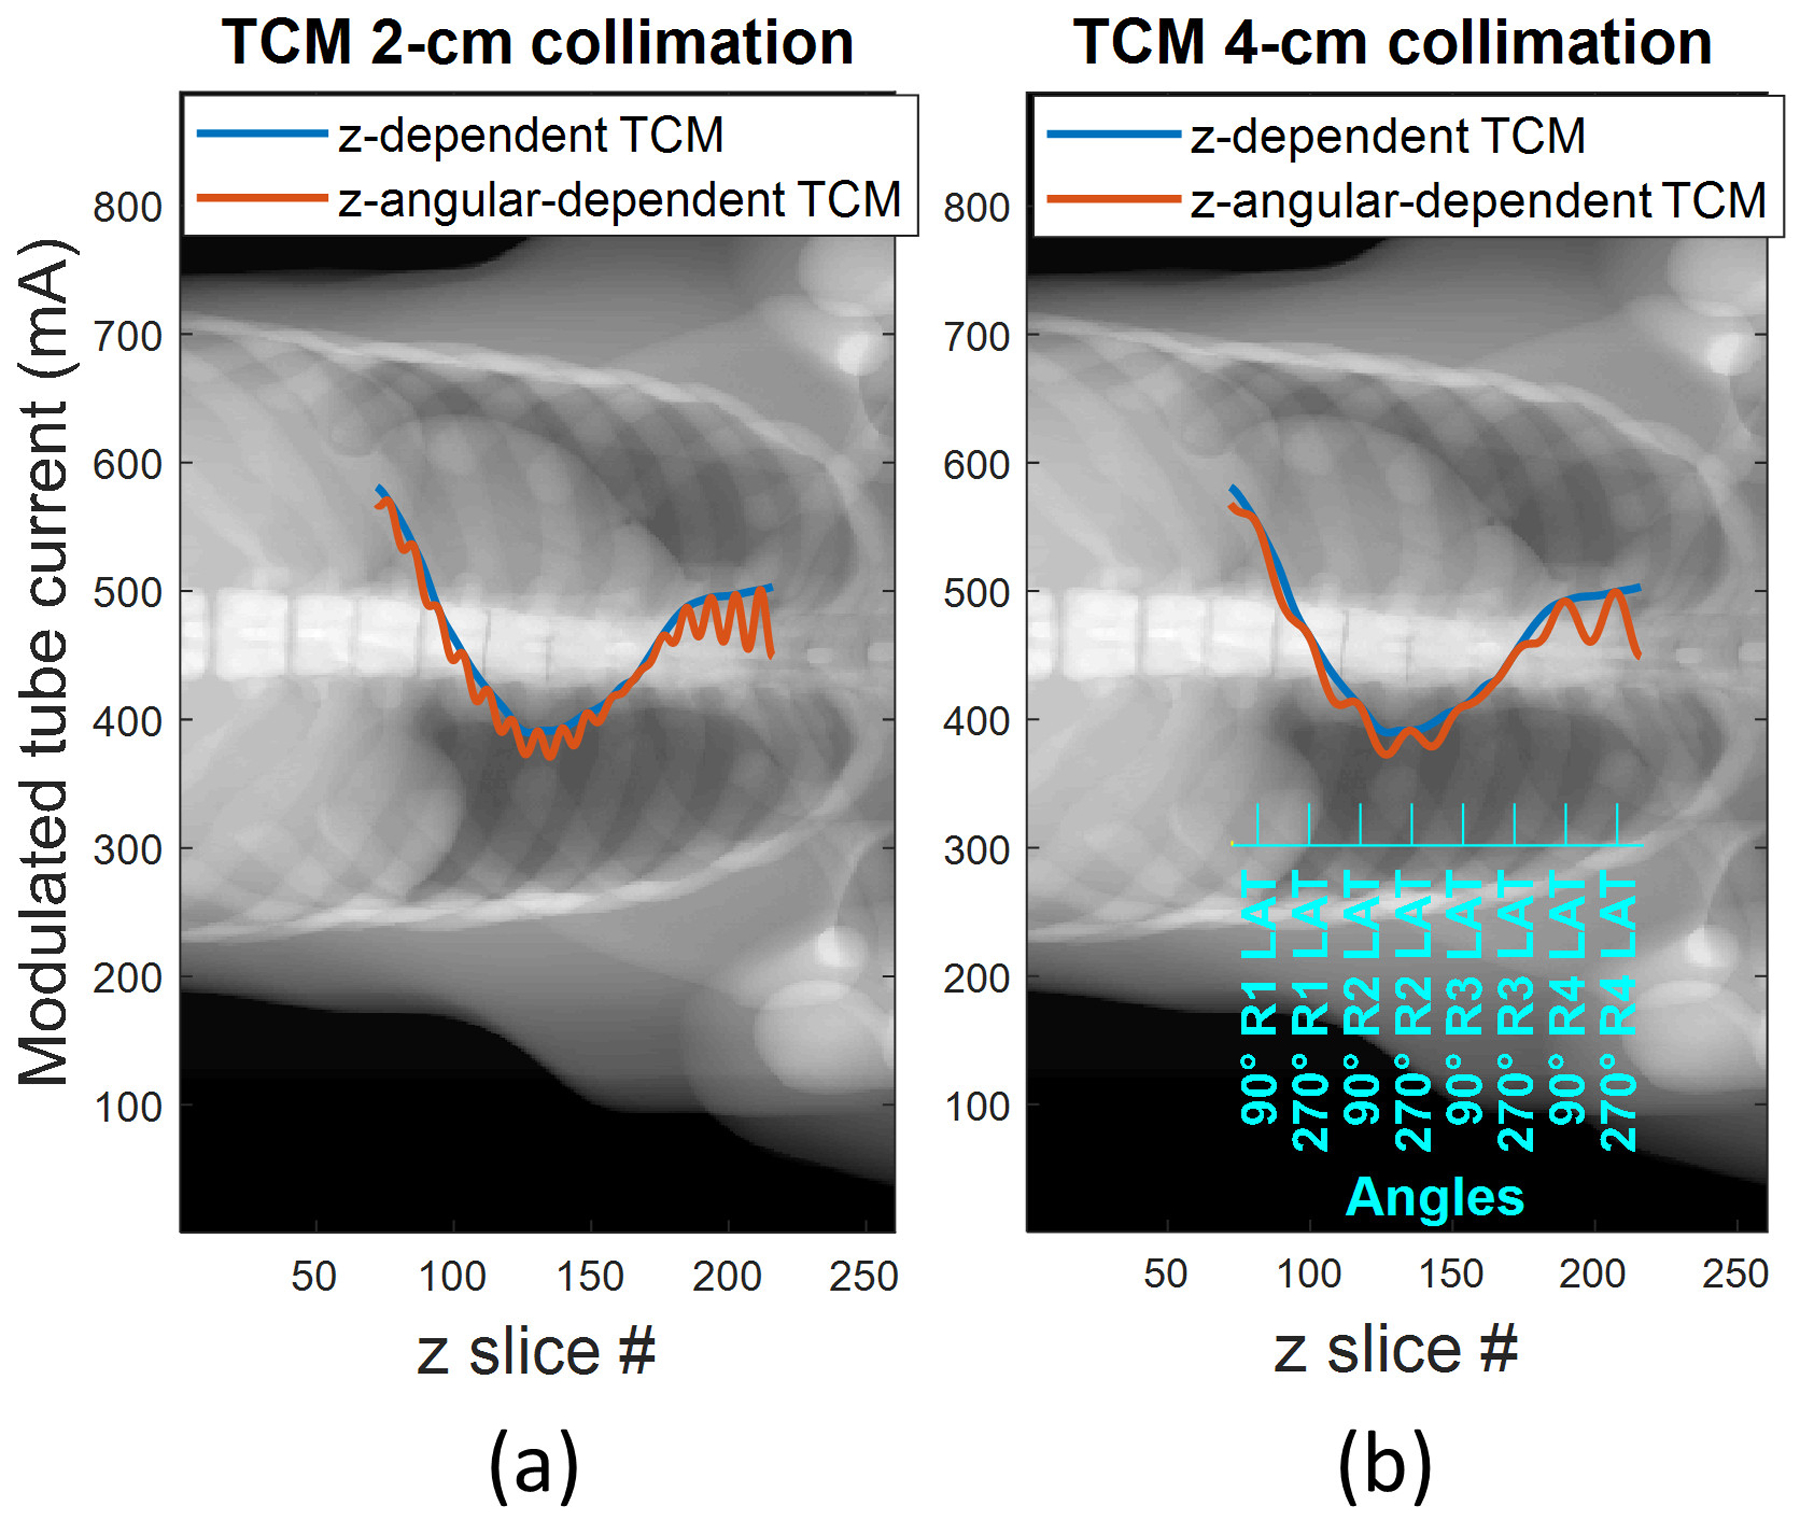
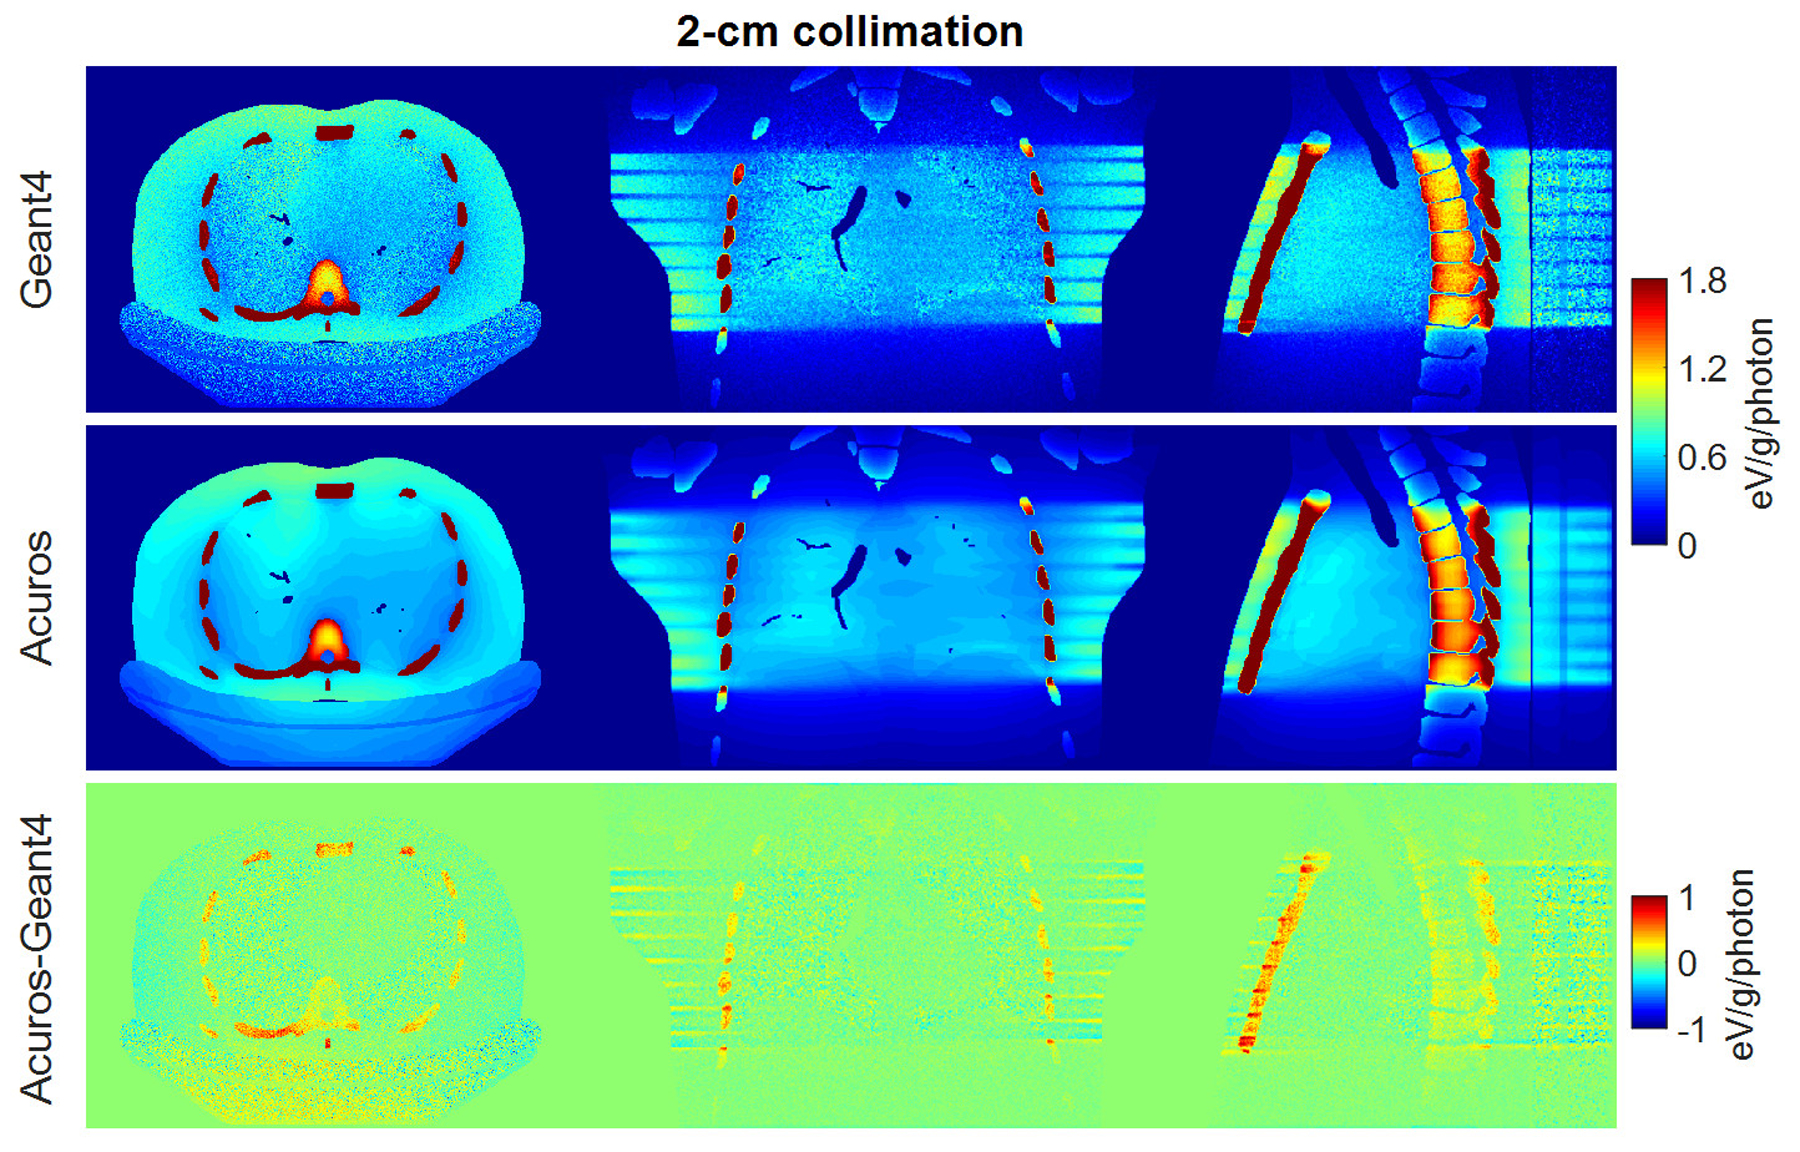
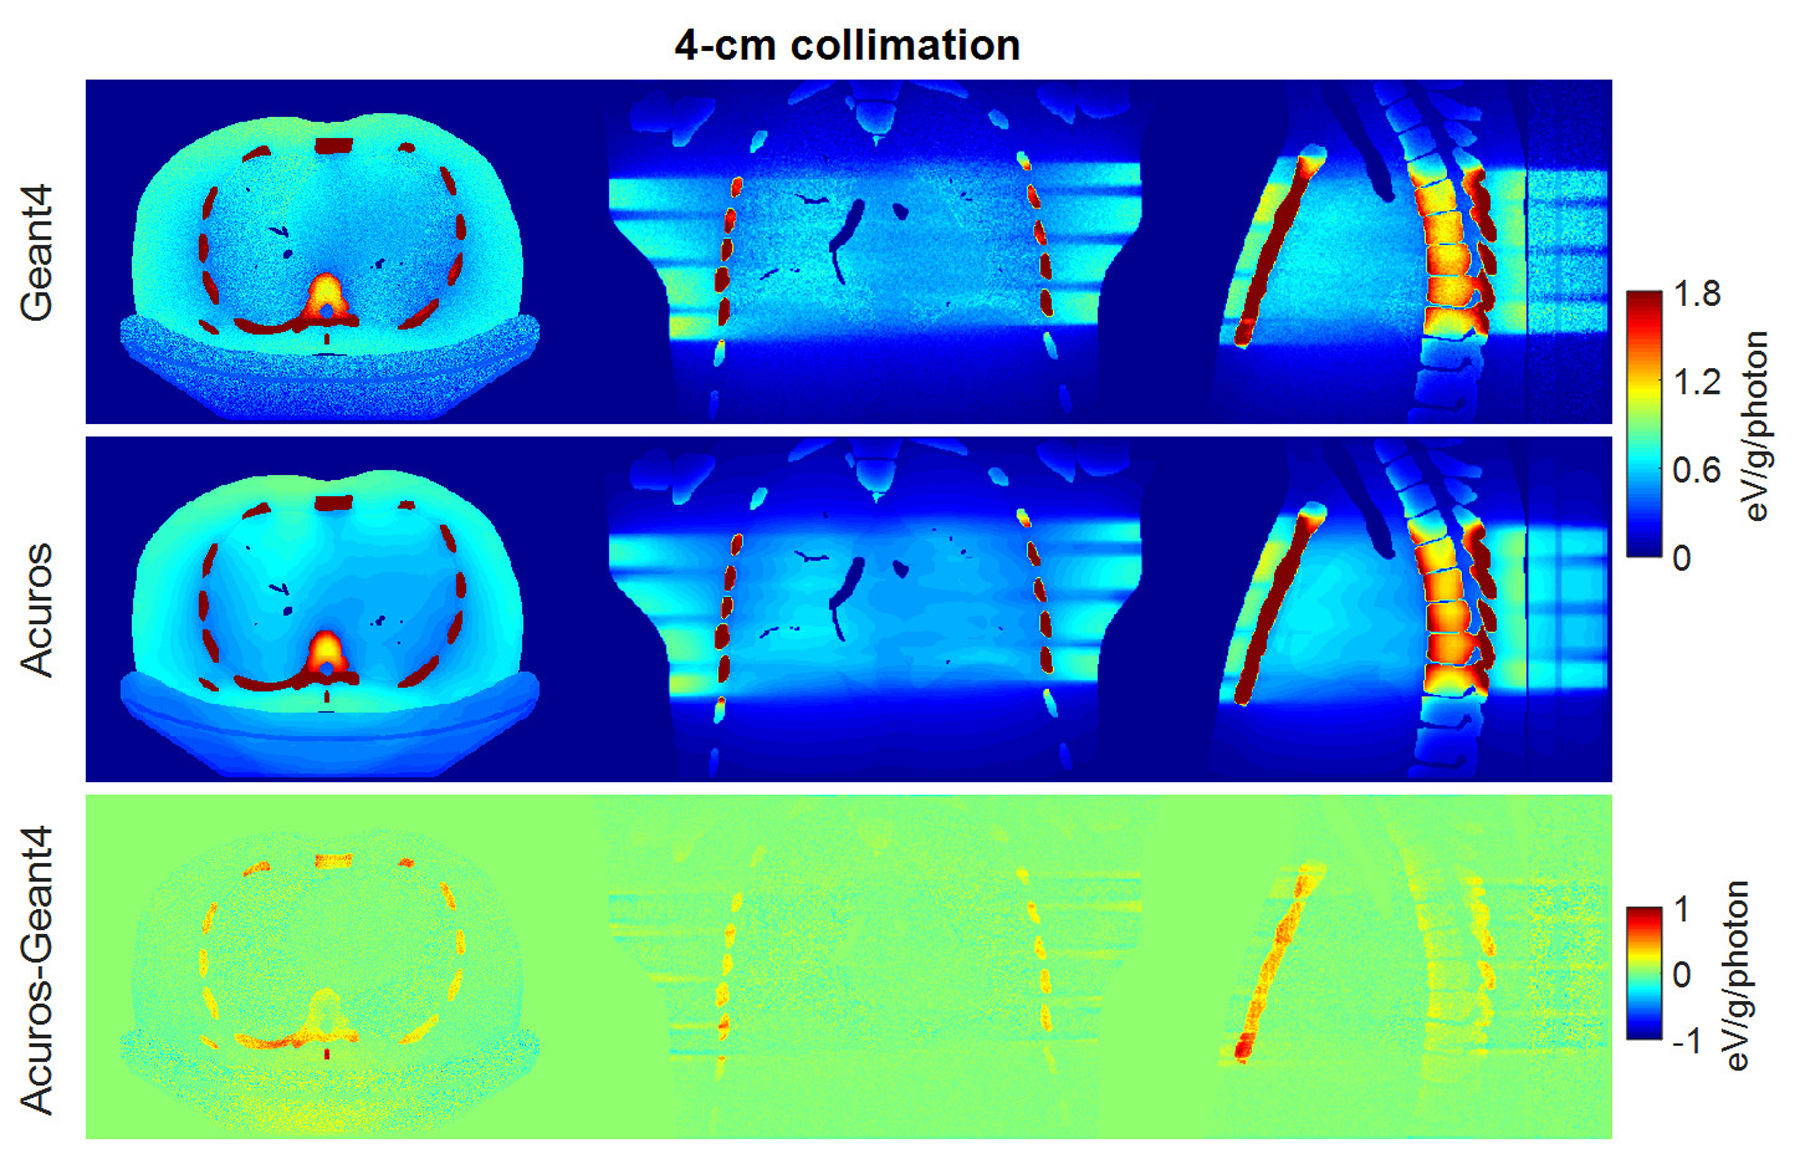
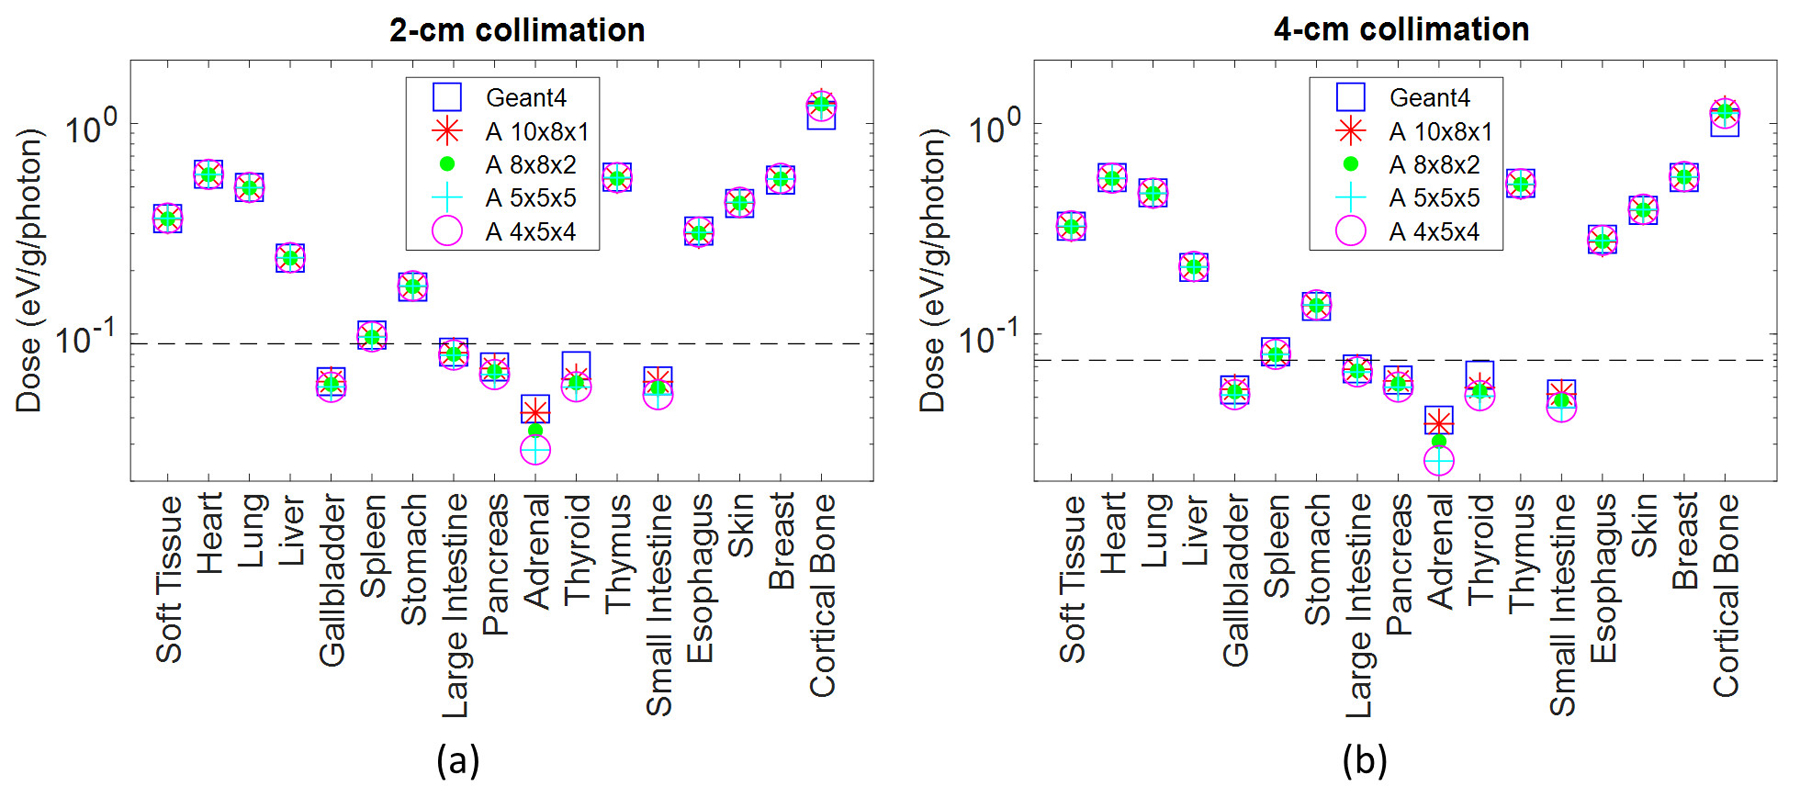
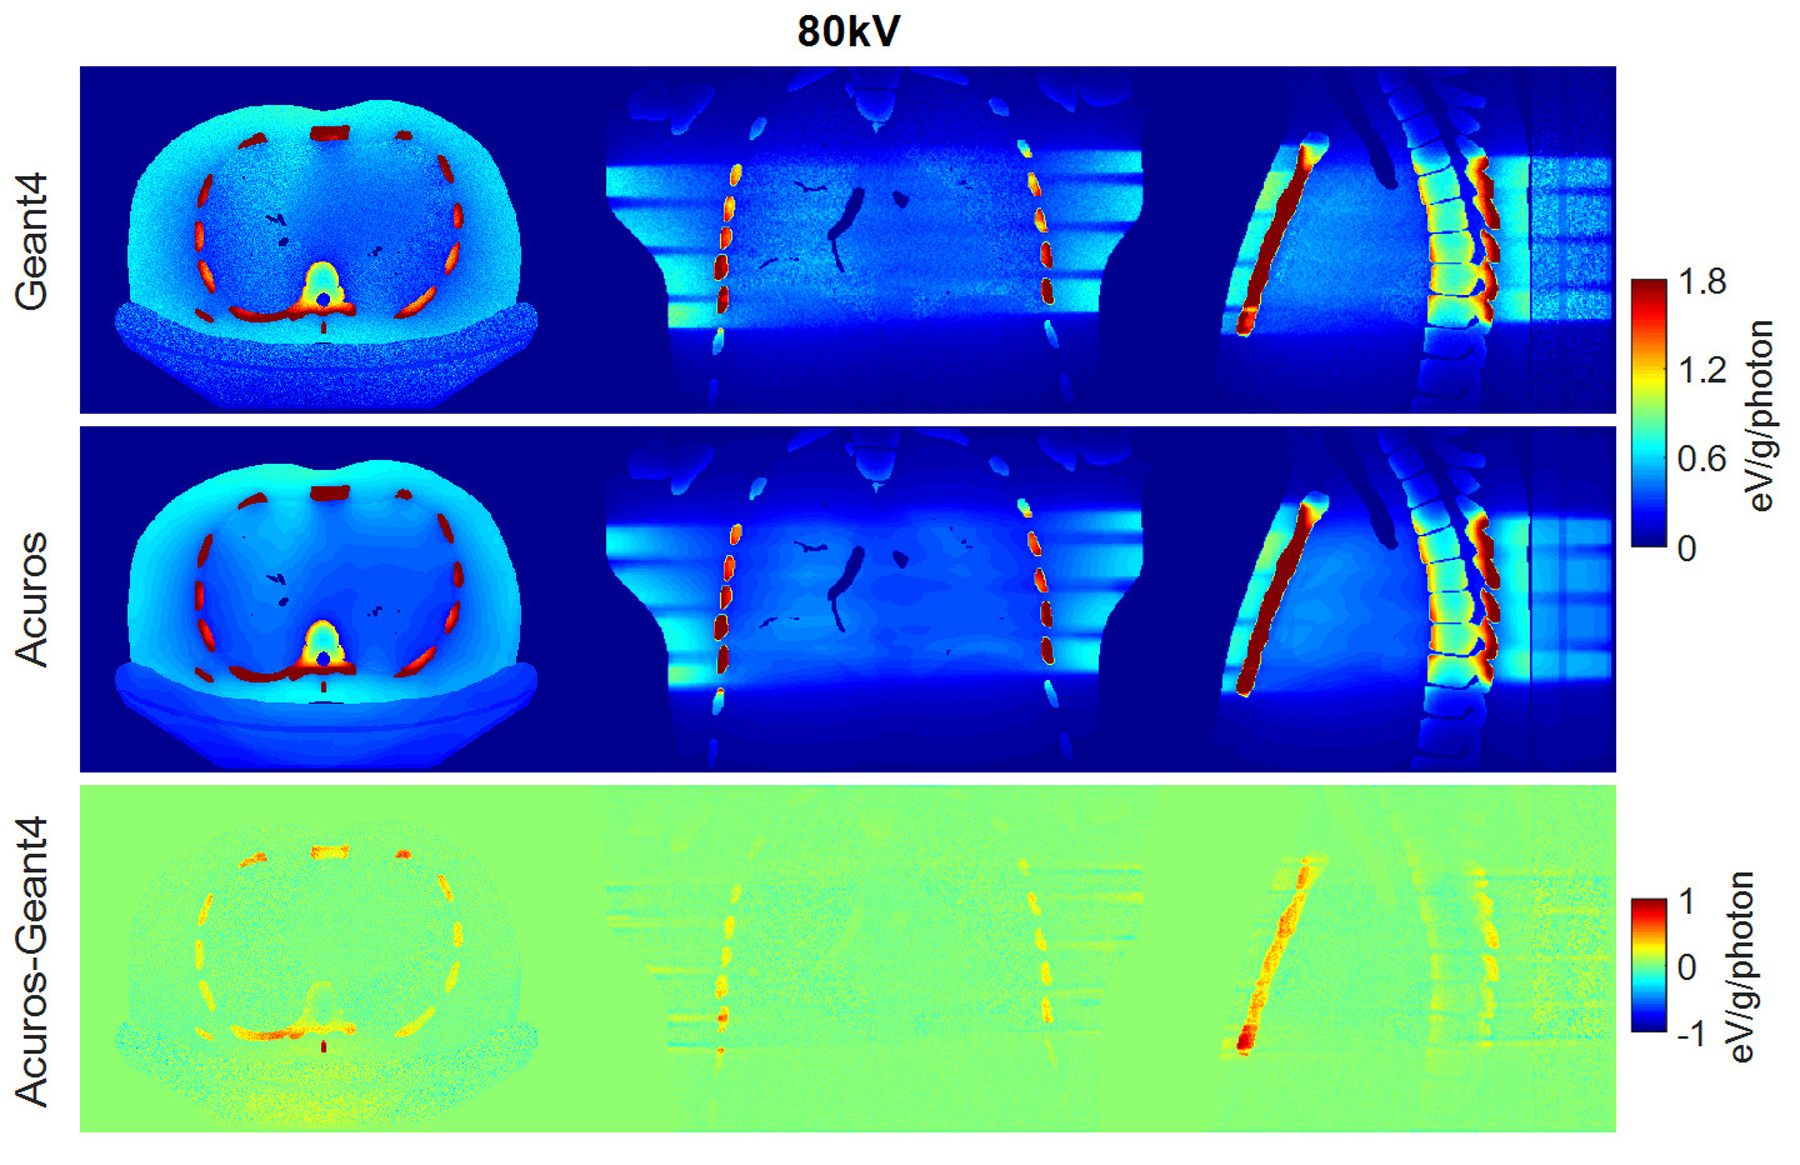
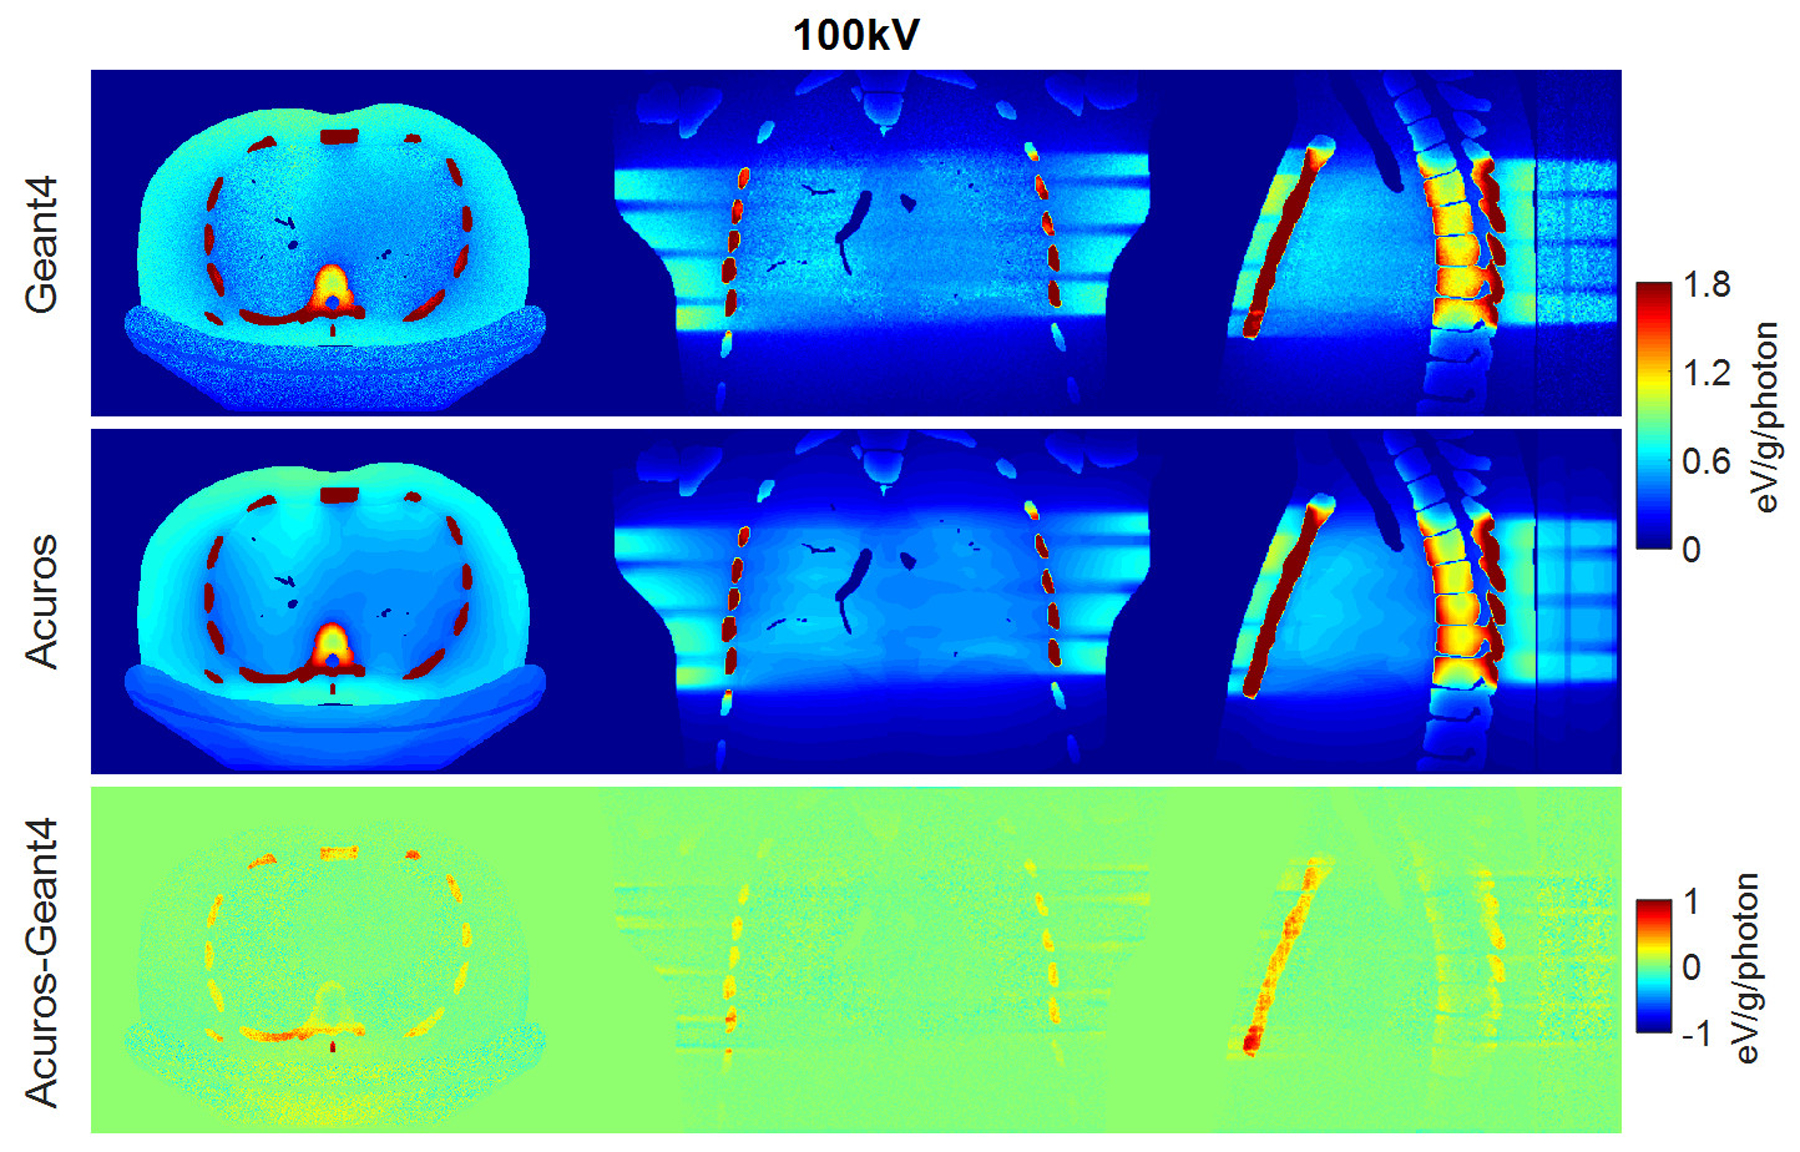
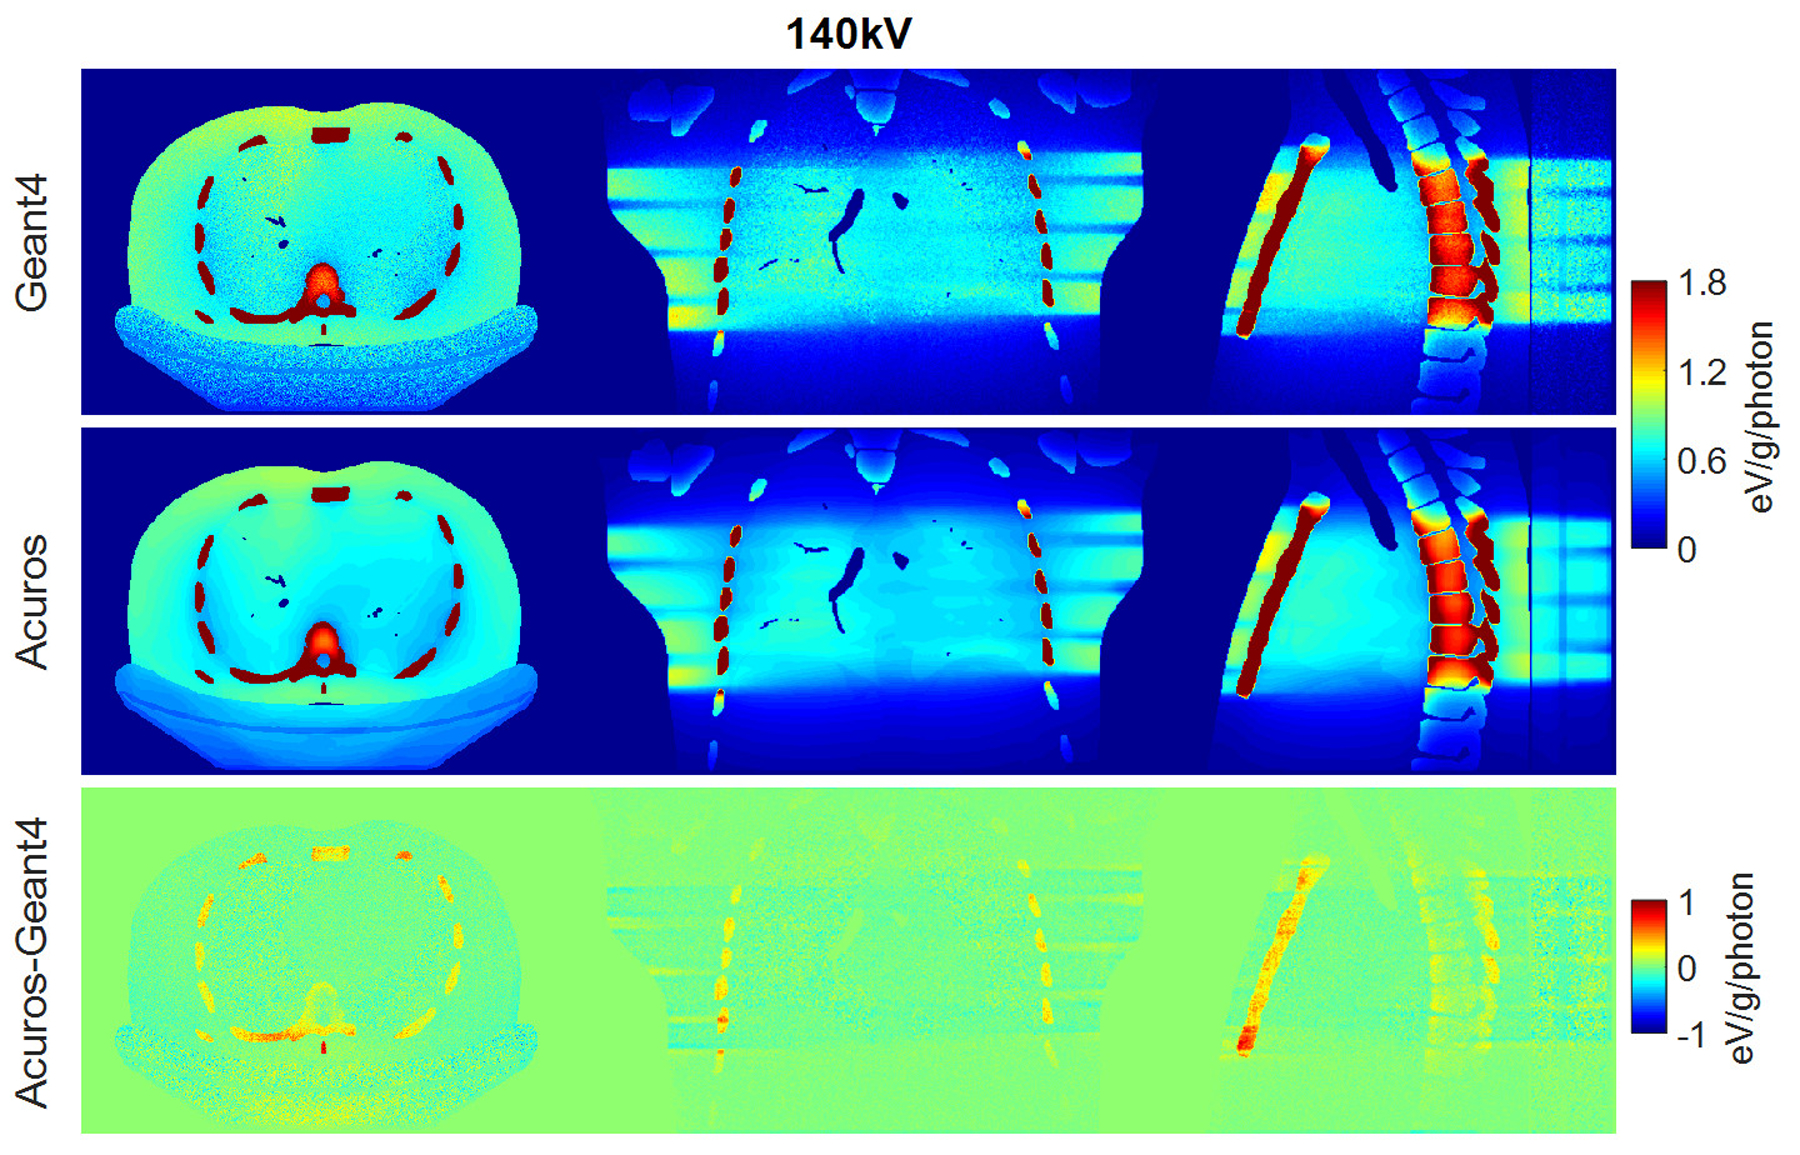
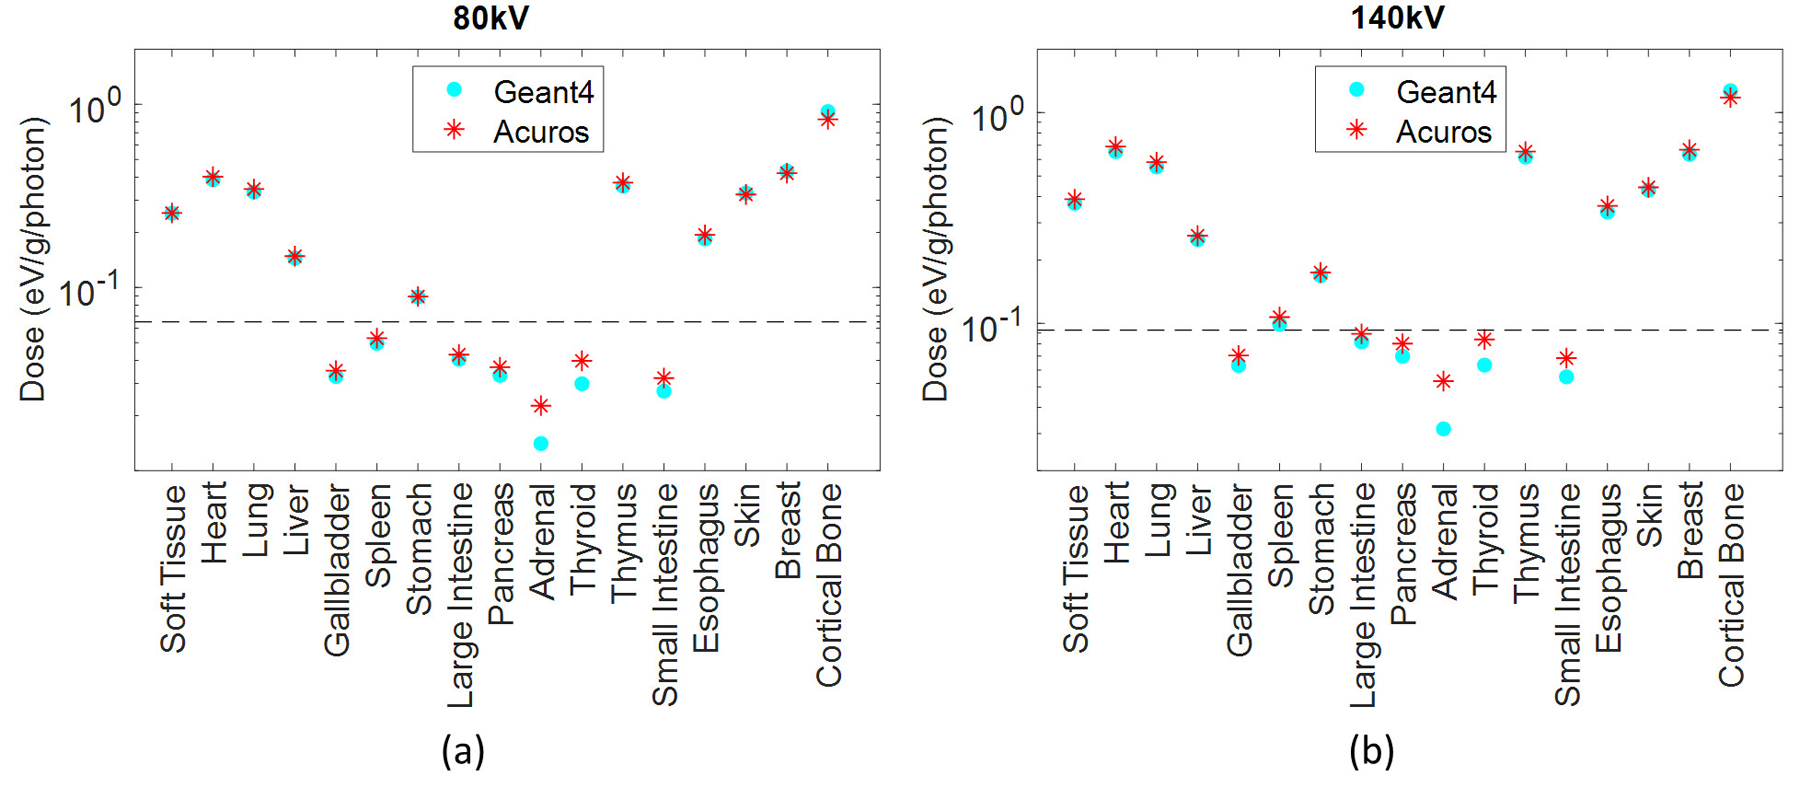
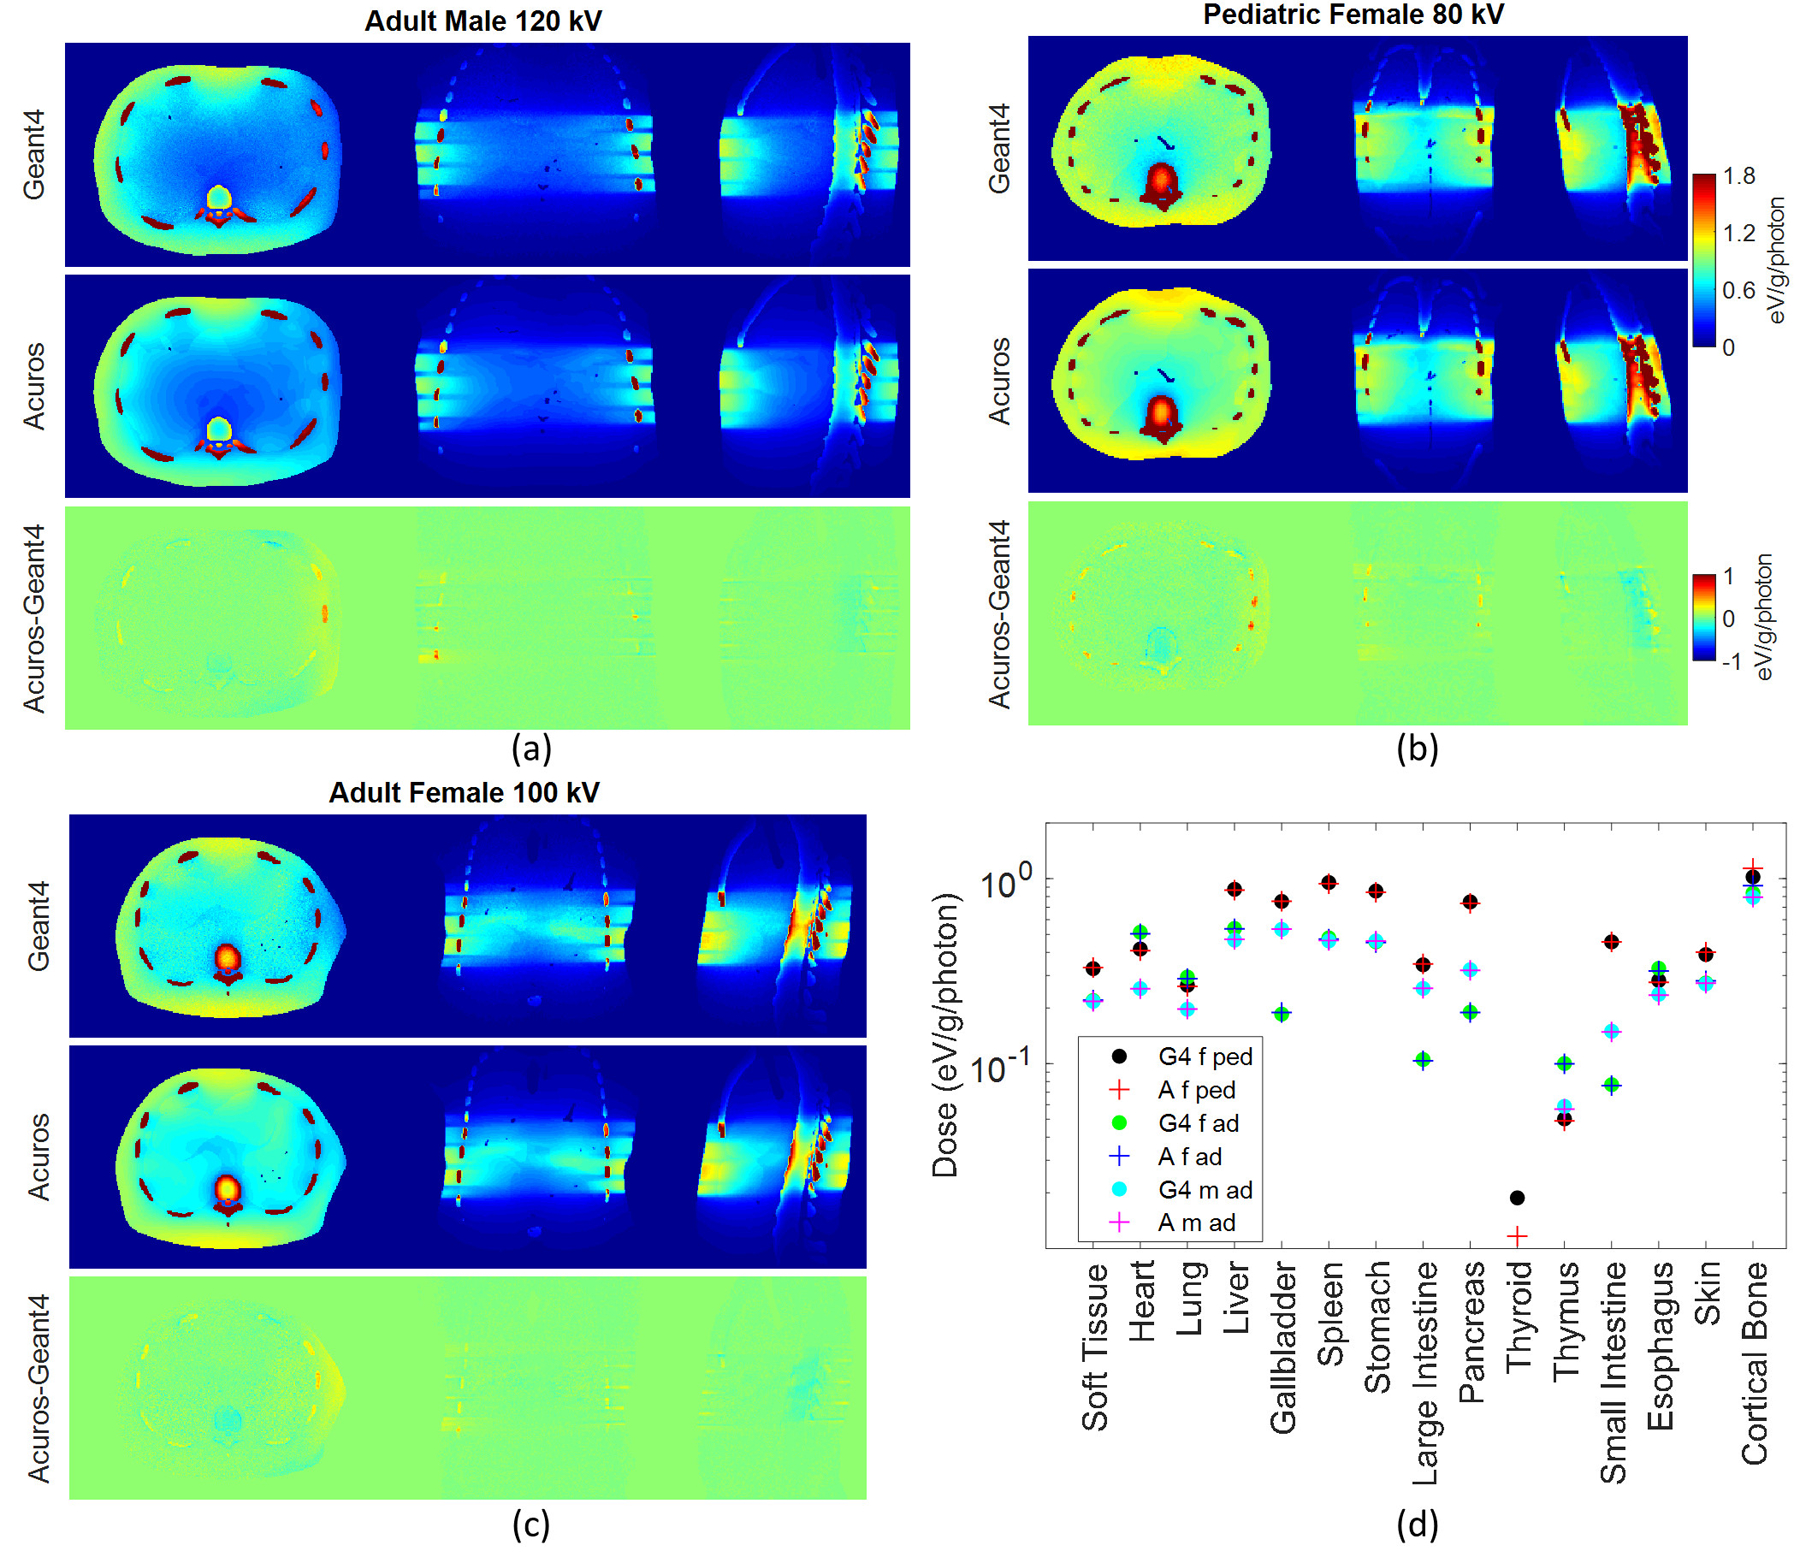
Methods: In this study, computational tools were developed for modeling CT scanners, including a bowtie filter, overrange collimation, and tube current modulation. The LBTE solver requires discretization in the spatial, angular, and spectral dimensions, which may affect the accuracy of scanner modeling. To investigate these effects, this study evaluated the LBTE dose accuracy for different discretization parameters, scanner configurations, and patient models (male, female, adults, pediatric). The method used to validate the LBTE dose maps was the Monte Carlo code Geant4, which provided ground truth dose maps. LBTE simulations were implemented on a GeForce GTX 1080 graphic unit, while Geant4 was implemented on a distributed cluster of CPUs.

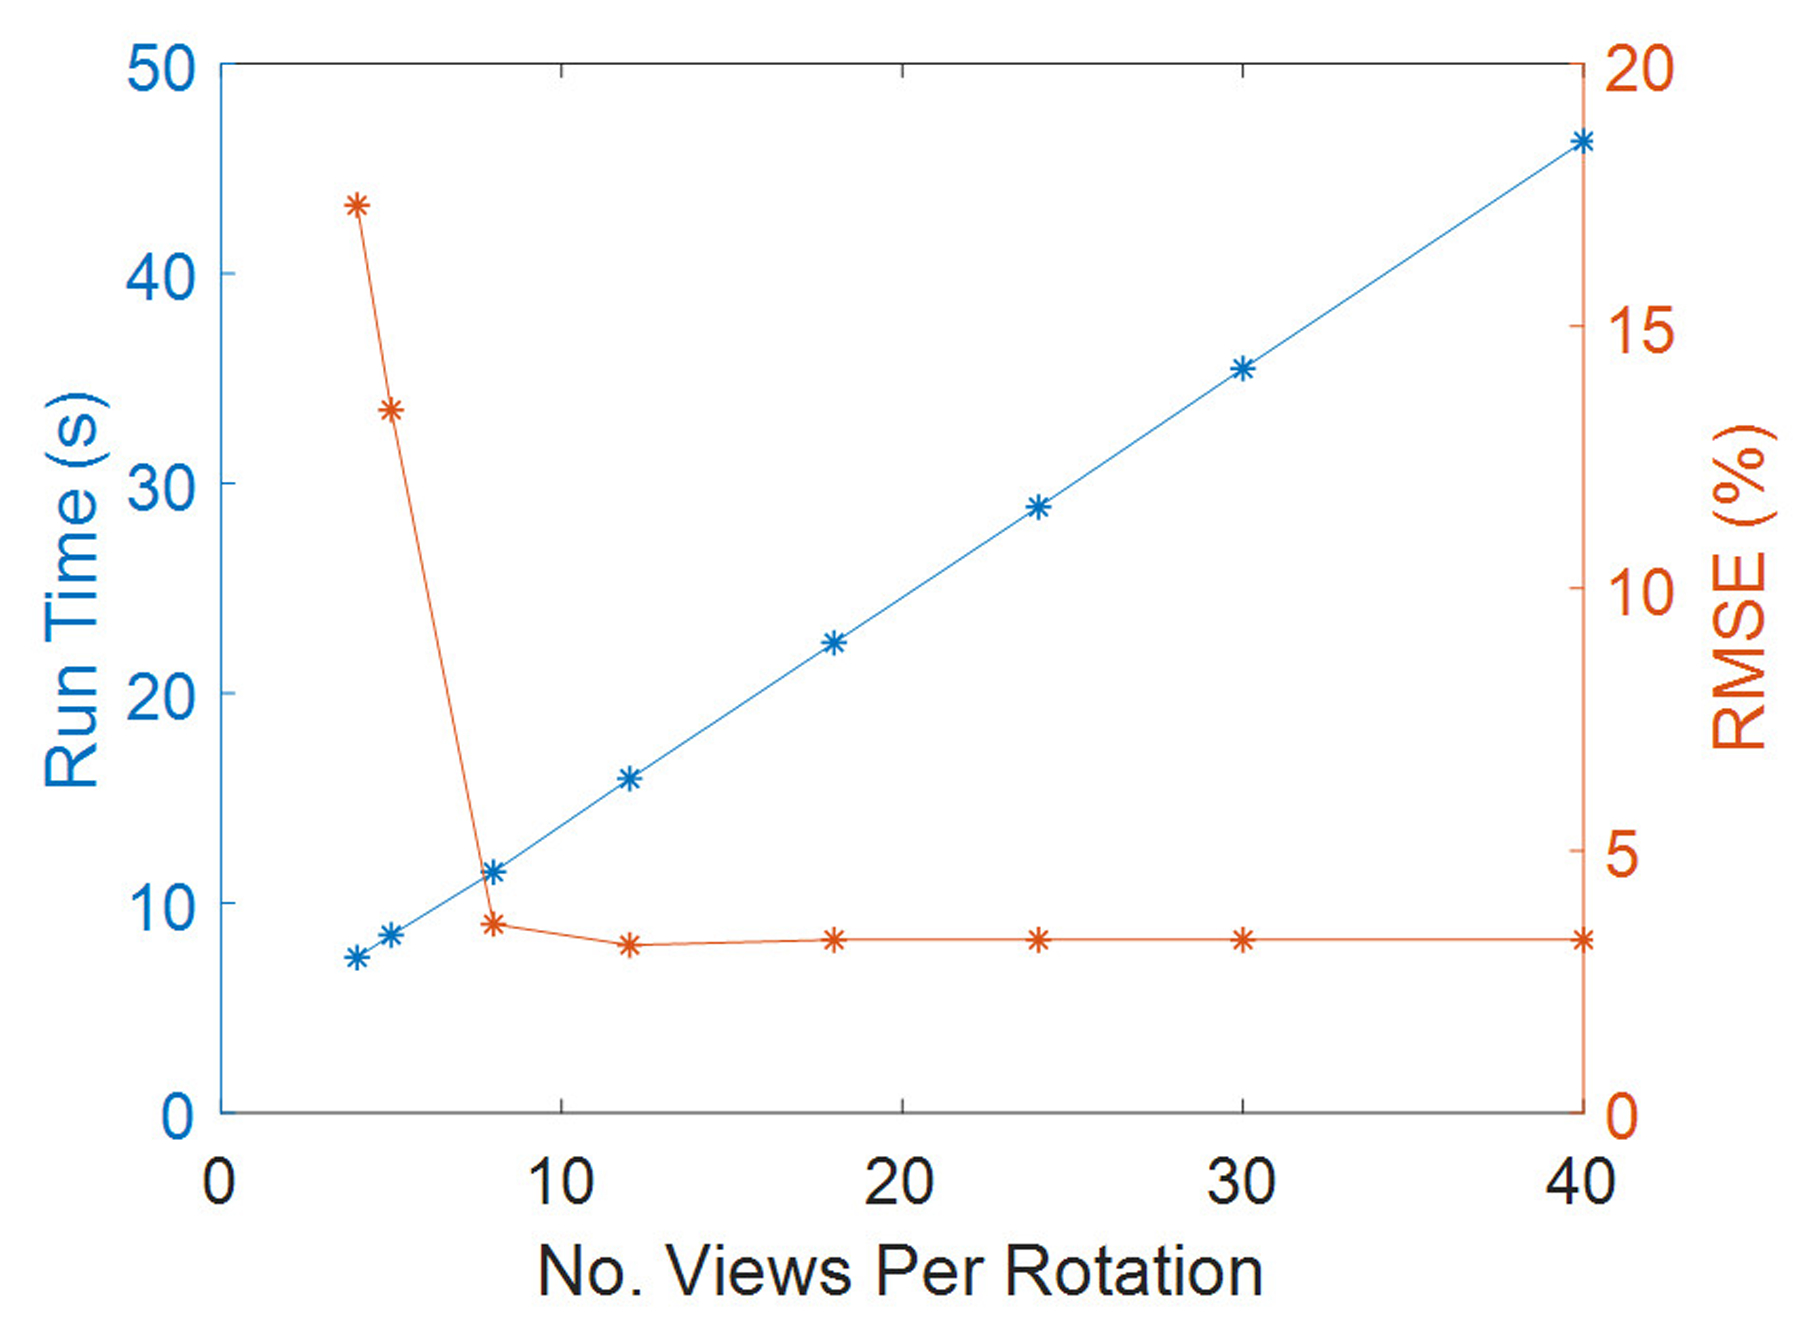
Results: The agreement between Geant4 and the LBTE solver quantifies the accuracy of the LBTE, which was similar across the different protocols and phantoms. The results suggest that 18 views per rotation provides sufficient accuracy, as no significant improvement in the accuracy was observed by increasing the number of projection views. Considering this discretization, the LBTE solver average simulation time was approximately 30 s. However, in the LBTE solver the phantom model was implemented with a lower voxel resolution with respect to Geant4, as it is limited by the memory of the GPU. Despite this discretization, the results showed a good agreement between the LBTE and Geant4, with root mean square error of the dose in organs of approximately 3.5% for most of the studied configurations.

Conclusions: The LBTE solver is proposed as an alternative to Monte Carlo for patient-specific organ dose estimation. This study demonstrated accurate organ dose estimates for the rapid LBTE solver when considering realistic aspects of CT scanners and a range of phantom models. Future plans will combine the LBTE framework with deep learning autosegmentation algorithms to provide near real-time patient-specific organ dose estimation.

Keywords: CT organ dose; Monte Carlo; deterministic solver.


Figures

Figure 1.
Figure 1.
Tube current modulation profiles (longitudinal and longitudinal + sinusoidal angular modulation profiles in blue and orange respectively) plotted over a synthetic AP scout of dimension 260 voxels (X axis) × 888 voxels (Y axis), for (a) 2-cm collimation and (b) 4-cm collimation scenario. The latter shows the correspondent view angle on the blue axis, demonstrating that the sinusoidal maxima occur when the projection is in the lateral direction.
Figure 2.
Figure 2.
Dose maps in Geant4 (top) and Acuros (middle) for the case of 2-cm collimation, shown with window of [0, 1.8] eV/g/photon. Difference image Acuros-Geant4 (bottom), shown with window of [−1, 1], for the axial, coronal and sagittal views, displayed from left to right.
Figure 3.
Figure 3.
Dose maps in Geant4 (top) and Acuros (middle) for the case of 4-cm collimation, shown with window of [0, 1.8] eV/photon/mm3. Difference image Acuros-Geant4 (bottom), shown with window of [−1, 1], for the axial, coronal, and sagittal views, displayed from left to right.
Figure 4.
Figure 4.
Dose in the 17 tissues or organs defined in the phantom for scanner modeling with 2- and 4-cm collimation. Soft tissue includes organs and tissues not specified in the TG 195 phantom model. The organs that absorb more than 0.1% of the total absorbed energy are above the dashed line. The ground truth Geant4 organ doses are plotted along with Acuros organ doses resulting from different voxel downsampling schemes.
Figure 5.
Figure 5.
Run time and RMSE as a function of the number of the selected views per rotation for 4-cm collimation case.
Figure 6.
Figure 6.
Dose maps in Geant4 (top) and Acuros (middle) for 80 kV, shown with window of [0, 1.8] eV/g/photon. Difference image Acuros-Geant4 (bottom), shown with window of [−1, 1], for the axial, coronal, and sagittal views, displayed from left to right.
Figure 7.
Figure 7.
Dose maps in Geant4 (top) and Acuros (middle) for 100 kV, shown with window of [0, 1.8] eV/g/photon. Difference image Acuros-Geant4 (bottom), shown with window of [−1, 1], for the axial, coronal, and sagittal views, displayed from left to right.
Figure 8.
Figure 8.
Dose maps in Geant4 (top) and Acuros (middle) for 140 kV, shown with window of [0, 1.8] eV/g/photon. Difference image Acuros-Geant4 (bottom), shown with window of [−1, 1], for the axial, coronal, and sagittal views, displayed from left to right.
Figure 9.
Figure 9.
Dose in the 17 tissues or organs defined in the phantom for the (a) 80 kV and (b) 140 kV. The organs that absorb more than 0.1% of the total absorbed energy are above the dashed line.
Figure 10.
Figure 10.
Dose maps in Geant4 and Acuros for (a) the adult male, (b) pediatric female, and (c) adult female, shown with window of [0, 1.8] eV/g/photon. Acuros-Geant4 image shown with window of [−1, 1]. Plot of the dose (d) in the 15 tissues or organs defined in the three XCAT-generated phantoms: female pediatric (f ped), female adult (f ad), male adult (m ad), for 80, 100, and 120 kV respectively, for Geant4 (G4) and Acuros (A).
Figure 11.
Figure 11.
Dose maps in Geant4 and Acuros for (a) the adult male, (b) pediatric female, and (c) adult female, shown with window of [0, 1.8] eV/g/photon, with Acuros dose maps calculated with mass energy absorption coefficients obtained from MC fitting. Acuros-Geant4 image shown with window of [−1, 1]. Plot of the dose (d) in the 15 tissues or organs defined in the three XCAT-generated phantoms: female pediatric (f ped), female adult (f ad), male adult (m ad), for 80, 100, and 120 kV respectively, for Geant4 (G4) and Acuros (A).

References

    1. Brenner DJ, Elliston CD, Hall EJ, Berdon WE. Estimated Risks of Radiation-. Am Roentgen Ray Soc. 2001;176(February):289–296 - PubMed
    1. Tepper SJ. Computed tomography - An increasing source of radiation exposure: Commentary. Headache. 2008;48(4):657. doi:10.1111/j.1526-4610.2008.01071.x - DOI
    1. Einstein AJ, Henzlova MJ, Rajagopalan S. Estimating risk of cancer associated with radiation exposure from 64-slice computed tomography coronary angiography. J Am Med Assoc. 2007;298(3):317–323. doi:10.1001/jama.298.3.317 - DOI - PubMed
    1. McCollough CH, Leng S, Yu L, Cody DD, Boone JM, McNitt-Gray MF. CT dose index and patient dose : They are not the same thing. Radiology. 2011;259(2):311–316. doi:10.1148/radiol.11101800 - DOI - PMC - PubMed
    1. Boone JM, Hendee WR, McNitt-Gray MF, Seltzer SE. Radiation exposure from CT scans: How to close our knowledge gaps, monitor and safeguard exposure - Proceedings and recommendations of the radiation dose summit, sponsored by NIBIB, February 24–25, 2011. Radiology. 2012;265(2):544–554. doi:10.1148/radiol.12112201 - DOI - PMC - PubMed