. 2020 Dec;23(12):1849-1861.
doi: 10.1111/ele.13607. Epub 2020 Sep 27.

A Bayesian network approach to trophic metacommunities shows that habitat loss accelerates top species extinctions

Affiliations

A Bayesian network approach to trophic metacommunities shows that habitat loss accelerates top species extinctions

Johanna Häussler et al. Ecol Lett. 2020 Dec.

Abstract

We develop a novel approach to analyse trophic metacommunities, which allows us to explore how progressive habitat loss affects food webs. Our method combines classic metapopulation models on fragmented landscapes with a Bayesian network representation of trophic interactions for calculating local extinction rates. This means that we can repurpose known results from classic metapopulation theory for trophic metacommunities, such as ranking the habitat patches of the landscape with respect to their importance to the persistence of the metacommunity as a whole. We use this to study the effects of habitat loss, both on model communities and the plant-mammal Serengeti food web dataset as a case study. Combining straightforward parameterisability with computational efficiency, our method permits the analysis of species-rich food webs over large landscapes, with hundreds or even thousands of species and habitat patches, while still retaining much of the flexibility of explicit dynamical models.

Keywords: Bayesian network; habitat loss; metacommunity; spatial food web.


Figures

Figure 1
Figure 1
Patch occupancies along a habitat loss gradient, for a basal species (blue) and a top predator (red) in a model food web with 300 consumer and 100 basal species. Axes are coordinates of the landscape, circles are patches and their shading is proportional to local persistence probabilities (dark blue/red: 100% persistence; empty circle: 0%). In the best‐case scenario (a), we first remove patches that contribute the least to the metapopulation capacity of the basal species; in the worst‐case scenario (b), we start with patches that contribute the most; and in (c) we remove patches randomly. The dispersal distance ξi is 0.055 for all species, and baseline extinction probabilities πi increase linearly with trophic level.
Figure 2
Figure 2
The maximum number of trophic levels in trophic chain metacommunities, as a function of a common baseline extinction probability π and the leading eigenvalue of a common landscape matrix λM. Unless π is low and λM simultaneously high, the metacommunity structure itself puts a cap on the number of possible trophic levels. This colour map was generated by iterating eqn 3 until metapopulation capacities dropped below the persistence threshold of 1. However, the same result is obtained by approximating the maximum number of trophic levels simply with λMlogπ (eqn 4; see also Supporting Information, Fig. S3).
Figure 3
Figure 3
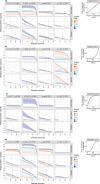
Effect of habitat loss on species persistence in a model food web with 300 consumer and 100 basal species. (a–d) are for different functional forms of a consumer's response to the loss of resources (top right insets). Species are grouped into trophic levels (colour legends); lines show the mean and the bands around them the one standard deviation range of the metapopulation capacities of species in the corresponding trophic level. Rows indicate patch removal scenario (best‐case, worst‐case and random); columns the parameterisation method: baseline extinction probabilities πi and dispersal distances ξi can either take on one value across all species, or increase with trophic level (trophic level‐based, TLB). Horizontal dashed lines highlight a metapopulation capacity of 1, the threshold for long‐term species persistence. Vertical dashed lines show when the metapopulation capacity of the top species in the food web drops below this threshold.
Figure 4
Figure 4
Effect of habitat loss on species persistence in the Serengeti food web. Layout as in Fig. 3, except colour legends show spatial group instead of trophic level, and columns show different functional forms of a consumer's response to the loss of resources (top insets). We show the results for the spatial group‐based parameterisation (SGB), whereby both the baseline extinction probabilities πi and dispersal distances ξi decrease with spatial group. In the colour scheme, green colours are groups whose species are primary producers, blue colours are groups with secondary consumers and brown colours are groups with top predators.

References

    1. Allesina, S. , Bodini, A. & Pascual, M. (2009). Functional links and robustness in food webs. Philos Trans R Soc Lond B Biol Sci, 364, 1701–1709. - PMC - PubMed
    1. Allesina, S. & Pascual, M. (2009). Food web models: a plea for groups. Ecol. Lett., 12, 652–662. - PubMed
    1. Årevall, J. , Early, R. , Estrada, A. , Wennergren, U. & Eklöf, A. (2018). Conditions for successful range shifts under climate change: The role of species dispersal and landscape configuration. Divers. Distrib., 24, 1598–1611.
    1. Baskerville, E.B. , Dobson, A.P. , Bedford, T. , Allesina, S. , Anderson, T.M. & Pascual, M. (2011). Spatial guilds in the serengeti food web revealed by a bayesian group model. PLoS Comput. Biol., 7, 1–11. - PMC - PubMed
    1. Beisner, B.E. , Peres‐Neto, P.R. , Lindström, E.S. , Barnett, A. & Longhi, M.L. (2006). The role of environmental and spatial processes in structuring lake communities from bacteria to fish. Ecology, 87, 2985–2991. - PubMed