

Association Between Magnetic Resonance Imaging-Based Spinal Morphometry and Sensorimotor Behavior in a Hemicontusion Model of Incomplete Cervical Spinal Cord Injury in Rats
- PMID: 32981350
- PMCID: PMC7698856
- DOI: 10.1089/brain.2020.0812
Association Between Magnetic Resonance Imaging-Based Spinal Morphometry and Sensorimotor Behavior in a Hemicontusion Model of Incomplete Cervical Spinal Cord Injury in Rats
Abstract
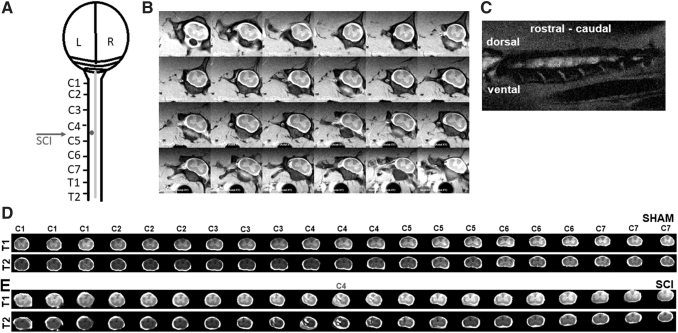
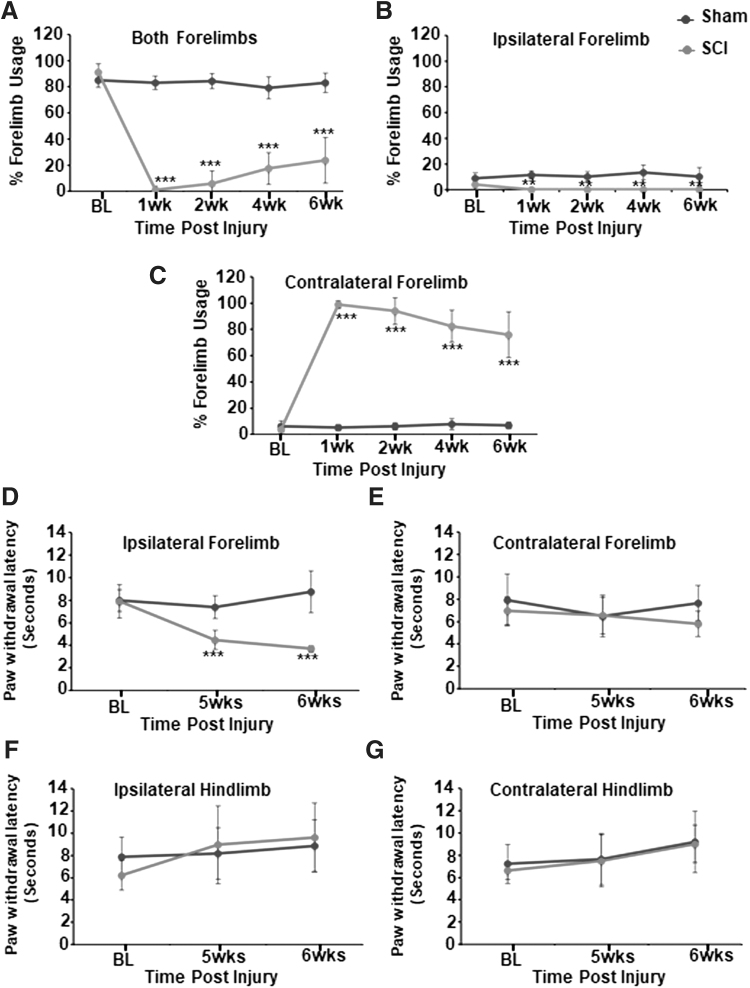
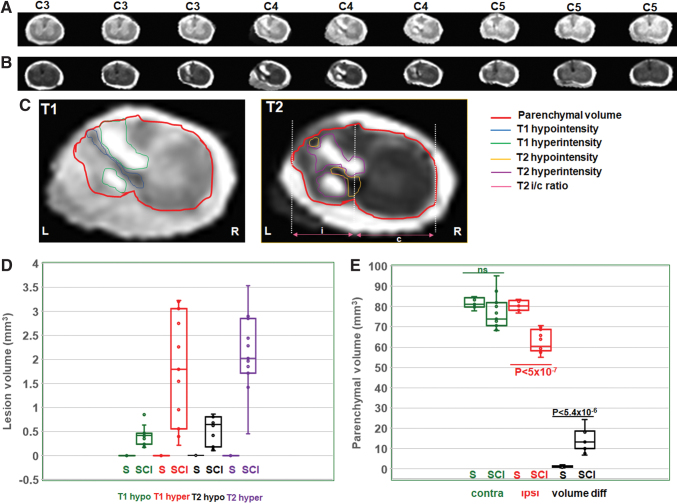
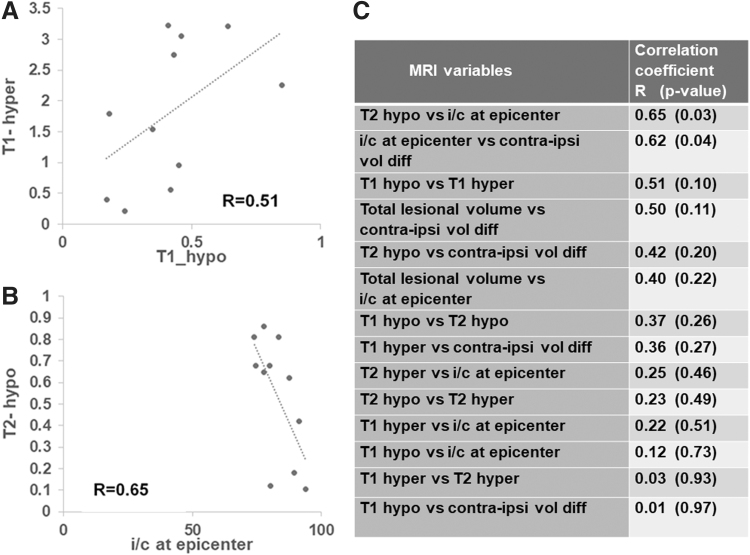
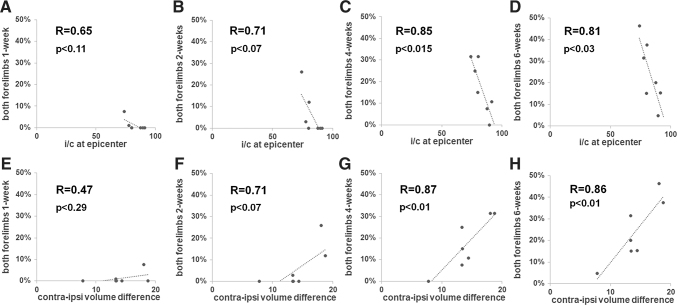
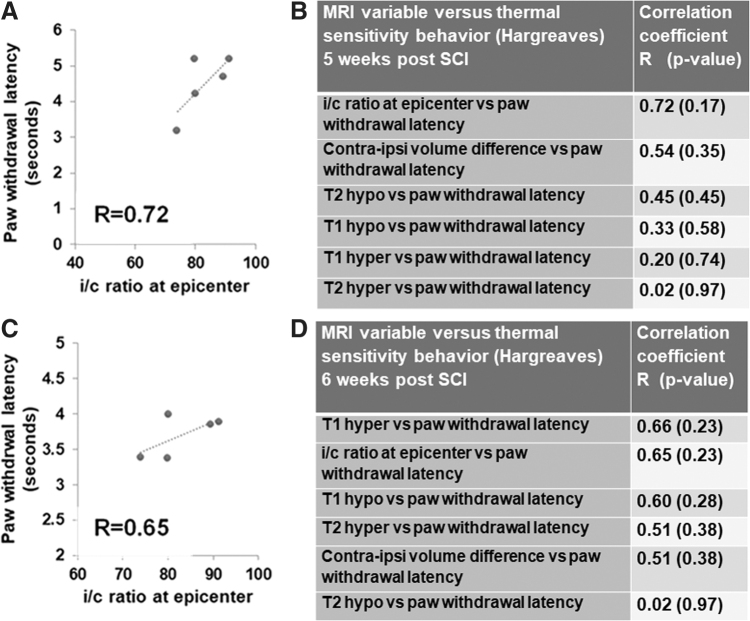
Aim: Structural connectivity in the reorganizing spinal cord after injury dictates functional connectivity and hence the neurological outcome. As magnetic resonance imaging (MRI)-based structural parameters are mostly accessible across spinal cord injury (SCI) patients, we studied MRI-based spinal morphological changes and their relationship to neurological outcome in the rat model of cervical SCI. Introduction: Functional connectivity assessments on patients with SCI rely heavily on MRI-based approaches to investigate the complete neural axis (both spinal cord and brain). Hence, underlying MRI-based structural and morphometric changes in the reorganizing spinal cord and their relationship to neurological outcomes is crucial for meaningful interpretation of functional connectivity changes across the neural axis. Methods: Young adult rats, aged 1.5 months, underwent a precise mechanical impact hemicontusion incomplete cervical SCI at the C4/C5 level, after which sensorimotor behavioral assessments were tracked during the reorganization period of 1-6 weeks, followed by MRI of the cervical spinal cord at 8 weeks after SCI. Results: A significant ipsilesional forelimb motor debilitation was observed from 1 to 6 weeks after injury. Heat sensitivity testing (Hargreaves) showed ipsilesional forelimb hypersensitivity at 5 and 6 weeks after SCI. MRI of the cervical spine showed ipsilateral T1- and T2-weighted lesions across all SCI rats compared with no significant lesions in sham rats. Morphometric assessments of the lesional and nonlesional changes showed the diverse nature of their interindividual variability in the SCI receiving rats. While the various T1 and T2 MRI lesional volumes associated weakly or moderately with neurological outcome, the nonlesional spinal morphometric changes associated much more strongly. The results have important implications for interpreting functional MRI-based functional connectivity after SCI by providing vital underlying structural changes and their relative neurological impact. Impact statement Functional connectivity assessments on patients with SCI relies heavily upon MRI based approaches. Hence, underlying MRI based structural and morphometric changes in the reorganizing spinal cord and its relationship to neurological outcomes is vital for meaningful interpretation of functional connectivity changes across the complete neural axis (both spinal cord and the brain).
Keywords: MRI; T1; T2; behavior; morphometry; rat cervical spine; spinal cord injury.
Conflict of interest statement
All authors disclose that no competing financial interests exist.
Figures
Similar articles
-
Cross-hemicord spinal fiber reorganization associates with cortical sensory and motor network expansion in the rat model of hemicontusion cervical spinal cord injury.Neurosci Lett. 2024 Jan 18;820:137607. doi: 10.1016/j.neulet.2023.137607. Epub 2023 Dec 21. Neurosci Lett. 2024. PMID: 38141752 Free PMC article.
-
Supraspinal Sensorimotor and Pain-Related Reorganization after a Hemicontusion Rat Cervical Spinal Cord Injury.J Neurotrauma. 2021 Dec;38(24):3393-3405. doi: 10.1089/neu.2021.0190. J Neurotrauma. 2021. PMID: 34714150 Free PMC article.
-
Vagus Nerve Stimulation Paired With Rehabilitative Training Enhances Motor Recovery After Bilateral Spinal Cord Injury to Cervical Forelimb Motor Pools.Neurorehabil Neural Repair. 2020 Mar;34(3):200-209. doi: 10.1177/1545968319895480. Epub 2020 Jan 22. Neurorehabil Neural Repair. 2020. PMID: 31969052 Free PMC article.
-
Prolonged acute intermittent hypoxia improves forelimb reach-to-grasp function in a rat model of chronic cervical spinal cord injury.Exp Neurol. 2021 Jun;340:113672. doi: 10.1016/j.expneurol.2021.113672. Epub 2021 Feb 27. Exp Neurol. 2021. PMID: 33652030 Review.
-
Imaging of Spinal Cord Injury: Acute Cervical Spinal Cord Injury, Cervical Spondylotic Myelopathy, and Cord Herniation.Semin Ultrasound CT MR. 2016 Oct;37(5):431-47. doi: 10.1053/j.sult.2016.05.007. Epub 2016 May 6. Semin Ultrasound CT MR. 2016. PMID: 27616315 Review.
Cited by
-
[Research progress on rodent models of cervical spinal cord injury].Zhongguo Xiu Fu Chong Jian Wai Ke Za Zhi. 2023 Jan 15;37(1):120-126. doi: 10.7507/1002-1892.202209049. Zhongguo Xiu Fu Chong Jian Wai Ke Za Zhi. 2023. PMID: 36708125 Free PMC article. Chinese.
-
Cross-hemicord spinal fiber reorganization associates with cortical sensory and motor network expansion in the rat model of hemicontusion cervical spinal cord injury.Neurosci Lett. 2024 Jan 18;820:137607. doi: 10.1016/j.neulet.2023.137607. Epub 2023 Dec 21. Neurosci Lett. 2024. PMID: 38141752 Free PMC article.
-
Lateralized Supraspinal Functional Connectivity Correlate with Pain and Motor Dysfunction in Rat Hemicontusion Cervical Spinal Cord Injury.Neurotrauma Rep. 2022 Oct 3;3(1):421-432. doi: 10.1089/neur.2022.0040. eCollection 2022. Neurotrauma Rep. 2022. PMID: 36337081 Free PMC article.
-
Correlation Analysis Between Magnetic Resonance Imaging-Based Anatomical Assessment and Behavioral Outcome in a Rat Contusion Model of Chronic Thoracic Spinal Cord Injury.Front Neurosci. 2022 Apr 21;16:838786. doi: 10.3389/fnins.2022.838786. eCollection 2022. Front Neurosci. 2022. PMID: 35527814 Free PMC article.
-
Supraspinal Sensorimotor and Pain-Related Reorganization after a Hemicontusion Rat Cervical Spinal Cord Injury.J Neurotrauma. 2021 Dec;38(24):3393-3405. doi: 10.1089/neu.2021.0190. J Neurotrauma. 2021. PMID: 34714150 Free PMC article.
References
-
- Ahuja CS, Wilson JR, Nori S, Kotter MRN, Druschel C, Curt A, Fehlings MG. 2017. Traumatic spinal cord injury. Nat Rev Dis Primers 3:17018. - PubMed
Publication types
MeSH terms
Grants and funding
LinkOut - more resources
Full Text Sources
Medical
Research Materials
Miscellaneous
