. 2020 Nov 6;127(11):1437-1455.
doi: 10.1161/CIRCRESAHA.120.316770. Epub 2020 Sep 28.

Microanatomy of the Human Atherosclerotic Plaque by Single-Cell Transcriptomics

Affiliations

Microanatomy of the Human Atherosclerotic Plaque by Single-Cell Transcriptomics

Marie A C Depuydt et al. Circ Res. .

Abstract

Rationale: Atherosclerotic lesions are known for their cellular heterogeneity, yet the molecular complexity within the cells of human plaques has not been fully assessed.

Objective: Using single-cell transcriptomics and chromatin accessibility, we gained a better understanding of the pathophysiology underlying human atherosclerosis.

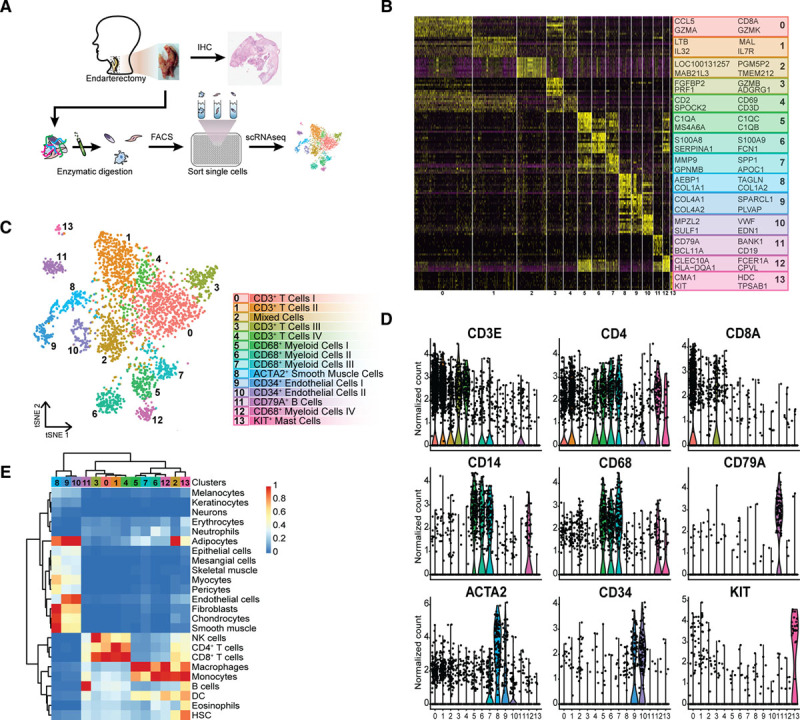
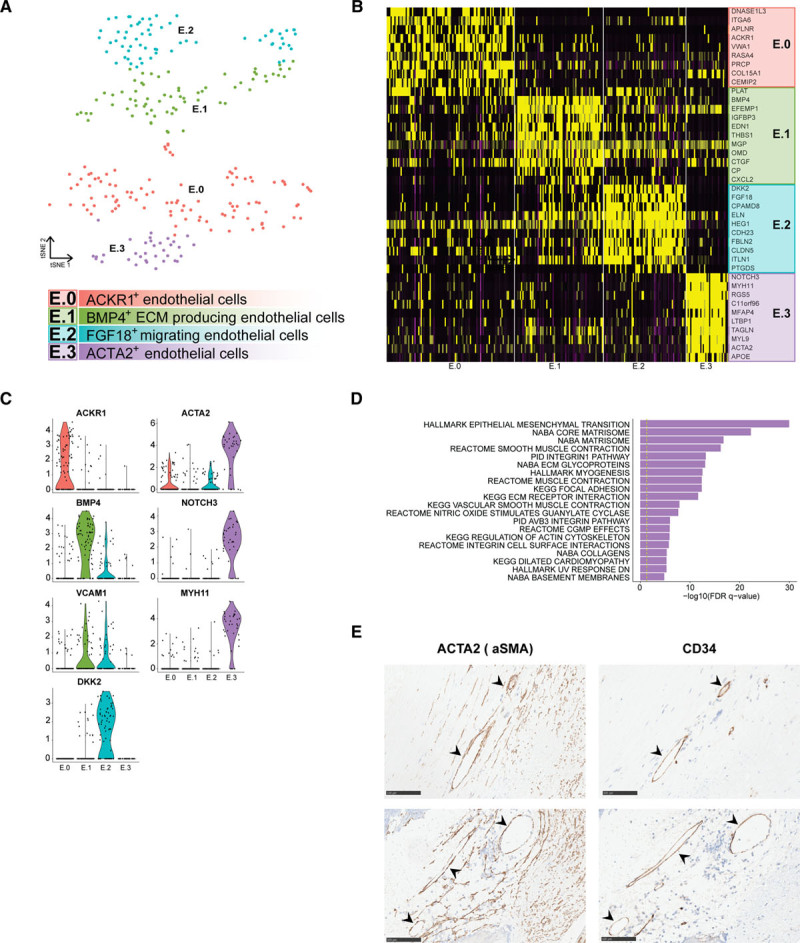
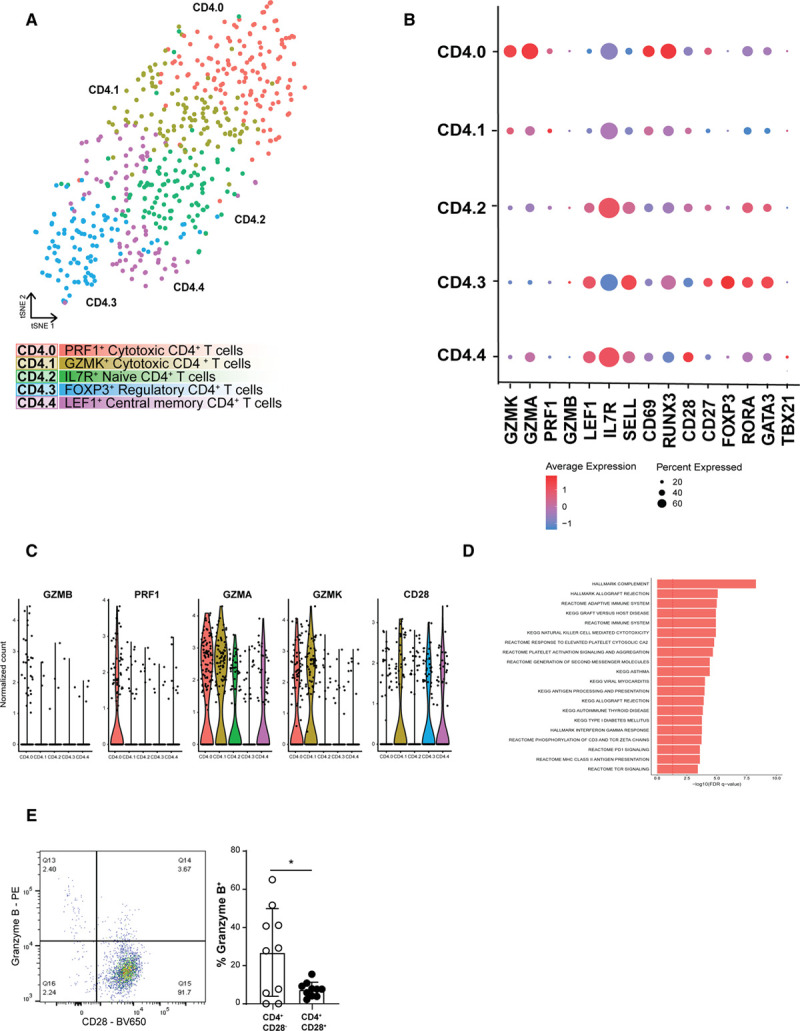
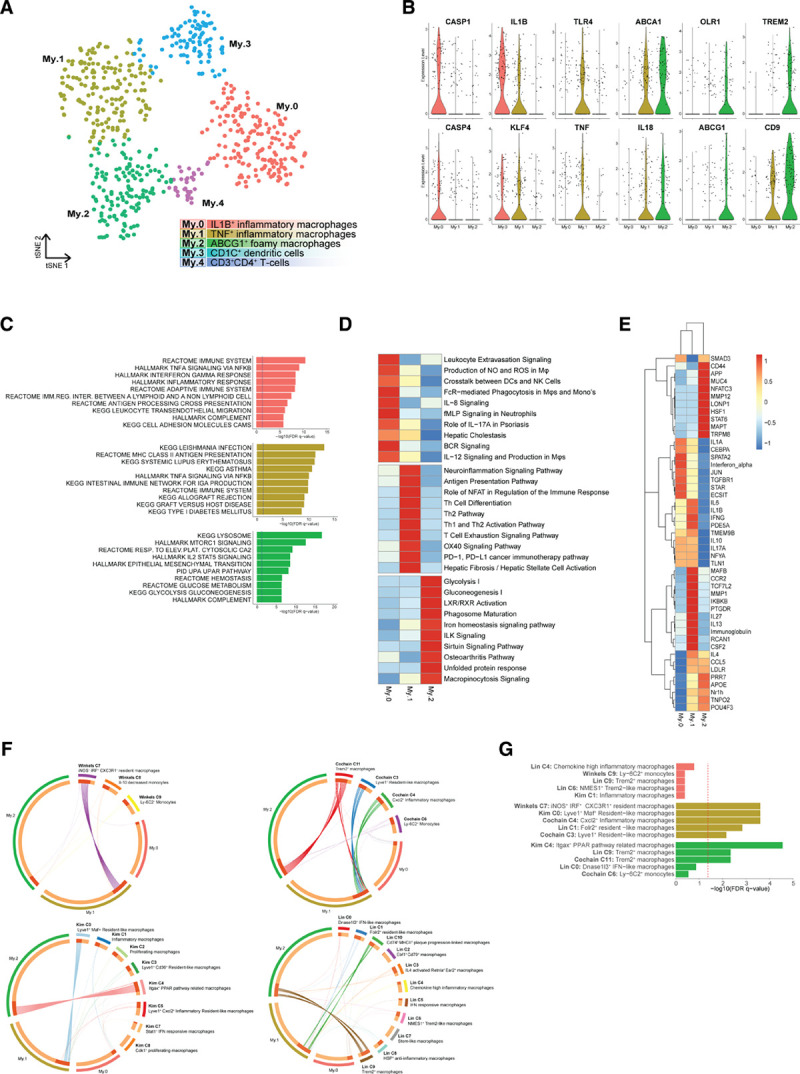
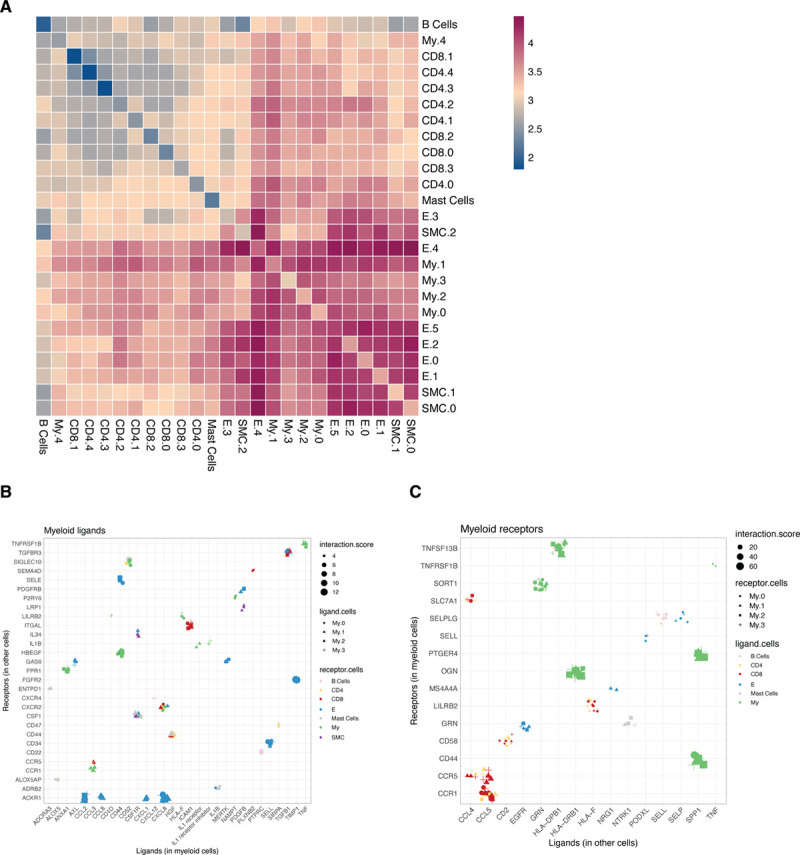
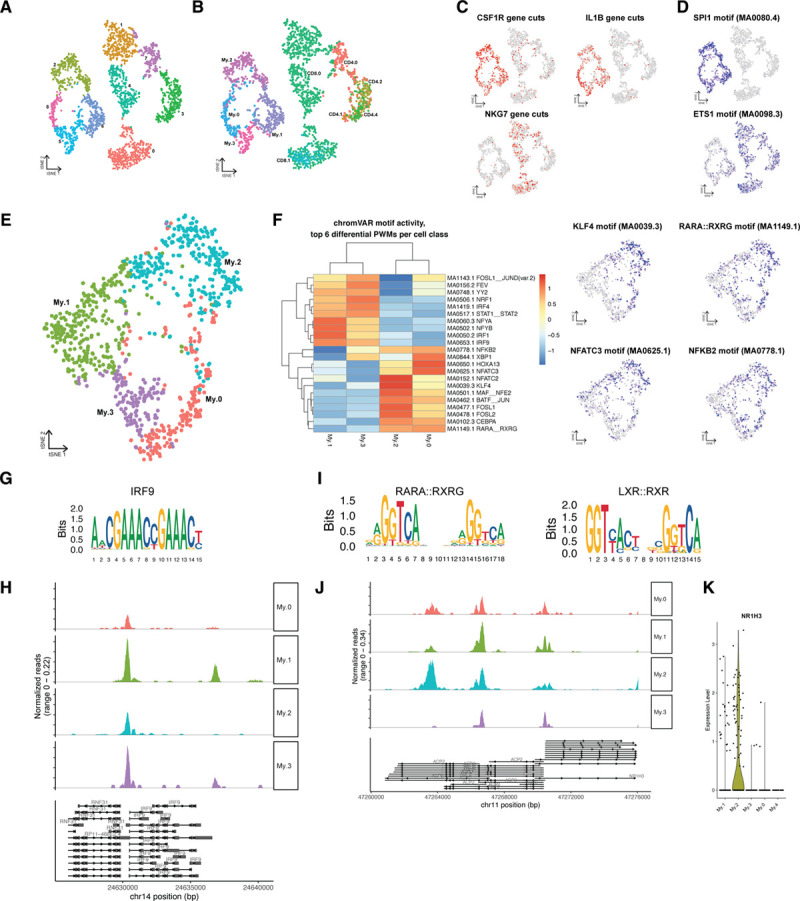
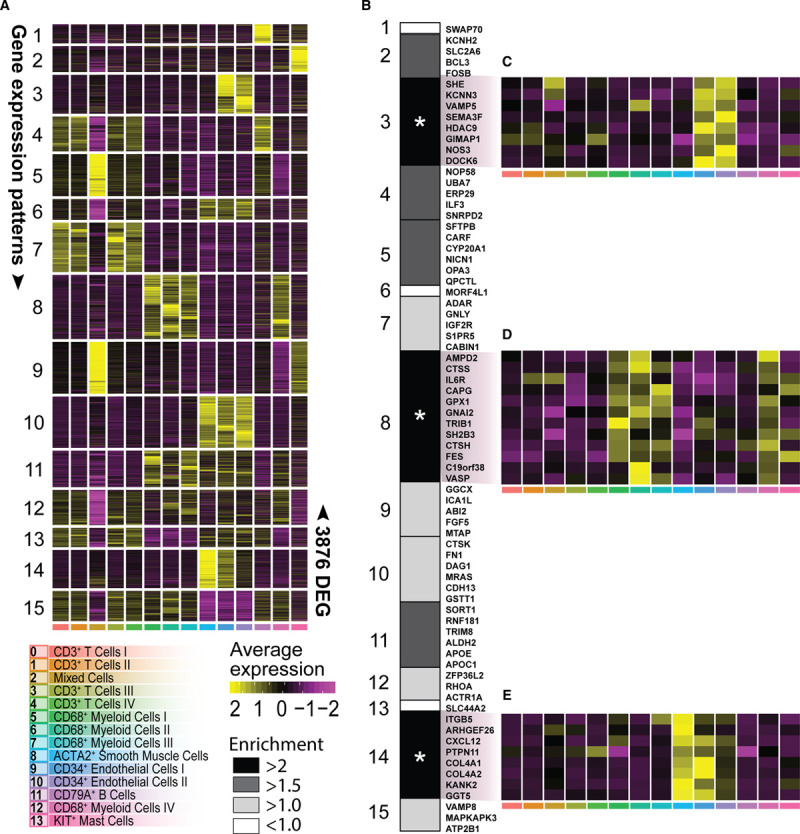
Methods and results: We performed single-cell RNA and single-cell ATAC sequencing on human carotid atherosclerotic plaques to define the cells at play and determine their transcriptomic and epigenomic characteristics. We identified 14 distinct cell populations including endothelial cells, smooth muscle cells, mast cells, B cells, myeloid cells, and T cells and identified multiple cellular activation states and suggested cellular interconversions. Within the endothelial cell population, we defined subsets with angiogenic capacity plus clear signs of endothelial to mesenchymal transition. CD4+ and CD8+ T cells showed activation-based subclasses, each with a gradual decline from a cytotoxic to a more quiescent phenotype. Myeloid cells included 2 populations of proinflammatory macrophages showing IL (interleukin) 1B or TNF (tumor necrosis factor) expression as well as a foam cell-like population expressing TREM2 (triggering receptor expressed on myeloid cells 2) and displaying a fibrosis-promoting phenotype. ATACseq data identified specific transcription factors associated with the myeloid subpopulation and T cell cytokine profiles underlying mutual activation between both cell types. Finally, cardiovascular disease susceptibility genes identified using public genome-wide association studies data were particularly enriched in lesional macrophages, endothelial, and smooth muscle cells.

Conclusions: This study provides a transcriptome-based cellular landscape of human atherosclerotic plaques and highlights cellular plasticity and intercellular communication at the site of disease. This detailed definition of cell communities at play in atherosclerosis will facilitate cell-based mapping of novel interventional targets with direct functional relevance for the treatment of human disease.

Keywords: atherosclerosis; cardiovascular disease; genome-wide association study; single-cell analysis.


Conflict of interest statement

None.

Figures

Figure 1.
Figure 1.
CCA clustering and tSNE visualization revealed 14 distinct populations. A, Experimental setup: plaque samples obtained from endarterectomy procedures were digested, single viable cells were fluorescence-activated cell sorting (FACS) sorted in a polymerase chain reaction plate, and CEL-seq2 was performed. B, Heatmap of top marker genes per cluster. C, tSNE visualization of clustering revealed 14 cell populations. Population identities were determined based on marker gene expression. D, Violin plots of signature genes confirmed population identities, as well as (E) by similarity to known cell type in reference RNA sequencing (RNA-seq) data sets. ACTA2 indicates alpha actin 2, smooth muscle; DC, dendritic cell; HSC, hematopoietic stem cell; IHC, immunohistochemistry; KIT, c-KIT; NK, natural killer; scRNAseq, single-cell RNA sequencing; and tSNE, t-distributed stochastic neighbor embedding.
Figure 2.
Figure 2.
Subclustering of endothelial cells revealed 4 distinct populations. A, tSNE visualization of clustering revealed 4 distinct endothelial cell populations. B, Heatmap of top marker genes per cluster. C, Violin plots of endothelial cell-specific markers, genes involved in endothelial cell angiogenesis and activation, and genes that are associated with endothelial to mesenchymal transition. D, Top pathways associated with cluster E.3. E, Examples of ACTA2 (actin alpha 2, smooth muscle) and CD34 expression in a monolayer of cells lining intraplaque vasculature on sequential histological slides of 2 different patients. Scale bars represent 100 µm. ACKR1 indicates atypical chemokine receptor 1; ACTA2, actin alpha 2, smooth muscle; aSMA, actin alpha 2, smooth muscle; BMP4, bone morphogenetic protein 4; DKK2, dickkopf-related protein 2; E, endothelial cell; FDR, false discovery rate; FGF18, fibroblast growth factor 18; KEGG, Kyoto encyclopedia of genes and genomes; MYH11, myosin heavy chain 11; NOTCH3, notch receptor 3; tSNE, t-distributed stochastic neighbor embedding; and VCAM1, vascular cell adhesion molecule 1.
Figure 3.
Figure 3.
Subclustering of CD4+ T cells revealed 5 distinct populations. A, tSNE visualization of clustering revealed 5 distinct CD4+ T-cell populations. B, Dot plot of cluster-identifying genes and T-cell transcription factors. C, Violin plots of CD4.0 characterizing cytotoxic genes. D, Flow cytometry analysis of Granzyme B production by CD4+CD28 cells on defrosted plaque samples. E, Top pathways associated with cluster CD4.0. Data shown as mean±SD (n=10; obtained from cohort 1 and 2). *P<0.05. FDR indicates false discovery rate; FOXP3, forkhead box P3; GZMK, granzyme K; IL7R, interleukin 7 receptor; KEGG, Kyoto encyclopedia of genes and genomes; LEF1, lymphoid enhancer-binding factor 1; PD1, programmed cell death protein 1;PRF1, perforin 1; TCR, T cell receptor; and tSNE, t-distributed stochastic neighbor embedding.
Figure 4.
Figure 4.
Subclustering of myeloid cells revealed 5 distinct populations. A, tSNE visualization of clustering revealed 5 distinct myeloid populations. B, Violin plots of macrophage-specific activation genes and foam cell markers. C, Top pathways associated with the macrophage clusters. D, Unique pathways per macrophage cluster. E, Ingenuity Pathway Analysis of upstream regulators of the macrophage subsets. Both D and E depict data as Z score. F, Circos plots displaying overlap of macrophage clusters with macrophage clusters of murine single-cell RNA sequencing papers. Dotted lines indicate no significant overlap, and solid lines indicate significant overlap. G, Bar graph with top 5 overlapping clusters of human and murine macrophage clusters. ABCG1 indicates ATP-binding cassette sub-family G member 1; BCR, B cell receptor; CXCL2, C-X-C motif chemokine ligand 2; DC, dendritic cell; FcR, Fc receptor; FDR, false discovery rate; IL, interleukin; ILK, integrin-linked kinase; iNOS, inducible nitric oxide synthase; KEGG, Kyoto encyclopedia of genes and genomes; LXR, liver X receptor; My, myeloid cells; NK, natural killer; PD1, programmed cell death protein 1; PPAR, peroxisome proliferator-activated receptor; ROS, reactive oxygen species; TH, T helper; TNF, tumor necrosis factor; TREM2, triggering receptor expressed on myeloid cells 2; tSNE, t-distributed stochastic neighbor embedding; and RXR, retinoid X receptor.
Figure 5.
Figure 5.
Ligand-receptor interaction analyses to assess intracellular communication in the plaque. A, Heatmap showing logarithmic interaction scores between all cell subsets. Top quartile of unique ligand-receptor interactions between all cells and myeloid cells for both (B) ligands expressed by myeloid cells and (C) receptors expressed by myeloid cells. E indicates endothelial cells; My, myeloid cells; and SMC, smooth muscle cells.
Figure 6.
Figure 6.
Chromatin accessibility of myeloid cells in human atherosclerotic plaques analyzed using single-cell ATAC sequencing (scATAC-seq). A, tSNE visualization of myeloid and T-cell clusters based on scATAC-seq. B, Projection of single-cell RNA sequencing (scRNA-seq) myeloid and T-cell labels over the scATAC-seq clusters. C, tSNE visualization of cell type–specific accessible gene loci. D, tSNE visualization of cell type–specific transcription factor motifs enriched in open chromatin regions. E, tSNE visualization of subclustered scATAC-seq myeloid clusters. F, Heatmap showing the top differential open chromatin TF motifs by chromVAR, with subcluster specific accessible TF motifs visualized as tSNE. G, IRF9 motif. H, Pseudobulk genome browser visualization identifying the open chromatin regions of IRF9 in different myeloid subsets. I, RARA:RXRG, and LXR (liver X receptor): RXR (retinoid X receptor) motifs. J, Pseudobulk genome browser visualization identifying open chromatin regions of NRIH3 (encoding LXRα) in different myeloid subsets. K, Violin plot of NR1H3 (nuclear receptor subfamily 1 group H) gene expression from myeloid scRNA-seq data. ETS1 indicates ETS proto-oncogene 1; IRF, interferon regulatory factor; KLF, kruppel like factor 4; NFATC3, nuclear factor of activated T cells 3; NR1H3, nuclear receptor subfamily 1 group H member 3; PWM, position weight matrix; tSNE, t-distributed stochastic neighbor embedding; RARA, retinoic acid receptor alpha; and RXRG, retinoid X receptor gamma.
Figure 7.
Figure 7.
Projection of coronary artery disease (CAD) genome-wide association studies (GWAS)–associated genes. A, Heatmap of average expression of 3876 differentially expressed genes (DEGs) divided into 15 gene expression patters that best-matched cluster or cell type identity (for DEG selection, see Figure VIII in the Data Supplement). B, Enrichment of 74 CAD GWAS associated genes across the 15 gene expression patterns. C, D, and E, Heatmap of average relative expression of significantly enriched CAD genes from gene expression pattern no. 3, no. 8, and no. 14, respectively. Asterisk indicates significant enrichment. *P<0.05. ACTA2 indicates actin alpha 2, smooth muscle; and KIT, c-KIT.

References

    1. Benjamin EJ, Blaha MJ, Chiuve SE, Cushman M, Das SR, Deo R, de Ferranti SD, Floyd J, Fornage M, Gillespie C, et al. ; American Heart Association Statistics Committee and Stroke Statistics Subcommittee. Heart disease and stroke statistics-2017 update: a report from the American Heart Association. Circulation. 2017;135:e146–e603. doi: 10.1161/CIR.0000000000000485 - PMC - PubMed
    1. Turner AW, Wong D, Dreisbach CN, Miller CL. GWAS reveal targets in vessel wall pathways to treat coronary artery disease. Front Cardiovasc Med. 2018;5:72 doi: 10.3389/fcvm.2018.00072 - PMC - PubMed
    1. Winkels H, Ehinger E, Vassallo M, Buscher K, Dinh HQ, Kobiyama K, Hamers AAJ, Cochain C, Vafadarnejad E, Saliba AE, et al. Atlas of the immune cell repertoire in mouse atherosclerosis defined by single-cell RNA-sequencing and mass cytometry. Circ Res. 2018;122:1675–1688. doi: 10.1161/CIRCRESAHA.117.312513 - PMC - PubMed
    1. Cochain C, Vafadarnejad E, Arampatzi P, Pelisek J, Winkels H, Ley K, Wolf D, Saliba AE, Zernecke A. Single-Cell RNA-Seq reveals the transcriptional landscape and heterogeneity of aortic macrophages in murine atherosclerosis. Circ Res. 2018;122:1661–1674. doi: 10.1161/CIRCRESAHA.117.312509 - PubMed
    1. Kim K, Shim D, Lee JS, Zaitsev K, Williams JW, Kim KW, Jang MY, Seok Jang H, Yun TJ, Lee SH, et al. Transcriptome analysis reveals nonfoamy rather than foamy plaque macrophages are proinflammatory in atherosclerotic murine models. Circ Res. 2018;123:1127–1142. doi: 10.1161/CIRCRESAHA.118.312804 - PMC - PubMed

Publication types

MeSH terms