

A chronology of global air quality
- PMID: 32981430
- PMCID: PMC7536029
- DOI: 10.1098/rsta.2019.0314
A chronology of global air quality
Erratum in
-
Correction to 'A chronology of global air quality'.Philos Trans A Math Phys Eng Sci. 2021 Jul 12;379(2201):20210113. doi: 10.1098/rsta.2021.0113. Epub 2021 May 24. Philos Trans A Math Phys Eng Sci. 2021. PMID: 34024135 Free PMC article. No abstract available.
Abstract
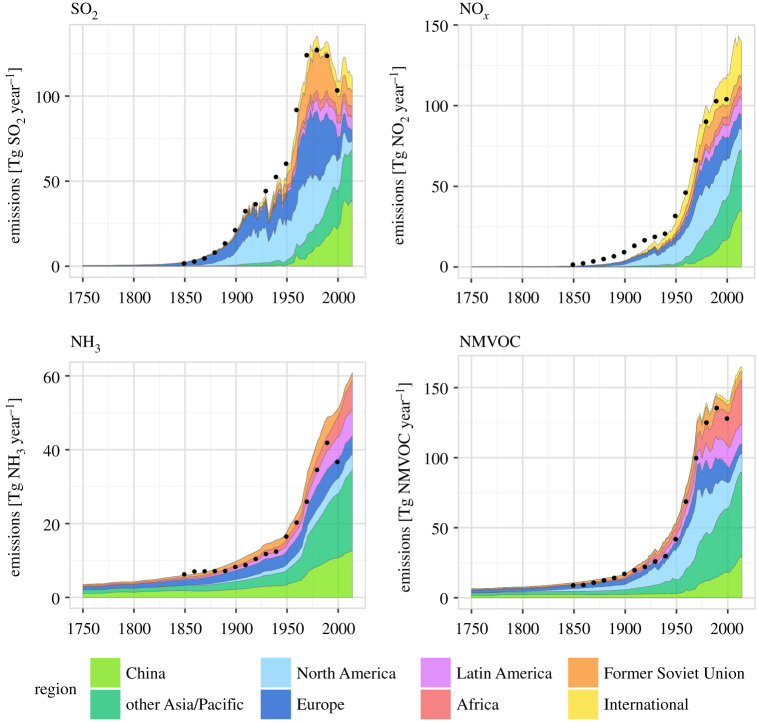
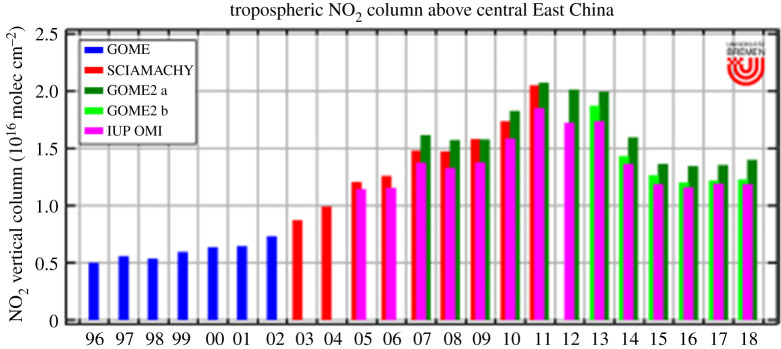
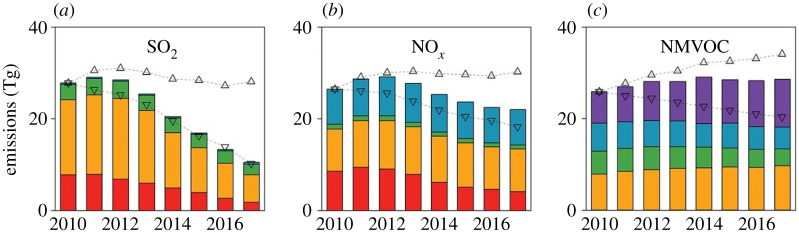
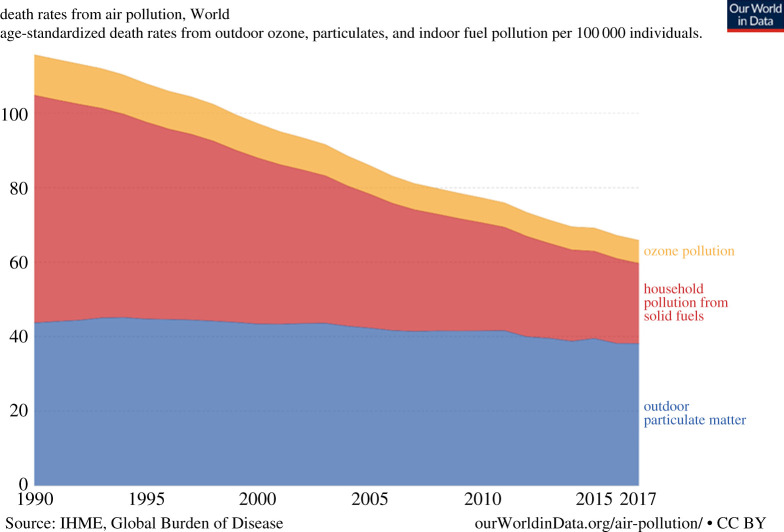
Air pollution has been recognized as a threat to human health since the time of Hippocrates, ca 400 BC. Successive written accounts of air pollution occur in different countries through the following two millennia until measurements, from the eighteenth century onwards, show the growing scale of poor air quality in urban centres and close to industry, and the chemical characteristics of the gases and particulate matter. The industrial revolution accelerated both the magnitude of emissions of the primary pollutants and the geographical spread of contributing countries as highly polluted cities became the defining issue, culminating with the great smog of London in 1952. Europe and North America dominated emissions and suffered the majority of adverse effects until the latter decades of the twentieth century, by which time the transboundary issues of acid rain, forest decline and ground-level ozone became the main environmental and political air quality issues. As controls on emissions of sulfur and nitrogen oxides (SO2 and NOx) began to take effect in Europe and North America, emissions in East and South Asia grew strongly and dominated global emissions by the early years of the twenty-first century. The effects of air quality on human health had also returned to the top of the priorities by 2000 as new epidemiological evidence emerged. By this time, extensive networks of surface measurements and satellite remote sensing provided global measurements of both primary and secondary pollutants. Global emissions of SO2 and NOx peaked, respectively, in ca 1990 and 2018 and have since declined to 2020 as a result of widespread emission controls. By contrast, with a lack of actions to abate ammonia, global emissions have continued to grow. This article is part of a discussion meeting issue 'Air quality, past present and future'.
Keywords: acid rain; air quality; eutrophication; ozone.
Conflict of interest statement
We declare we have no competing interests.
Figures

References
-
- Haagen-smit AJ. 1952. The chemistry and physiology of Los Angeles smog. Ind. Eng. Chem. 44, 1342–1346. (10.1021/ie50510a045) - DOI
-
- Gorham E, Gordon AG. 1960. Some effects of smelter pollution northeast of Falconbridge, Ontario. Canadian Journal of Botany 38, 307–312. (10.1139/b60-031) - DOI
-
- Colbeck I. 2007. Air pollution: history of actions and effectiveness of change. In Chapter 26 in The SAGE Handbook of Environment and Society (eds Pretty J, Ball AS, Benton T, Guivant JS, Lee DR, Orr D, Pfeffer MJ, Ward H), pp. 374–384. London, UK: SAGE Publications.
Publication types
MeSH terms
Substances
Grants and funding
LinkOut - more resources
Full Text Sources
Medical
Research Materials
Miscellaneous
