. 2020 Dec;35(6):555-575.
doi: 10.1177/0748730420957504. Epub 2020 Sep 28.

Inhibitor of DNA binding 2 (Id2) Regulates Photic Entrainment Responses in Mice: Differential Responses of the Id2-/- Mouse Circadian System Are Dependent on Circadian Phase and on Duration and Intensity of Light

Affiliations

Inhibitor of DNA binding 2 (Id2) Regulates Photic Entrainment Responses in Mice: Differential Responses of the Id2-/- Mouse Circadian System Are Dependent on Circadian Phase and on Duration and Intensity of Light

Giles E Duffield et al. J Biol Rhythms. 2020 Dec.

Abstract

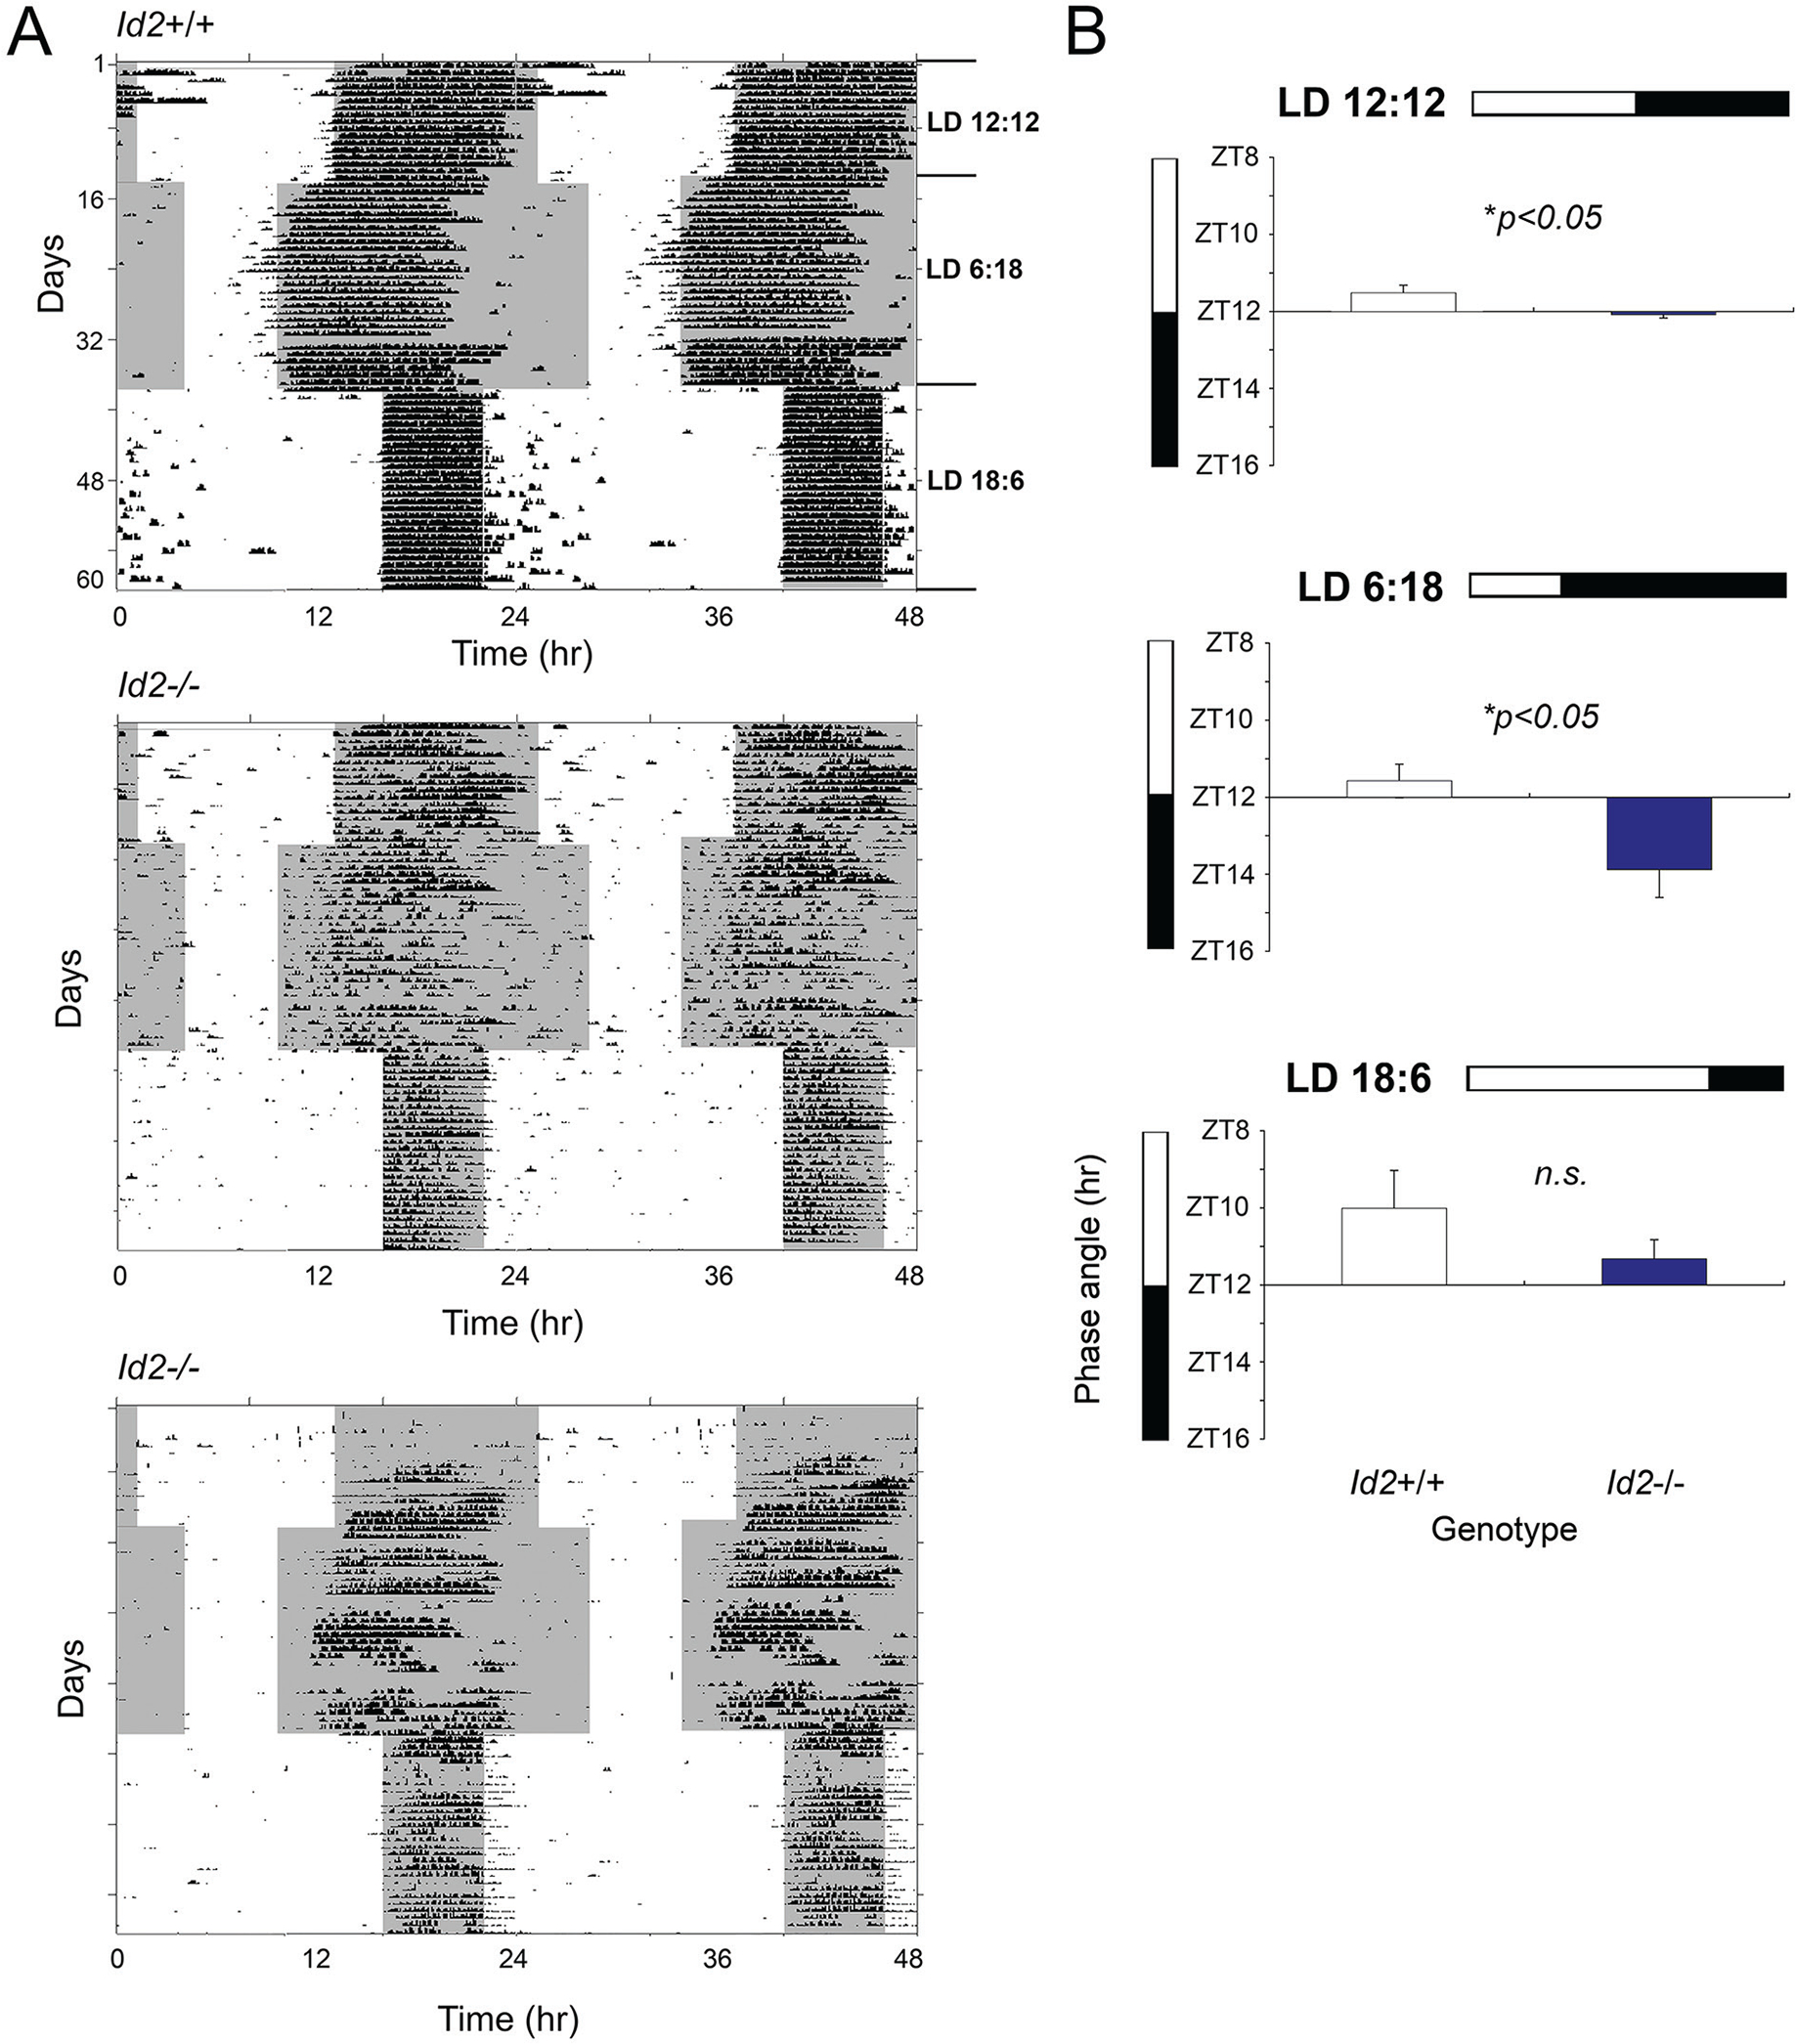
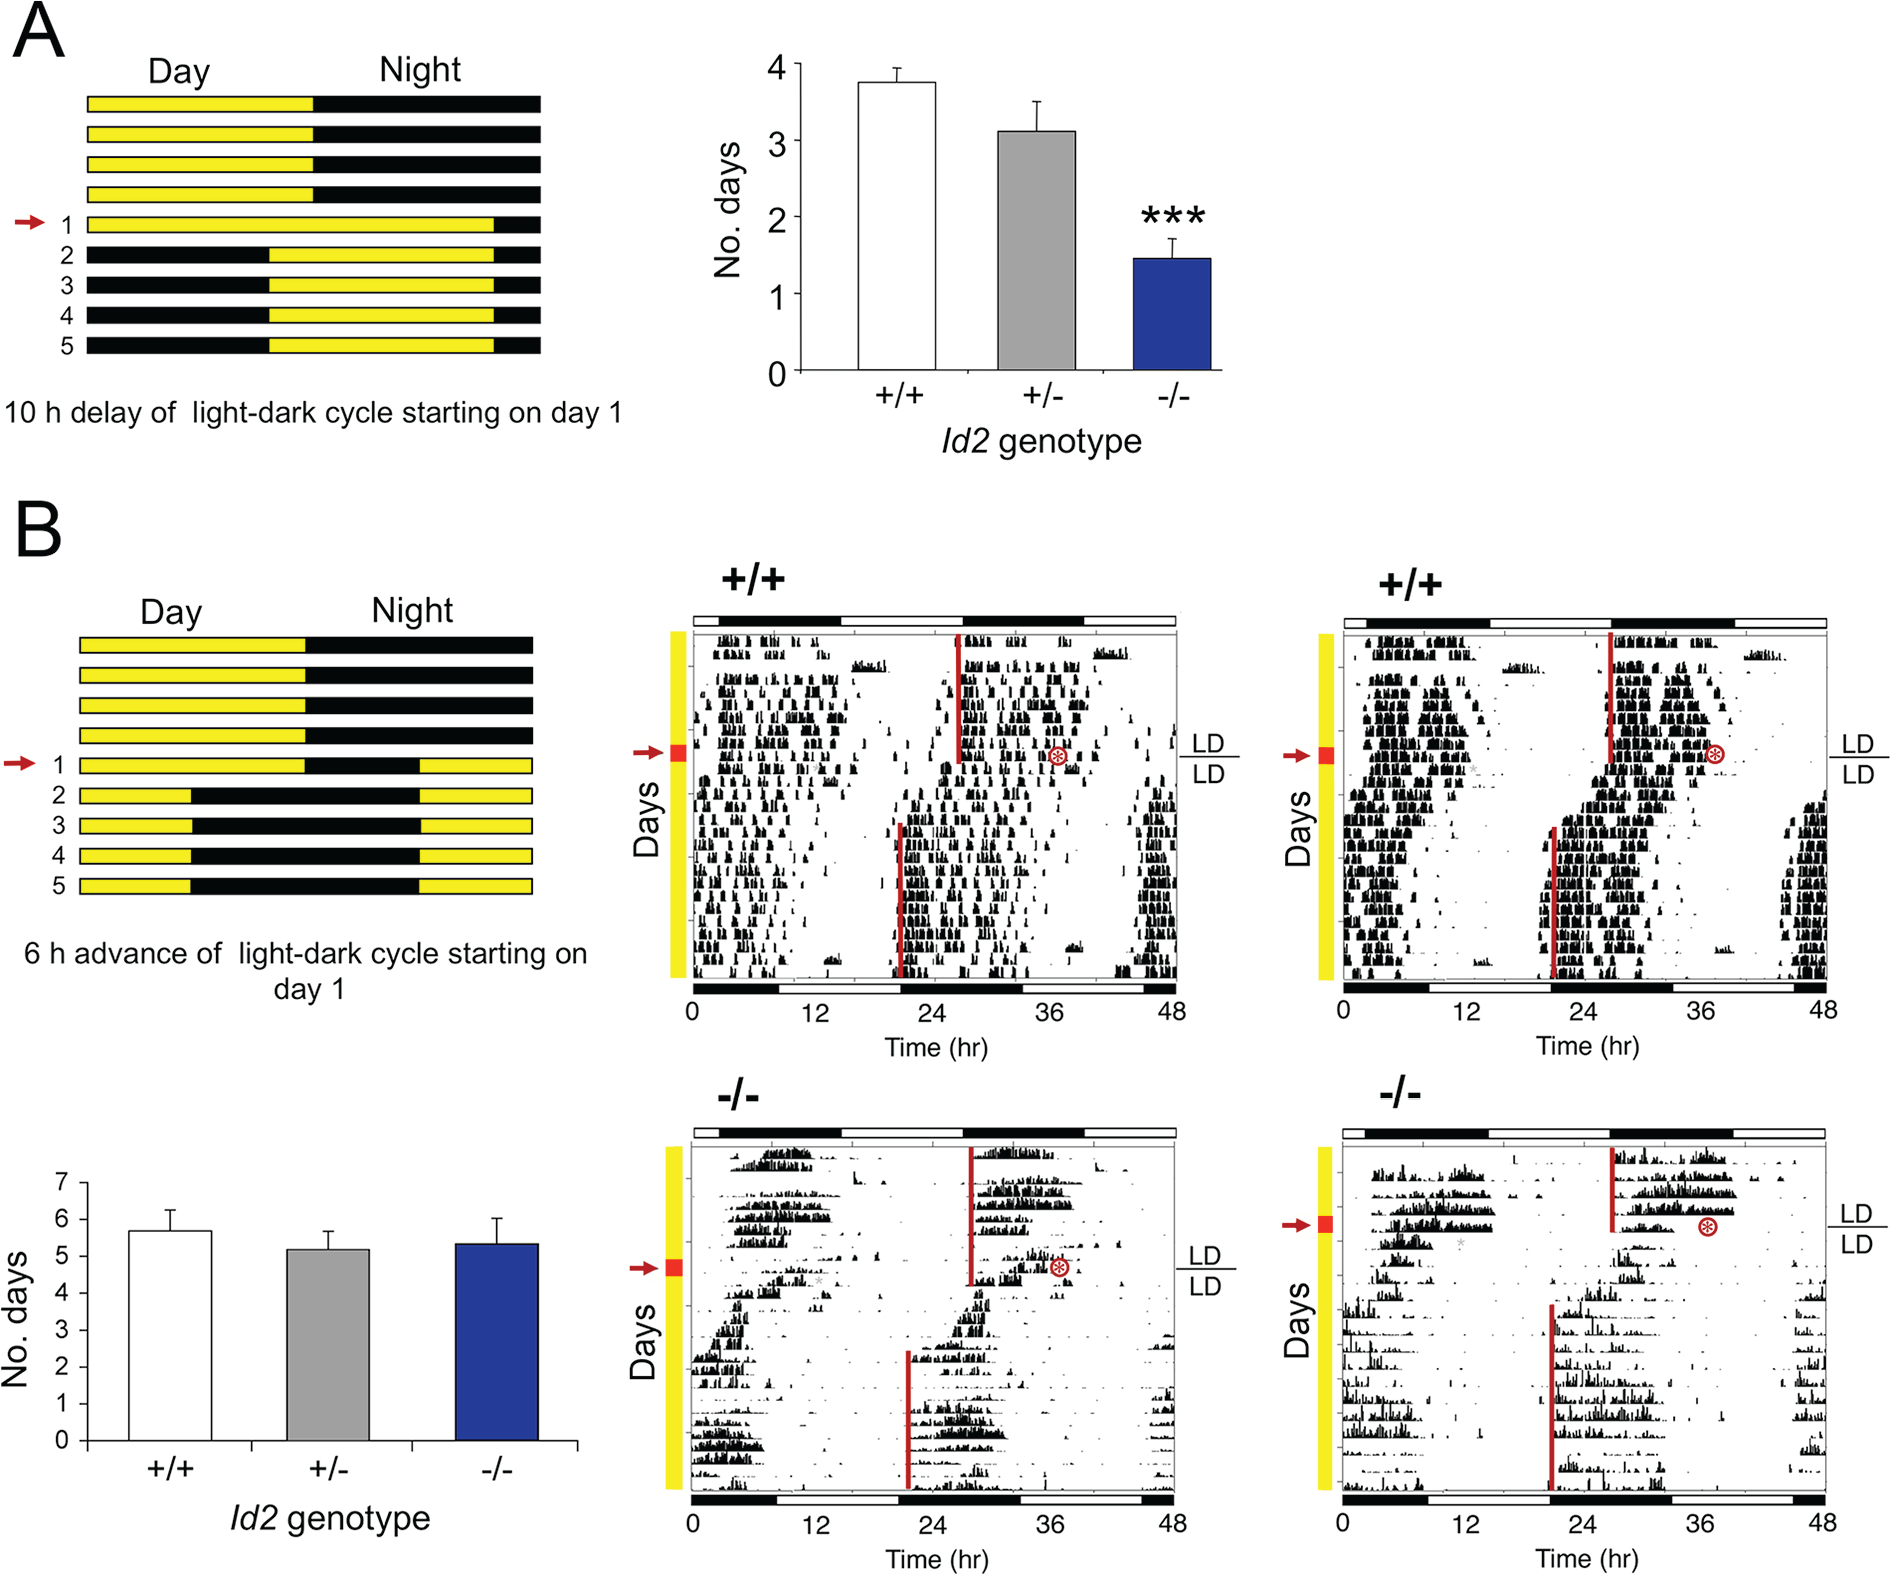
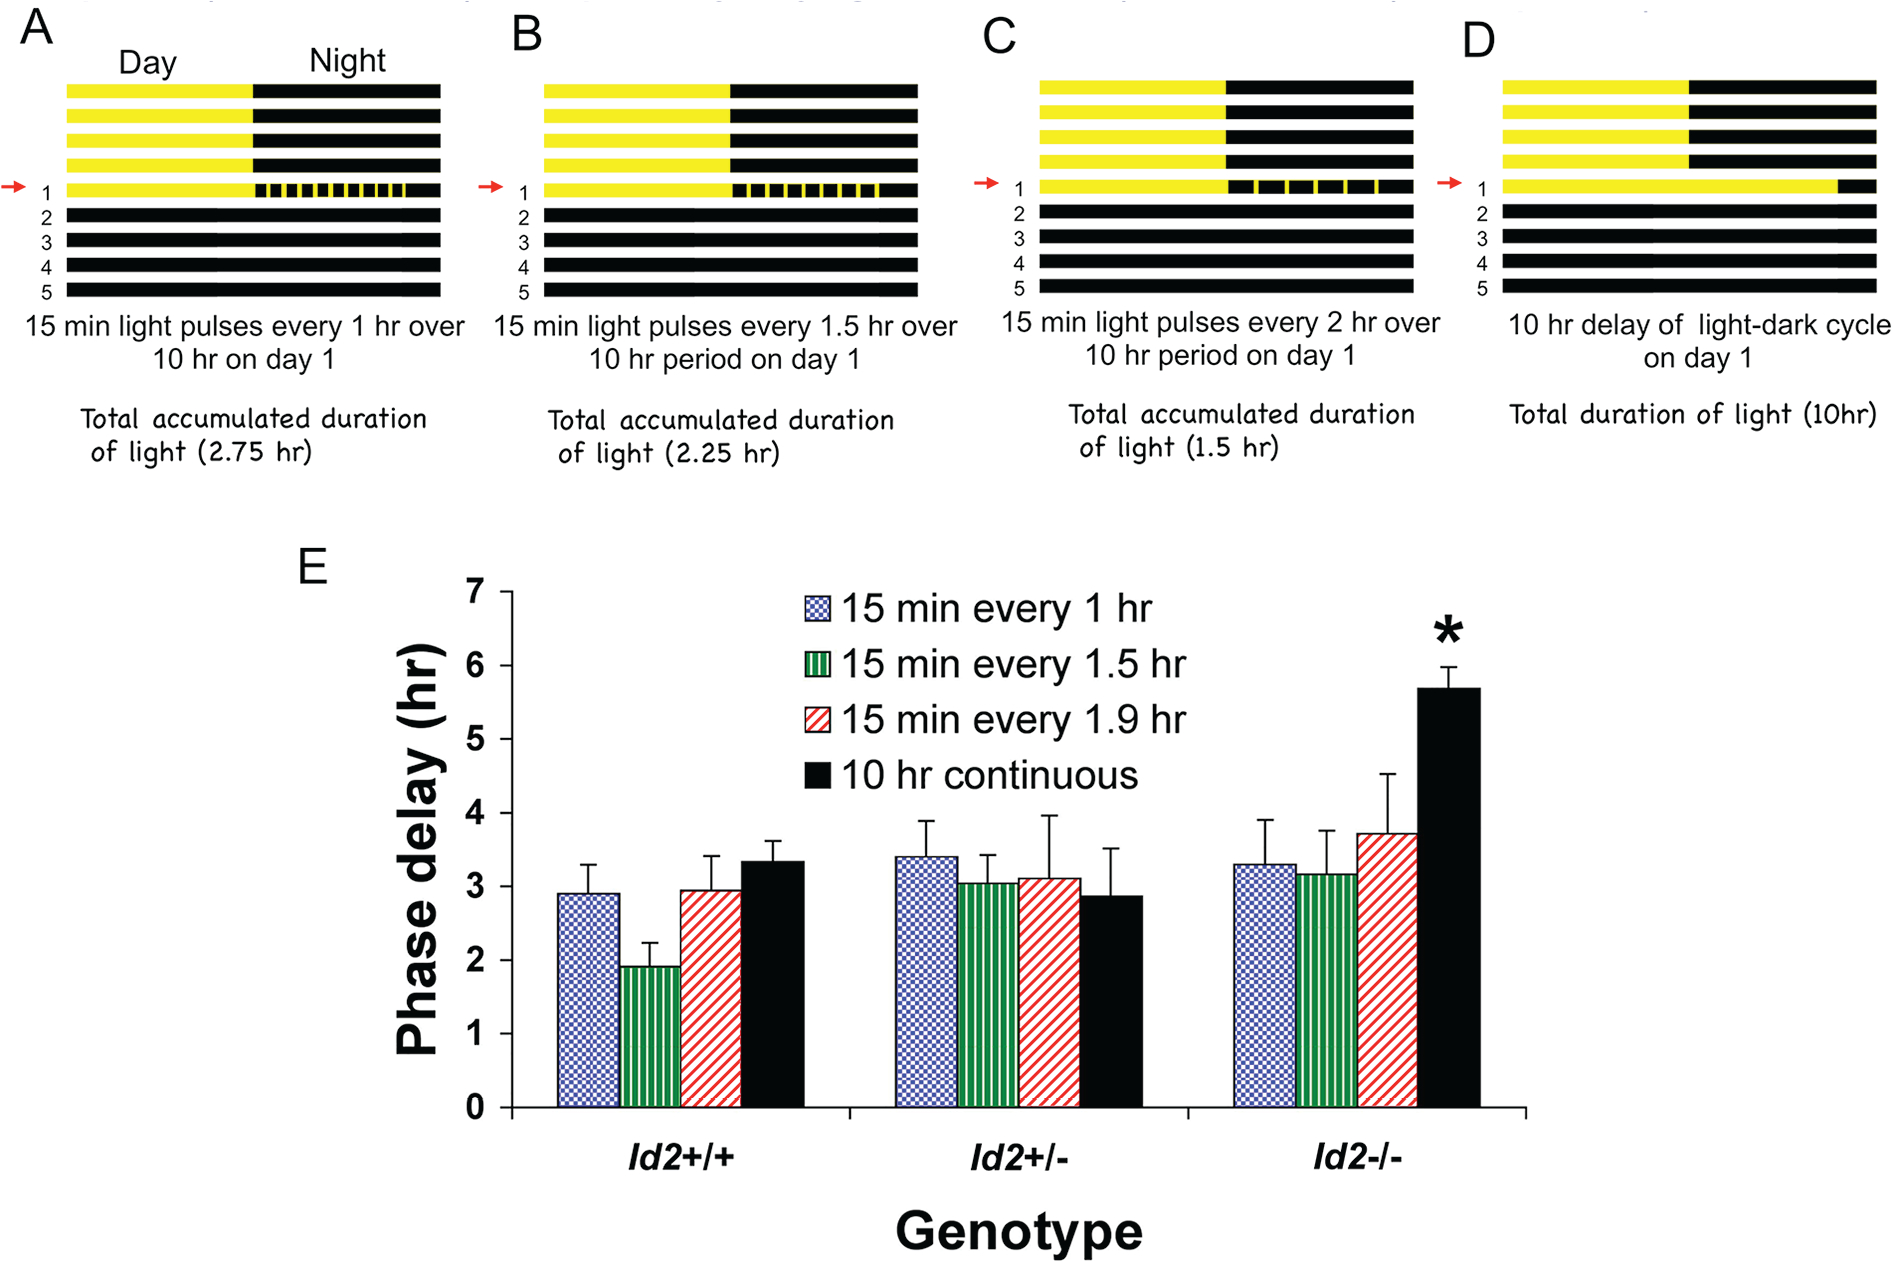
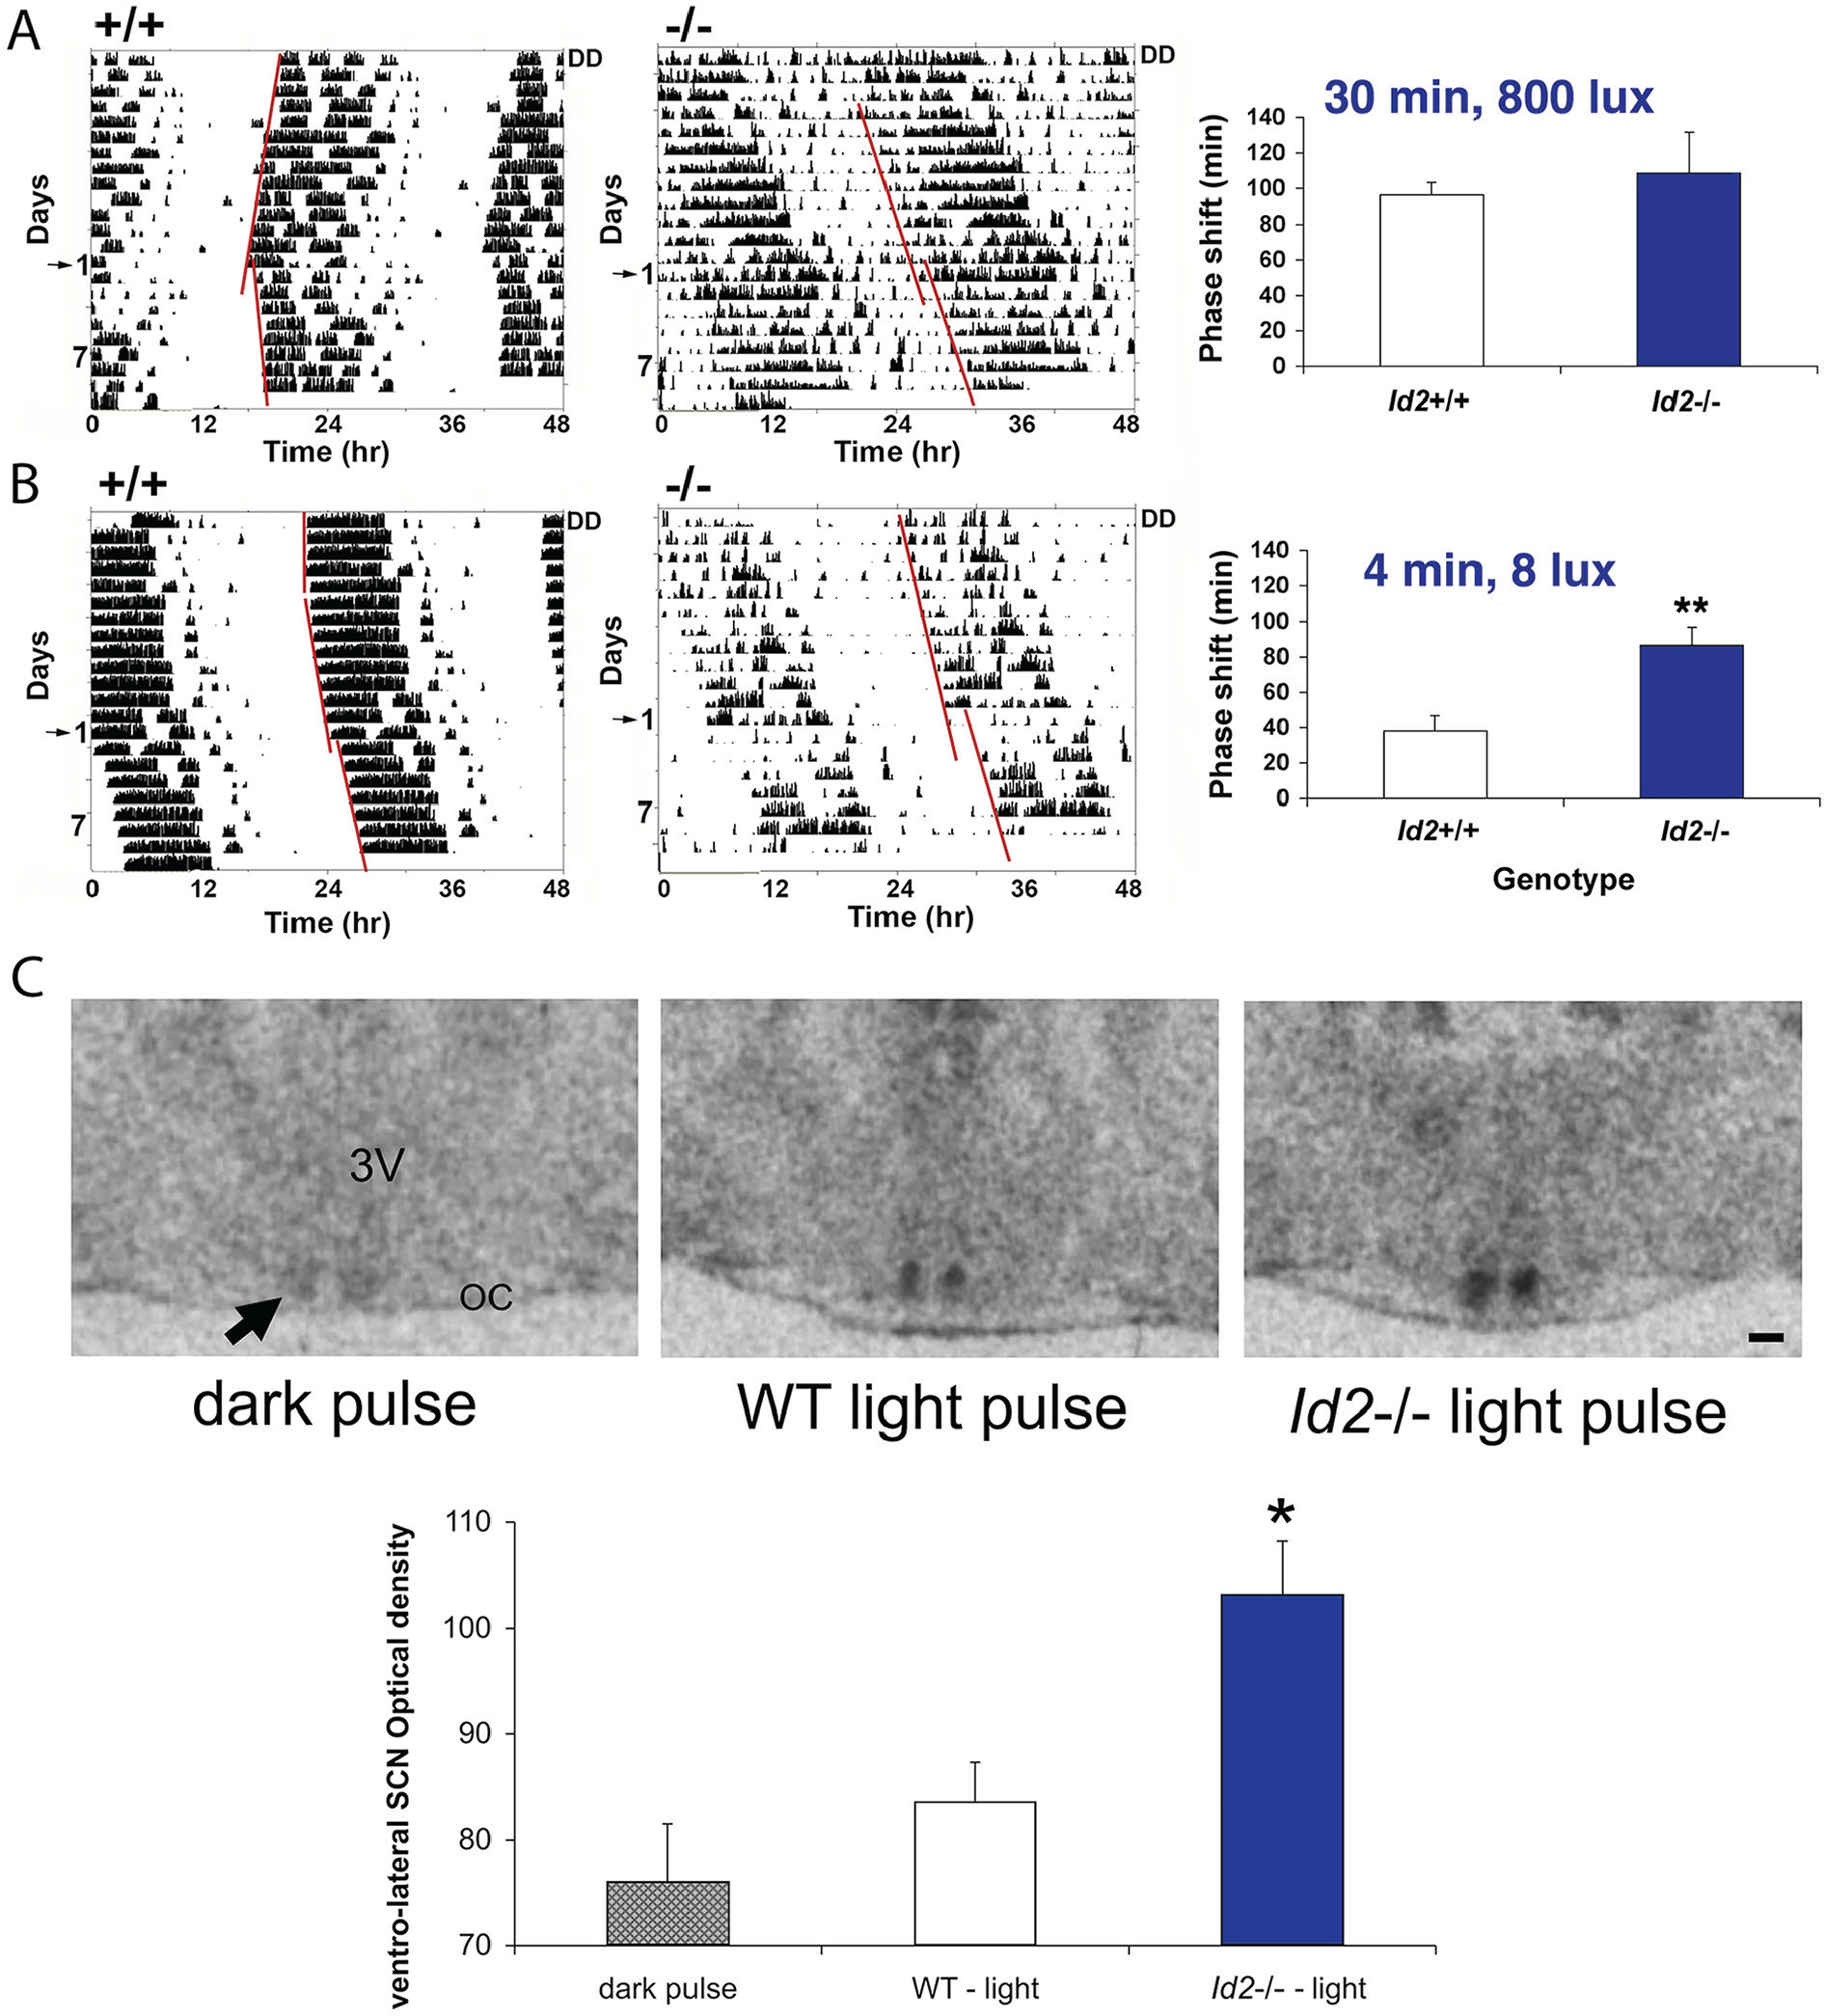
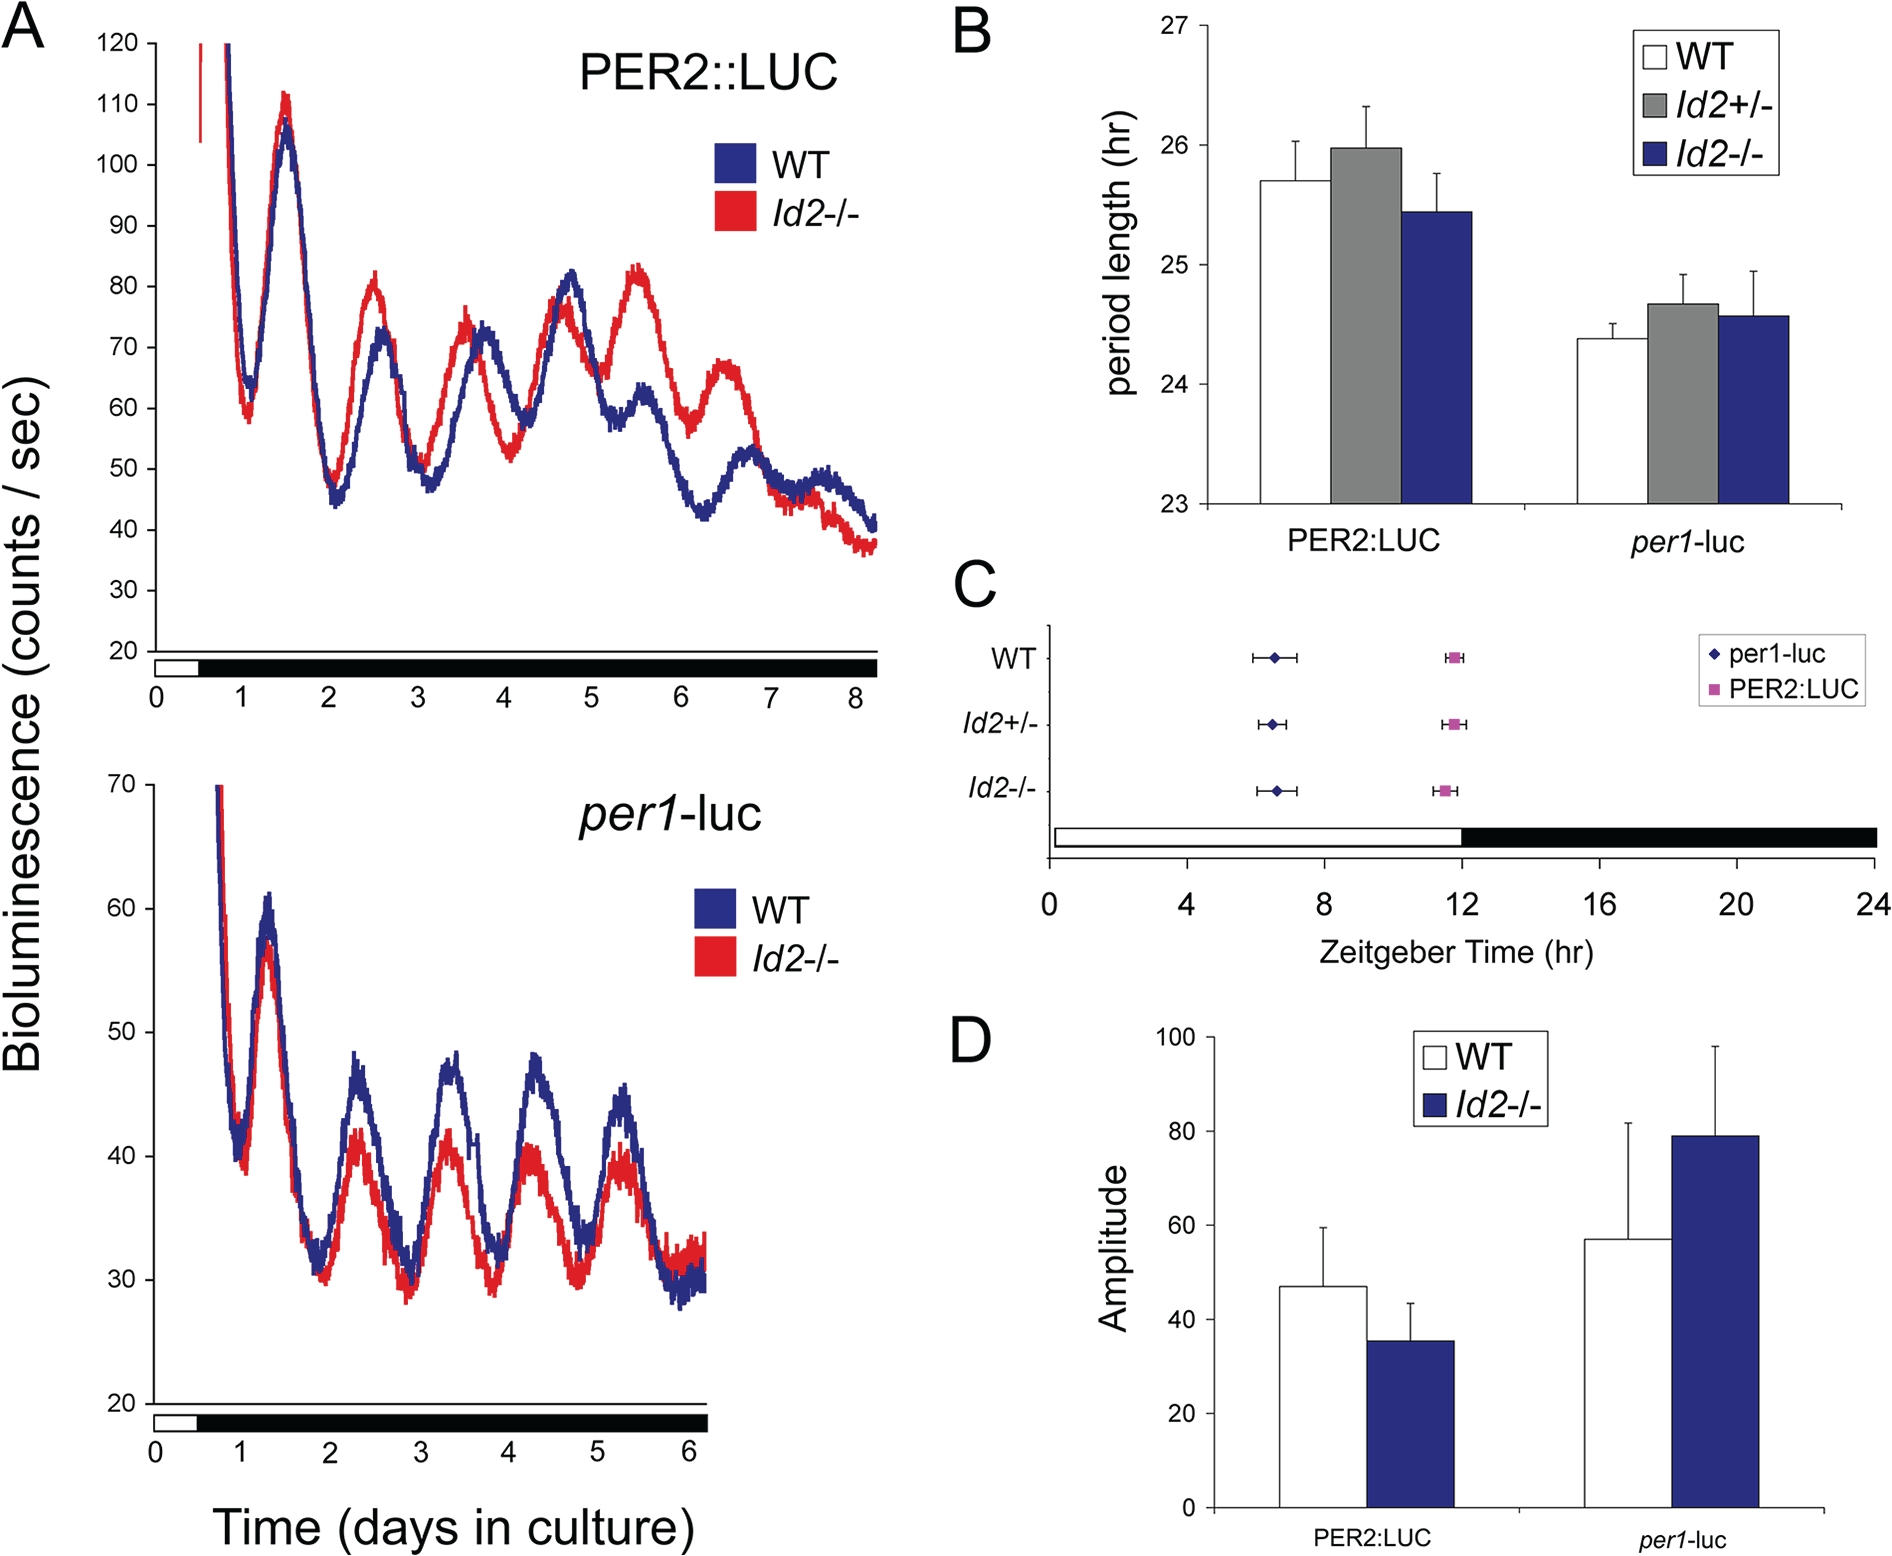
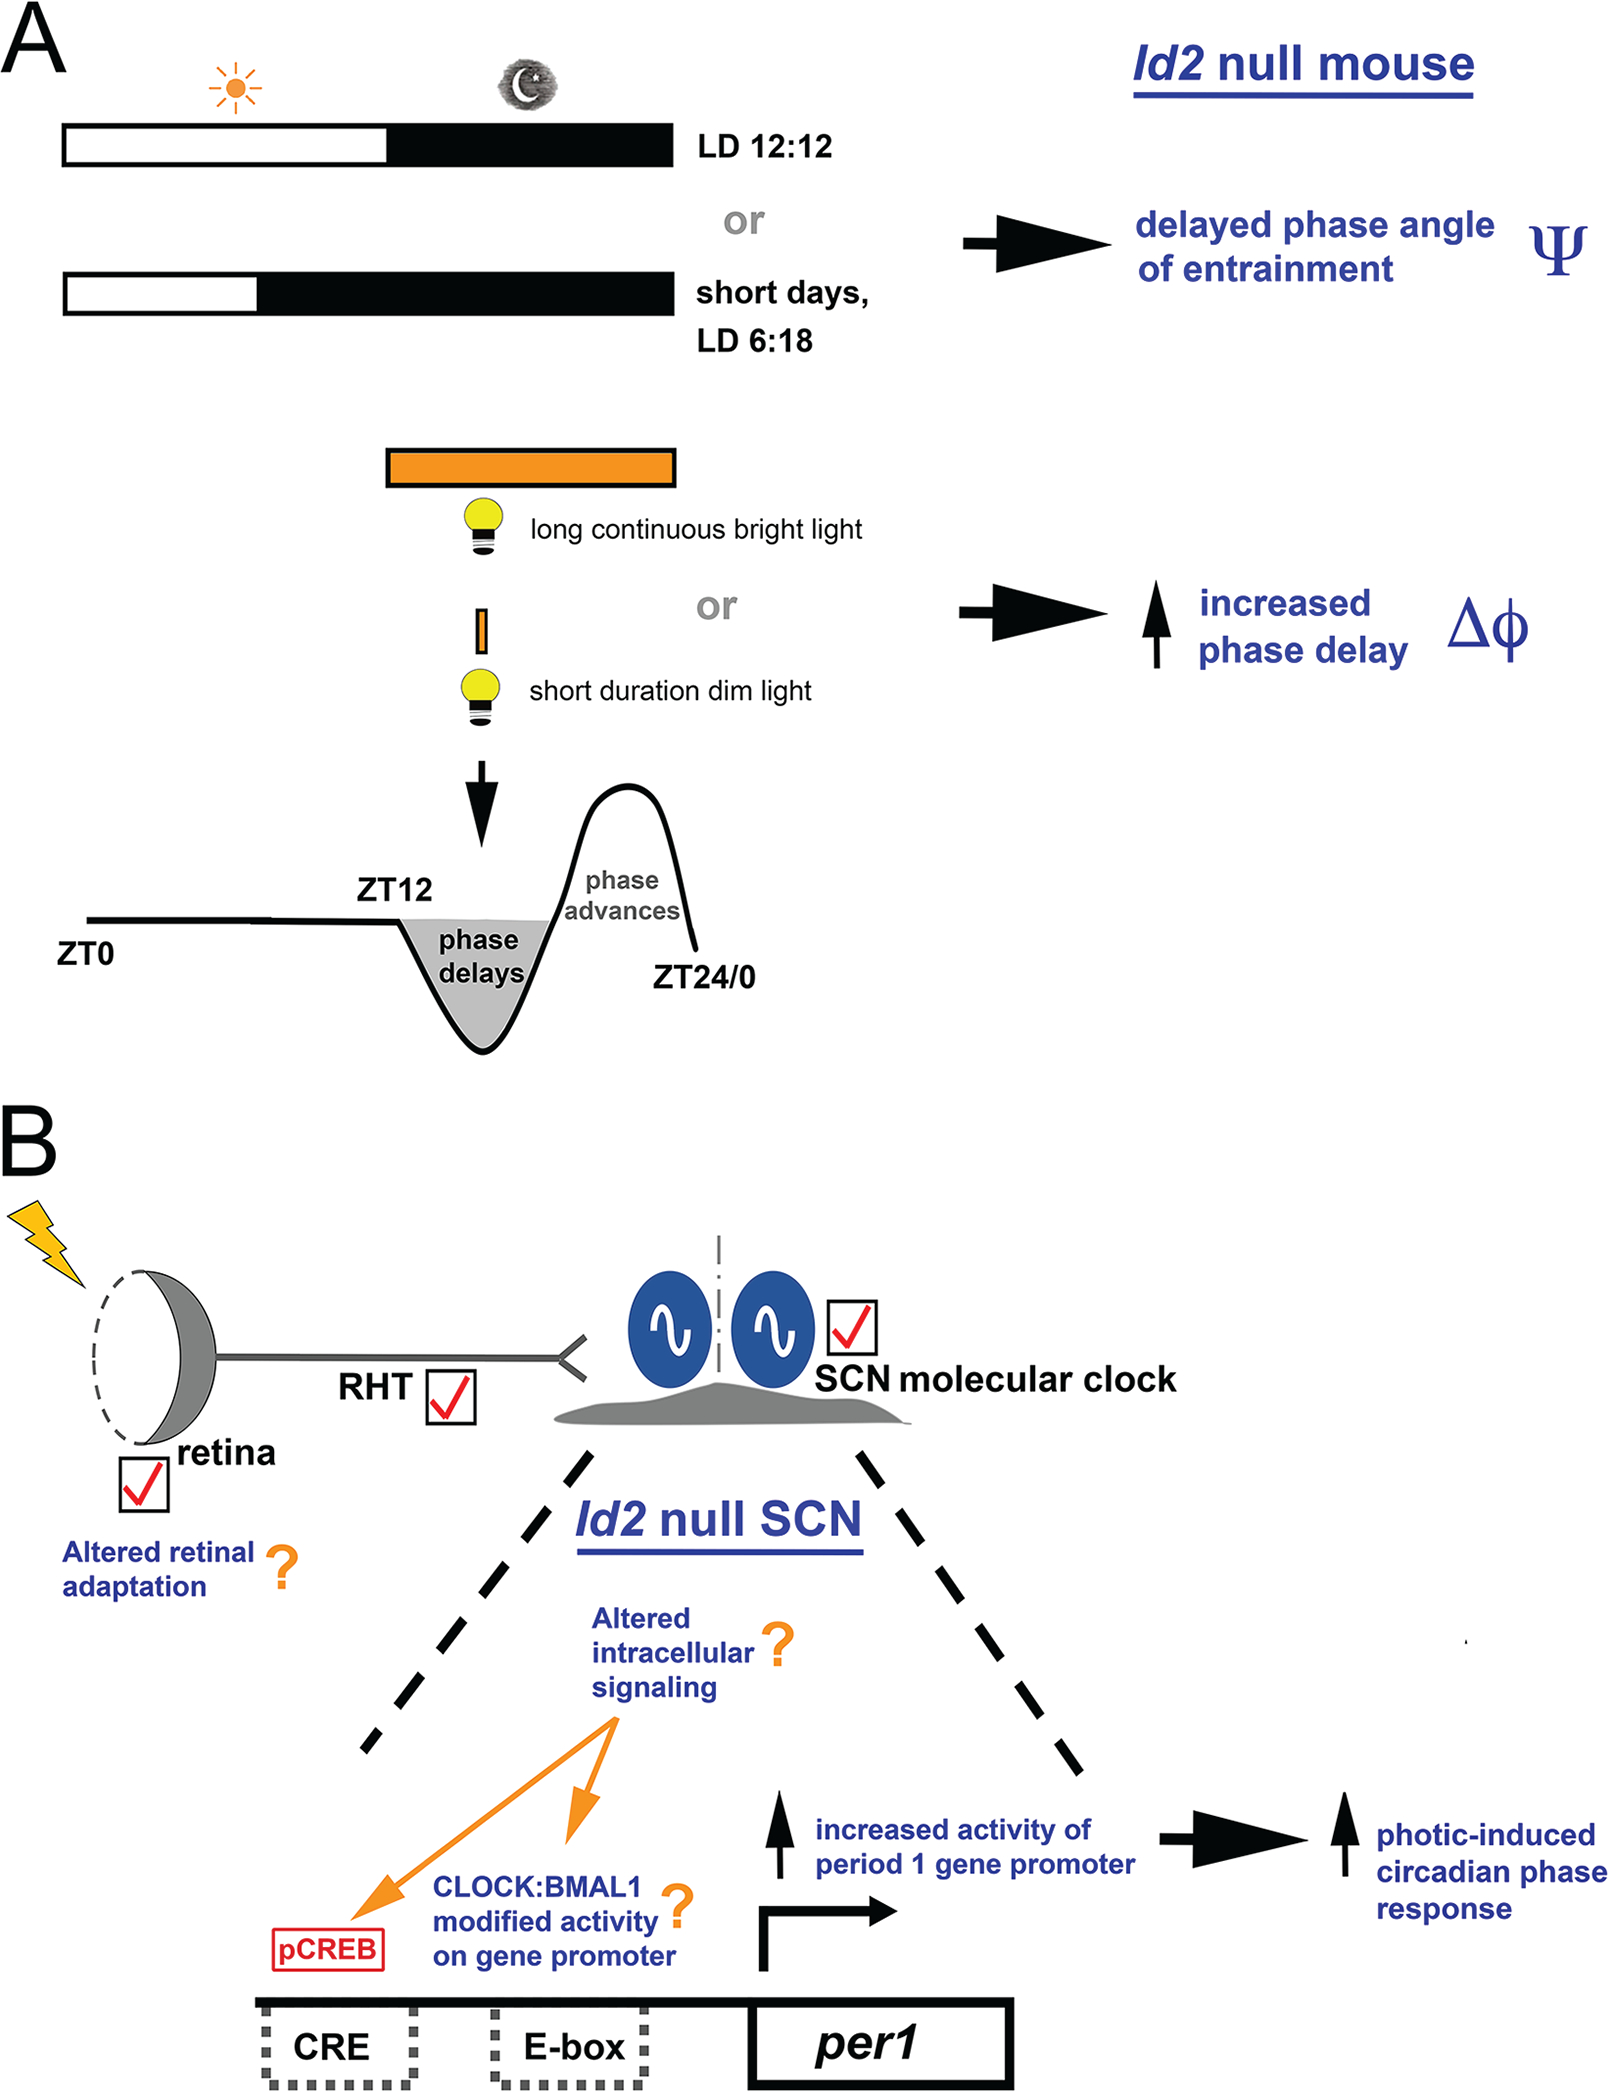
ID2 is a rhythmically expressed helix-loop-helix transcriptional repressor, and its deletion results in abnormal properties of photoentrainment. By examining parametric and nonparametric models of entrainment, we have started to explore the mechanism underlying this circadian phenotype. Id2-/- mice were exposed to differing photoperiods, and the phase angle of entrainment under short days was delayed 2 h as compared with controls. When exposed to long durations of continuous light, enhanced entrainment responses were observed after a delay of the clock but not with phase advances. However, the magnitude of phase shifts was not different in Id2-/- mice tested in constant darkness using a discrete pulse of saturating light. No differences were observed in the speed of clock resetting when challenged by a series of discrete pulses interspaced by varying time intervals. A photic phase-response curve was constructed, although no genotypic differences were observed. Although phase shifts produced by discrete saturating light pulses at CT16 were similar, treatment with a subsaturating pulse revealed a ~2-fold increase in the magnitude of the Id2-/- shift. A corresponding elevation of light-induced per1 expression was observed in the Id2-/- suprachiasmatic nucleus (SCN). To test whether the phenotype is based on a sensitivity change at the level of the retina, pupil constriction responses were measured. No differences were observed in responses or in retinal histology, suggesting that the phenotype occurs downstream of the retina and retinal hypothalamic tract. To test whether the phenotype is due to a reduced amplitude of state variables of the clock, the expression of clock genes per1 and per2 was assessed in vivo and in SCN tissue explants. Amplitude, phase, and period length were normal in Id2-/- mice. These findings suggest that ID2 contributes to a photoregulatory mechanism at the level of the SCN central pacemaker through control of the photic induction of negative elements of the clock.

Keywords: circadian rhythm; clock genes; light intensity; luciferase reporter; period gene; phase angle; phase shift; phase-response curve; photoentrainment; pupillometry.


Conflict of interest statement

CONFLICT OF INTEREST STATEMENT

The authors have no potential conflicts of interest with respect to the research, authorship, and/or publication of this article.

Figures

Figure 1.
Figure 1.. Id2 mutant mice exhibit a delayed phase angle of activity onset relative to lights-off under standard and short photoperiods.
(A) Locomotor activity records (wheel-running) of representative wild-type (Id2+/+) and Id2−/− mice under 12:12 (standard), 6:18 (short), and 18:6 (long) LD cycle conditions are shown in double-plotted format. Each horizontal line represents a 48-h period, and the second 24-h period is plotted to the right and below the first. Vertical bars represent periods of wheel-running activity. (B) Phase angle of activity onset to lights-off (zeitgeber time 12, ZT12) of wild-type and Id2−/− mice on 12:12, 6:18, and 18:6 LD cycles. Values are group means ± SEM for wild-type (n = 13) and Id2−/− (n = 14) mice. Significant differences between genotypes were detected (analysis of variance, followed by post hoc t tests, *p < 0.05). Color version of the figure is available online.
Figure 2.
Figure 2.. Id2 mutant mice show abnormally rapid entrainment to a delay but not to an advance of photo schedule.
(A) Wild-type and Id2−/− mice exposed to a 10-h delay of the LD cycle by a 10-h extension of the light phase on day 1 of the LD cycle. Mice were maintained on an LD cycle for at least 14 days and transferred to a new LD cycle. Protocol (left) and mean ± SEM numbers of days required for stable entrainment to the new photoschedule for wild-type (n = 11), heterozygote (n = 9), and mutant (n = 11) mice (right). Numbers on the left of the protocol indicate the number of days after the transition to the new LD cycle, and the arrow indicates the day of treatment (day 1). Values marked by asterisks are statistically significant; analysis of variance followed by Dunnett’s post hoc tests (***p < 0.001). Data in the histogram are reproduced from Duffield et al. (2009). (B) Wild-type and Id2−/− mice exposed to a 6-h advance of the LD cycle by shortening the light phase by 6 h on day 1 of the LD cycle. Protocol (top left) and representative locomotor activity records (wheel-running) of 2 wild-type and 2 Id2−/− mice (right). Numbers on the left of the protocol indicate the number of days after the transition to the new LD cycle, and the arrow indicates the day of treatment (day 1). The timing of the LD cycles on the actogram is indicated by the white/black bars above and below the records, and the yellow line on the left of the vertical axis shows the days before and after the transition to the new LD cycle. The red line and arrow on the left indicates the day of treatment (day 1), and the actual mid-time of treatment is marked by a red asterisk. A line is fitted to the phase of activity onset for several days before and after the shift of the LD cycle. Mean ± SEM numbers of days required for stable entrainment to the new photoschedule for wild-type (n = 12), heterozygote (n = 11), and mutant (n = 13) mice (bottom left). No significant difference was detected between genotypes (analysis of variance, n.s.).
Figure 3.
Figure 3.. Speed of circadian clock resetting is similar between Id2−/− and wild-type mice. Mice under free-running conditions in DD were subjected to 1 of 4 treatment regimens:
(A) a series of 15-min pulses of light delivered every 1 h over a 10-h period starting at ZT12, (B) a series of 15-min light pulses delivered every 1.5 h over a 10-h period starting at ZT12, (C) a series of 15-min light pulses delivered every 2 h over a 10-h period starting at ZT12, or (D) a 10-hour delay of the photocycle with an extension of the LD cycle with continuous light starting at ZT12. Numbers on the left of the protocol indicate the number of days following the transition to the new LD cycle, and the arrow on the left indicates the actual day of treatment (day 1). (E) Mean ± SEM magnitude of the phase delay for wild-type (n = 10), heterozygote (n = 5), and Id2−/− mutant mice (n = 12). No difference was observed between genotypes in the size of accumulative phase shifts in experiments testing the photo-refractory duration with a series of discrete light pulses (15 min, 250 lux) interspaced by varying time intervals (1, 1.5, and 1.9 h). Only the 10-h continuous light Id2−/− group showed a difference, consistent with previous experiments (see Fig. 2A). Analysis of variance followed by Dunnett’s post hoc tests, *p < 0.05 against all other groups. Color version of the figure is available online.
Figure 4.
Figure 4.. Id2−/− mice treated with a single subsaturating discrete light pulse produces a larger phase shift of the clock and an enhanced level of period 1 gene expression in the suprachiasmatic nucleus (SCN).
(A) A single saturating discrete light pulse at CT16 (30 min, 800 lux) results in a comparable size phase shift between genotypes. Wild-type and Id2−/− mice (n = 20 and 16, respectively) were maintained in DD, and wheel-running activity and general activity (passive infrared motion detector) were recorded. Representative wild-type (WT) wheel-running activity (left) and Id2−/− general activity, as measured by a passive infrared motion detector (right), are presented. Numbers on the left indicate the number of days following the light treatment, with day 1 marked by the arrow on the left, being the day of treatment. A line is fitted to the phase of activity onset before and after the light treatment, and the time difference between the 2 lines is the measured phase delay of the free-running rhythm. No difference was observed between genotypes in the magnitude of phase shifts (analysis of variance [ANOVA] followed by post hoc t tests, n.s.), consistent with data shown in Supplemental Figure S1. (B). A single subsaturating discrete light pulse at CT16 (4 min, 8 lux) produced a 1.9-fold increase in the magnitude of the phase shift. Representative WT wheel-running activity (left) and Id2−/− wheel-running activity (right) are presented. Treatment of wild-type (n = 15) and Id2−/− mice (n = 10) with short duration/low light resulted in a significant difference in phase response between genotypes (ANOVA followed by post hoc t tests, **p < 0.01). (C). Light induction of per1 gene expression is increased in the Id2−/− mouse suprachiasmatic nucleus following a subsaturating discrete light pulse at CT16 (4 min, 8 lux). Wild-type and Id2−/− mice treated with 4 min of light (8 lux) at CT16 and brain harvested 1 h later; per1 gene expression assessed by in situ hybridization using a radiolabeled probe, n = 2 to 4, 12-μm coronal sections per animal (WT/Id2−/− dark pulse, n = 7; WT light pulse, n = 6; Id2−/− light pulse, n = 6). 3V, third ventricle; OC, optic chiasm. The arrow marks the SCN region. Scale bar = 100 μm. Quantification of expression in the ventrolateral SCN. A template of the light-induced zone was applied to all sections, and data were normalized to signal intensities in the corpus callosum. WT and Id2−/− dark pulse controls, with relative expression values of 78.3 ± 9.3 and 74.5 ± 7.5 (mean ± SEM), respectively, were combined for the purposes of statistical analysis. Significant elevation observed in per1 expression in Id2−/− relative to WT mice (ANOVA, followed by Dunnett’s post hoc tests, *p < 0.05). Color version of the figure is available online.
Figure 5.
Figure 5.. Period length, phase, and amplitude of suprachiasmatic nucleus (SCN) PER2::LUCIFERASE and per1-luciferase rhythmic expression are comparable between Id2−/− and wild-type mice.
(A) Representative raw bioluminescent time-course data from 300-μm SCN tissue explants from PER2::LUC (top) and per1-luc (bottom) adult mice crossed with Id2-null mice. Wild-type and Id2−/− SCN. (B) Mean ± SEM period length determinations. No significant differences in period lengths were found between genotypes Id2+/+, Id2+/−, or Id2−/− (analysis of variance, n.s.). SCN tissue was derived from PER2::LUC or per1-luc wild type (n = 5, 6), Id+/− (n = 8, 15), and Id2−/− (n = 8, 6) mice and prepared between ZT8 and ZT11.5 from mice on a 12:12 LD cycle. (C) Mean ± SEM phase determinations. There was no difference in phase between genotypes for PER2::LUC (analysis of variance [ANOVA,[ n.s.; squares) or per1-luc (ANOVA, n.s.; diamonds) mice. Peak phase was highly conserved between samples: PER2::LUC peaked in the first full cycle at ~ZT12.0 and per1-luc at ~ZT6.5. PER2::LUC or per1-luc wild type (n = 7, 6), Id+/− (n = 9, 18), and Id2−/− (n = 9, 7) SCN. (D) Mean ± SEM amplitude determinations. The mean amplitude of the first 1 days of rhythms displayed no significant difference between wild type and Id2−/− for both PER2::LUC and per1-luc mice (t test, n.s). Amplitude was defined as the mean acrophase-nadir counts per second (cps) from the first 3 cycles. PER2::LUC or per1-luc wild type (n = 7, 7) and Id2−/− (n = 10, 8) SCN. Color version of the figure is available online.
Figure 6.
Figure 6.. Absence of ID2 results in an altered photic responsiveness of the circadian system.
(A) Id2−/− mice, under conditions of 12:12 LD or a short-day photoperiod exhibit a delayed phase angle of entrainment (Ψ) relative to wild-type (WT) mice. Long bright-light exposure during the delay portion of the phase-response curve (PRC) (parametric entrainment) or a short duration/dim light (nonparametric entrainment) produces a larger phase delay of the clock (Δϕ) and faster entrainment. These properties of the clock cannot be explained by standard models of parametric and nonparametric entrainment, tested in various ways. The timing of the LD cycles is indicated by the white/black bars. The delay portion of the PRC is highlighted in gray to signify the phase of the cycle with a change in photic response. (B). The SCN is the likely locus of the Id2−/− photic responsiveness phenotype. The retina and retinal hypothalamic tract (RHT) structure/function are normal in Id2−/− mice, as is the phase, period length, and amplitude of SCN clock gene expression. The tick mark signifies a “normal” anatomy or function in the photoentrainment–circadian clock pathway, although a retinal contribution to the phenotype cannot be entirely excluded. In the Id2−/− mouse, short duration/dim light activates the SCN cells and increases activity of the period 1 clock gene promoter, as demonstrated by the elevation of light-induced per1 expression compared with WT mice. Likely targets for ID2 modulation of photoentrainment are CLOCK and BMAL1 via direct protein interaction with and inhibition by ID2 (Ward et al., 2010) and/or altered intracellular signaling that culminates in E-box and/or Ca2+/cAMP response element (CRE) activation at the per1 gene promoter. As per1 is a light-inducible state variable of the clock, a change in per1 expression produces a phase shift of the clock (Duffield et al., 2009; Ward et al., 2010). Thus, an enhanced responsiveness of this input pathway in Id2−/− mice results in increased photic-induced phase changes of the circadian pacemaker. CLOCK:BMAL1, heterodimer of bHLH-PAS transcription factors; pCREB, phosphorylated Ca2+/cAMP response element-binding protein. Color version of the figure is available online.

Similar articles

Cited by

References

    1. Adachi AA, Fujioka A, Nagano M, Masumoto KH, Takumi T, Yoshimura T, Ebihara S, Mori K, Yokota Y, and Shigeyoshi Y (2013) Helix-loop-helix protein Id2 stabilizes mammalian circadian oscillation under constant light conditions. Zoolog Sci 30:1011–1018. - PubMed
    1. Albrecht U, Sun ZS, Eichele G, and Lee CC (1997) A differential response of two putative mammalian circadian regulators, mper1 and mper2, to light. Cell 91:1055–1064. - PubMed
    1. Aschoff J (1979) Circadian rhythms: influences of internal and external factors on the period measured in constant conditions. Z Tierpsychol 49:225–249. - PubMed
    1. Berson DM (2003) Strange vision: ganglion cells as circadian photoreceptors. Trends Neurosci 26:314–320. - PubMed
    1. Best JD, Maywood ES, Smith KL, and Hastings MH (1999) Rapid resetting of the mammalian circadian clock. J Neurosci 19:828–835. - PMC - PubMed

Publication types

MeSH terms

Substances

LinkOut - more resources