Meta-Analysis
. 2021 Jan;23(1):13-21.
doi: 10.1038/s41436-020-00971-4. Epub 2020 Sep 28.

Impact of newborn screening and quality of therapy on the neurological outcome in glutaric aciduria type 1: a meta-analysis

Affiliations
Meta-Analysis

Impact of newborn screening and quality of therapy on the neurological outcome in glutaric aciduria type 1: a meta-analysis

Nikolas Boy et al. Genet Med. 2021 Jan.

Abstract

Purpose: Glutaric aciduria type 1 (GA1), a rare inherited neurometabolic disorder, results in a complex movement disorder (MD) with predominant dystonia if untreated. Implementation into newborn screening (NBS) programs and adherence to recommended therapy are thought to improve the neurological outcome.

Methods: Systematic literature search for articles published from 2000 to 2019 was performed using the PRISMA protocol. Studies reporting on more than one individual identified by NBS were included. We investigated effects of interventional and noninterventional variables on neurological outcome.

Results: Fifteen publications reporting on 647 GA1 patients were included. In the NBS group (n = 261 patients), 195 patients remained asymptomatic (74.7%), while 66 patients (25.3%) developed a MD. Compared with the NBS group, a much higher proportion of patients (349/386; 90.4%; p < 0.0001) diagnosed after the manifestation of neurologic symptoms had a MD and an abnormal motor development (285/349; 81.7%; p < 0.0001). For NBS patients, deviations from the recommended diet increased the risk of insidious onset MD, while delayed start of emergency treatment increased the risk of acute onset MD.

Conclusions: This meta-analysis demonstrates that NBS programs for GA1 have an overall positive effect on the neurological outcome of affected individuals but their success critically depends on the quality of therapy.

Keywords: glutaric acidemia type 1; glutaric aciduria type 1; newborn screening; outcome; meta-analysis.


Conflict of interest statement

The authors declare no conflicts of interest.

Figures

Fig. 1
Fig. 1. PRISMA flow diagram.
The PRISMA flow diagram of systematic literature search demonstrates the flow of information of the meta-analysis. A total of 15 publications reporting on newborn screening (NBS) patients (n = 11 for targeted metabolic studies [TMS]) were included into quantitative synthesis after other publications were excluded with reasons. For detailed reasons for exclusion of studies, see Supplementary Tables 2 and  4.
Fig. 2
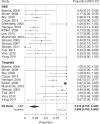
Fig. 2. Motor development (normal vs delayed) in patients diagnosed by NBS and Targeted screening.
The Random Effect (RE) model measures the mean weighted effect size (indicated by diamonds) and CI (confidence interval). Each square size reflects the study weight. a Patients identified by NBS show a significantly higher rate of normal motor development (84.4%). Test of Moderators (coefficient(s) 2): QM(df = 1) = 61.57, p < 0.0001, I2 (residual heterogeneity/unaccounted variability): 61.38%. The funnel plot showed no remarkable publication bias (for details see Fig. S2A). b Patients identified by NBS show a significantly lower rate of delayed motor development (14.9%) than patients identified by TMS. Test of Moderators (coefficient(s) 2): QM(df = 1) = 54.52, p < 0.0001, I2 (residual heterogeneity/unaccounted variability): 66.05%. The funnel plot showed no remarkable publication bias (for details see Fig. S2B).
Fig. 3
Fig. 3. Forest plot for frequency of movement disorders.
Patients identified by newborn screening (NBS) show a significantly lower rate of movement disorders than patients identified by targeted metabolic studies (TMS). CI confidence interval, RE random effect. Test of moderators (coefficient[s] 2): QM(df = 1) = 41.50, p < 0.0001. I2 (residual heterogeneity/unaccounted variability): 71.93%. Funnel plot showed no remarkable publication bias. (for details see Fig. S3).
Fig. 4
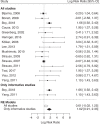
Fig. 4. Forest plot for effect of maintenance treatment (MT) adherence and development of insidious onset movement disorder (MD) in patients identified by newborn screening (NBS) including and excluding noninformative studies.
In contrast to noninformative studies, informative studies compare two different interventions groups within one study. Patients not following MT recommendations show a trend for increased relative risk (log risk ratio [RR]) for development of an insidious MD compared with patients with MT adherence (p = 0.058; log RR 0.61). This effect becomes clearly significant if noninformative studies are excluded (p < 0.0001) increasing the RR to almost exp(2) = 7. CI confidence interval, RE random effect. Including noninformative studies: test of heterogeneity: QM(df14) = 29.1436; model results: p = 0.0585. I2 (residual heterogeneity/unaccounted variability): 51.28%. Excluding noninformative studies: test for heterogeneity: Q(df = 1) = 0.1765; model results: p < 0.0001. I2 (residual heterogeneity/unaccounted variability): 0%.
Fig. 5
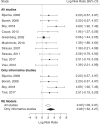
Fig. 5. Forest plot for effect of delayed emergency treatment (ET) on development of acute onset movement disorder (MD) in patients identified by newborn screening (NBS) including and excluding noninformative studies.
Patients with delayed ET show an increased relative risk (log risk ratio) for development of an acute onset MD compared with patients with adequate ET (p < 0.0001). The relative risk increases further if noninformative studies are excluded (p < 0.0001). CI confidence interval, RE random effect. Including noninformative studies: test of heterogeneity: QM(df = 9) = 6.26, p = 0.7132; model results: p < 0.0001. I2 (residual heterogeneity/unaccounted variability): 0%. Excluding noninformative studies: test of heterogeneity QM(df = 3) = 2.1756, p = 0.5368; model results: p < 0.0001. I2 (residual heterogeneity/unaccounted variability): 0%.

References

    1. Boy N, Mengler K, Thimm E, Schiergens KA, Marquardt T, Weinhold N, et al. Newborn screening: a disease-changing intervention for glutaric aciduria type 1. Ann Neurol. 2018;83:970–979. doi: 10.1002/ana.25233. - DOI - PubMed
    1. Morton DH, Bennett MJ, Seargeant LE, Nichter CA, Kelley RI. Glutaric aciduria type I: a common cause of episodic encephalopathy and spastic paralysis in the Amish of Lancaster County, Pennsylvania. Am J Med Genet. 1991;41:89–95. doi: 10.1002/ajmg.1320410122. - DOI - PubMed
    1. Basinger AA, Booker JK, Frazier DM, Koeberl DD, Sullivan JA, Muenzer J. Glutaric acidemia type 1 in patients of Lumbee heritage from North Carolina. Mol Genet Metab. 2006;88:90–92. doi: 10.1016/j.ymgme.2005.12.008. - DOI - PubMed
    1. Naughten ER, Mayne PD, Monavari AA, Goodman SI, Sulaiman G, Croke DT. Glutaric aciduria type I: outcome in the Republic of Ireland. J Inherit Metab Dis. 2004;27:917–920. doi: 10.1023/B:BOLI.0000045777.82784.74. - DOI - PubMed
    1. van der Watt G, Owen EP, Berman P, Meldau S, Watermeyer N, Olpin SE, et al. Glutaric aciduria type 1 in South Africa-high incidence of glutaryl-CoA dehydrogenase deficiency in black South Africans. Mol Genet Metab. 2010;101:178–182. doi: 10.1016/j.ymgme.2010.07.018. - DOI - PubMed

Publication types

MeSH terms

Substances

Supplementary concepts