. 2020 Sep 15:348:113745.
doi: 10.1016/j.icarus.2020.113745. Epub 2020 Mar 16.

Bolometric Bond Albedo and Thermal Inertia Maps of Mimas

Affiliations

Bolometric Bond Albedo and Thermal Inertia Maps of Mimas

C J A Howett et al. Icarus. .

Abstract

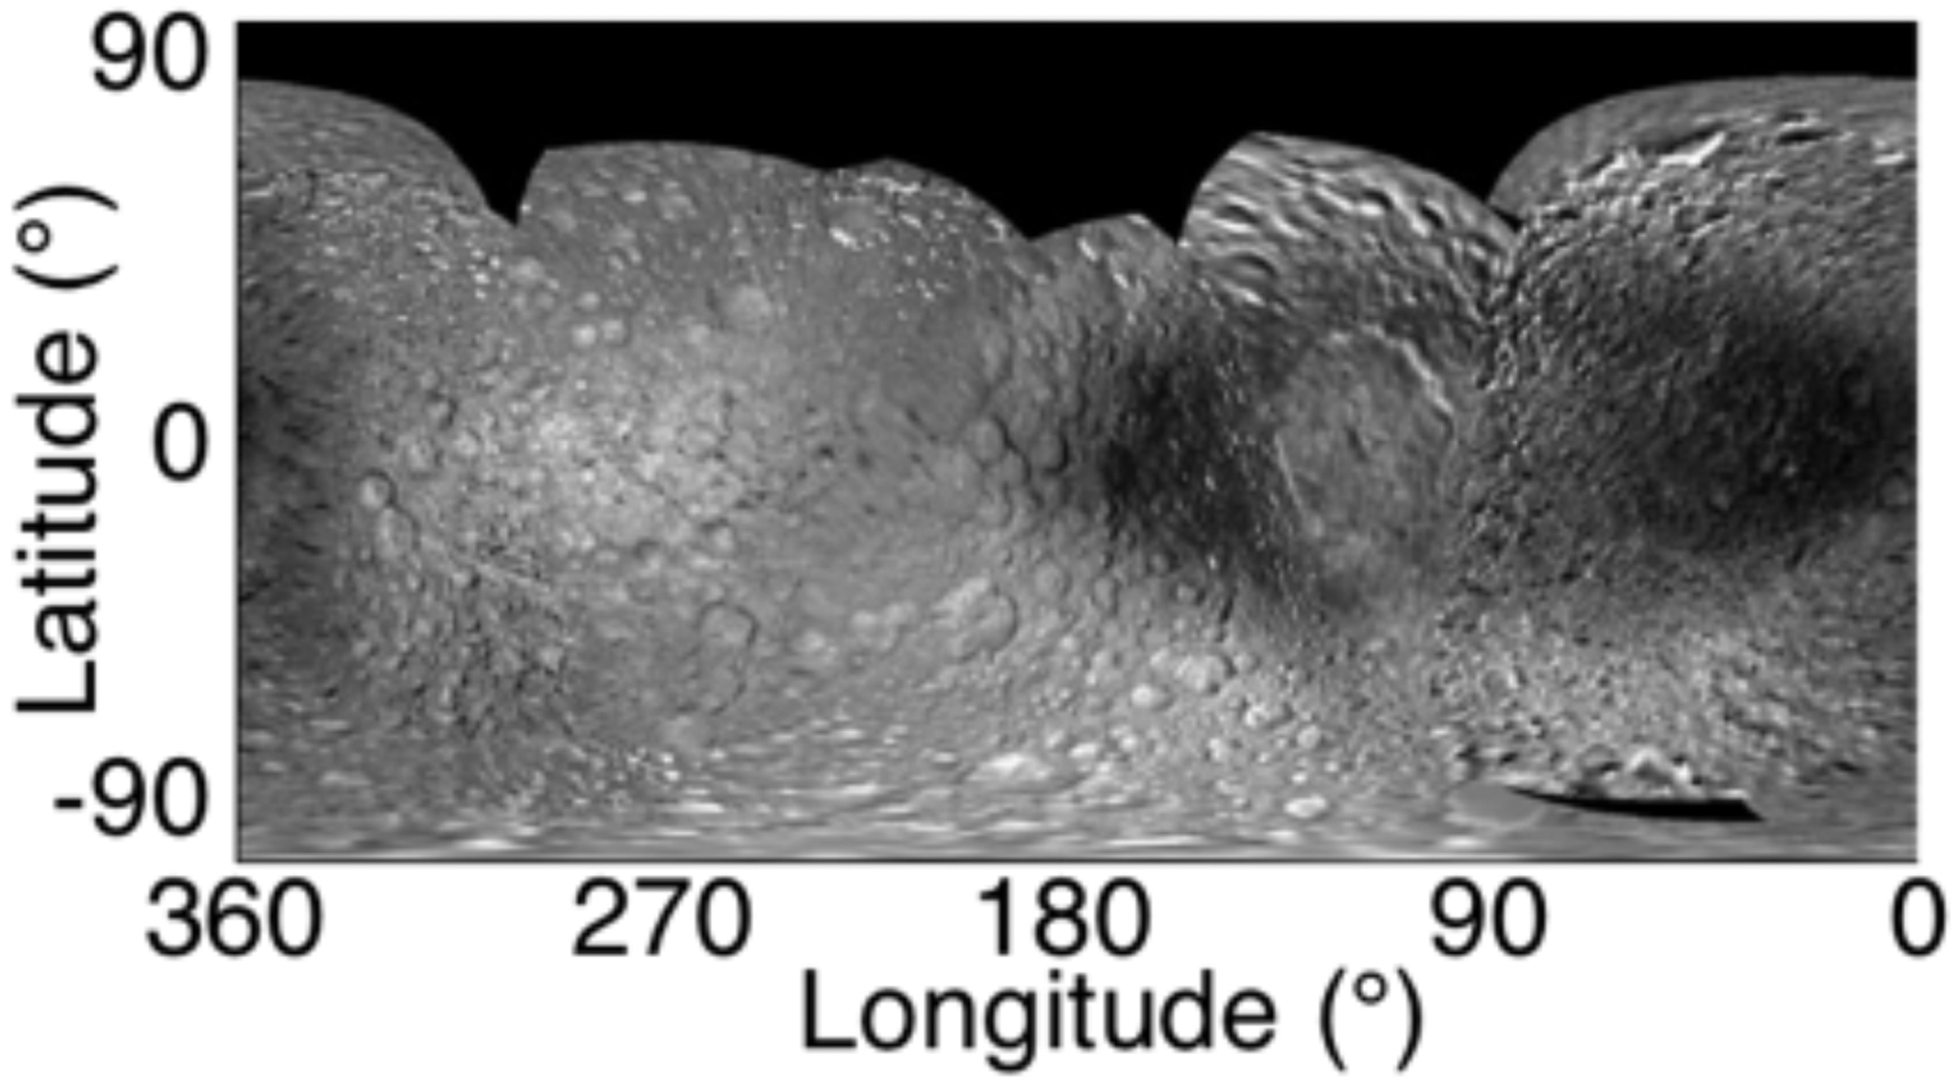
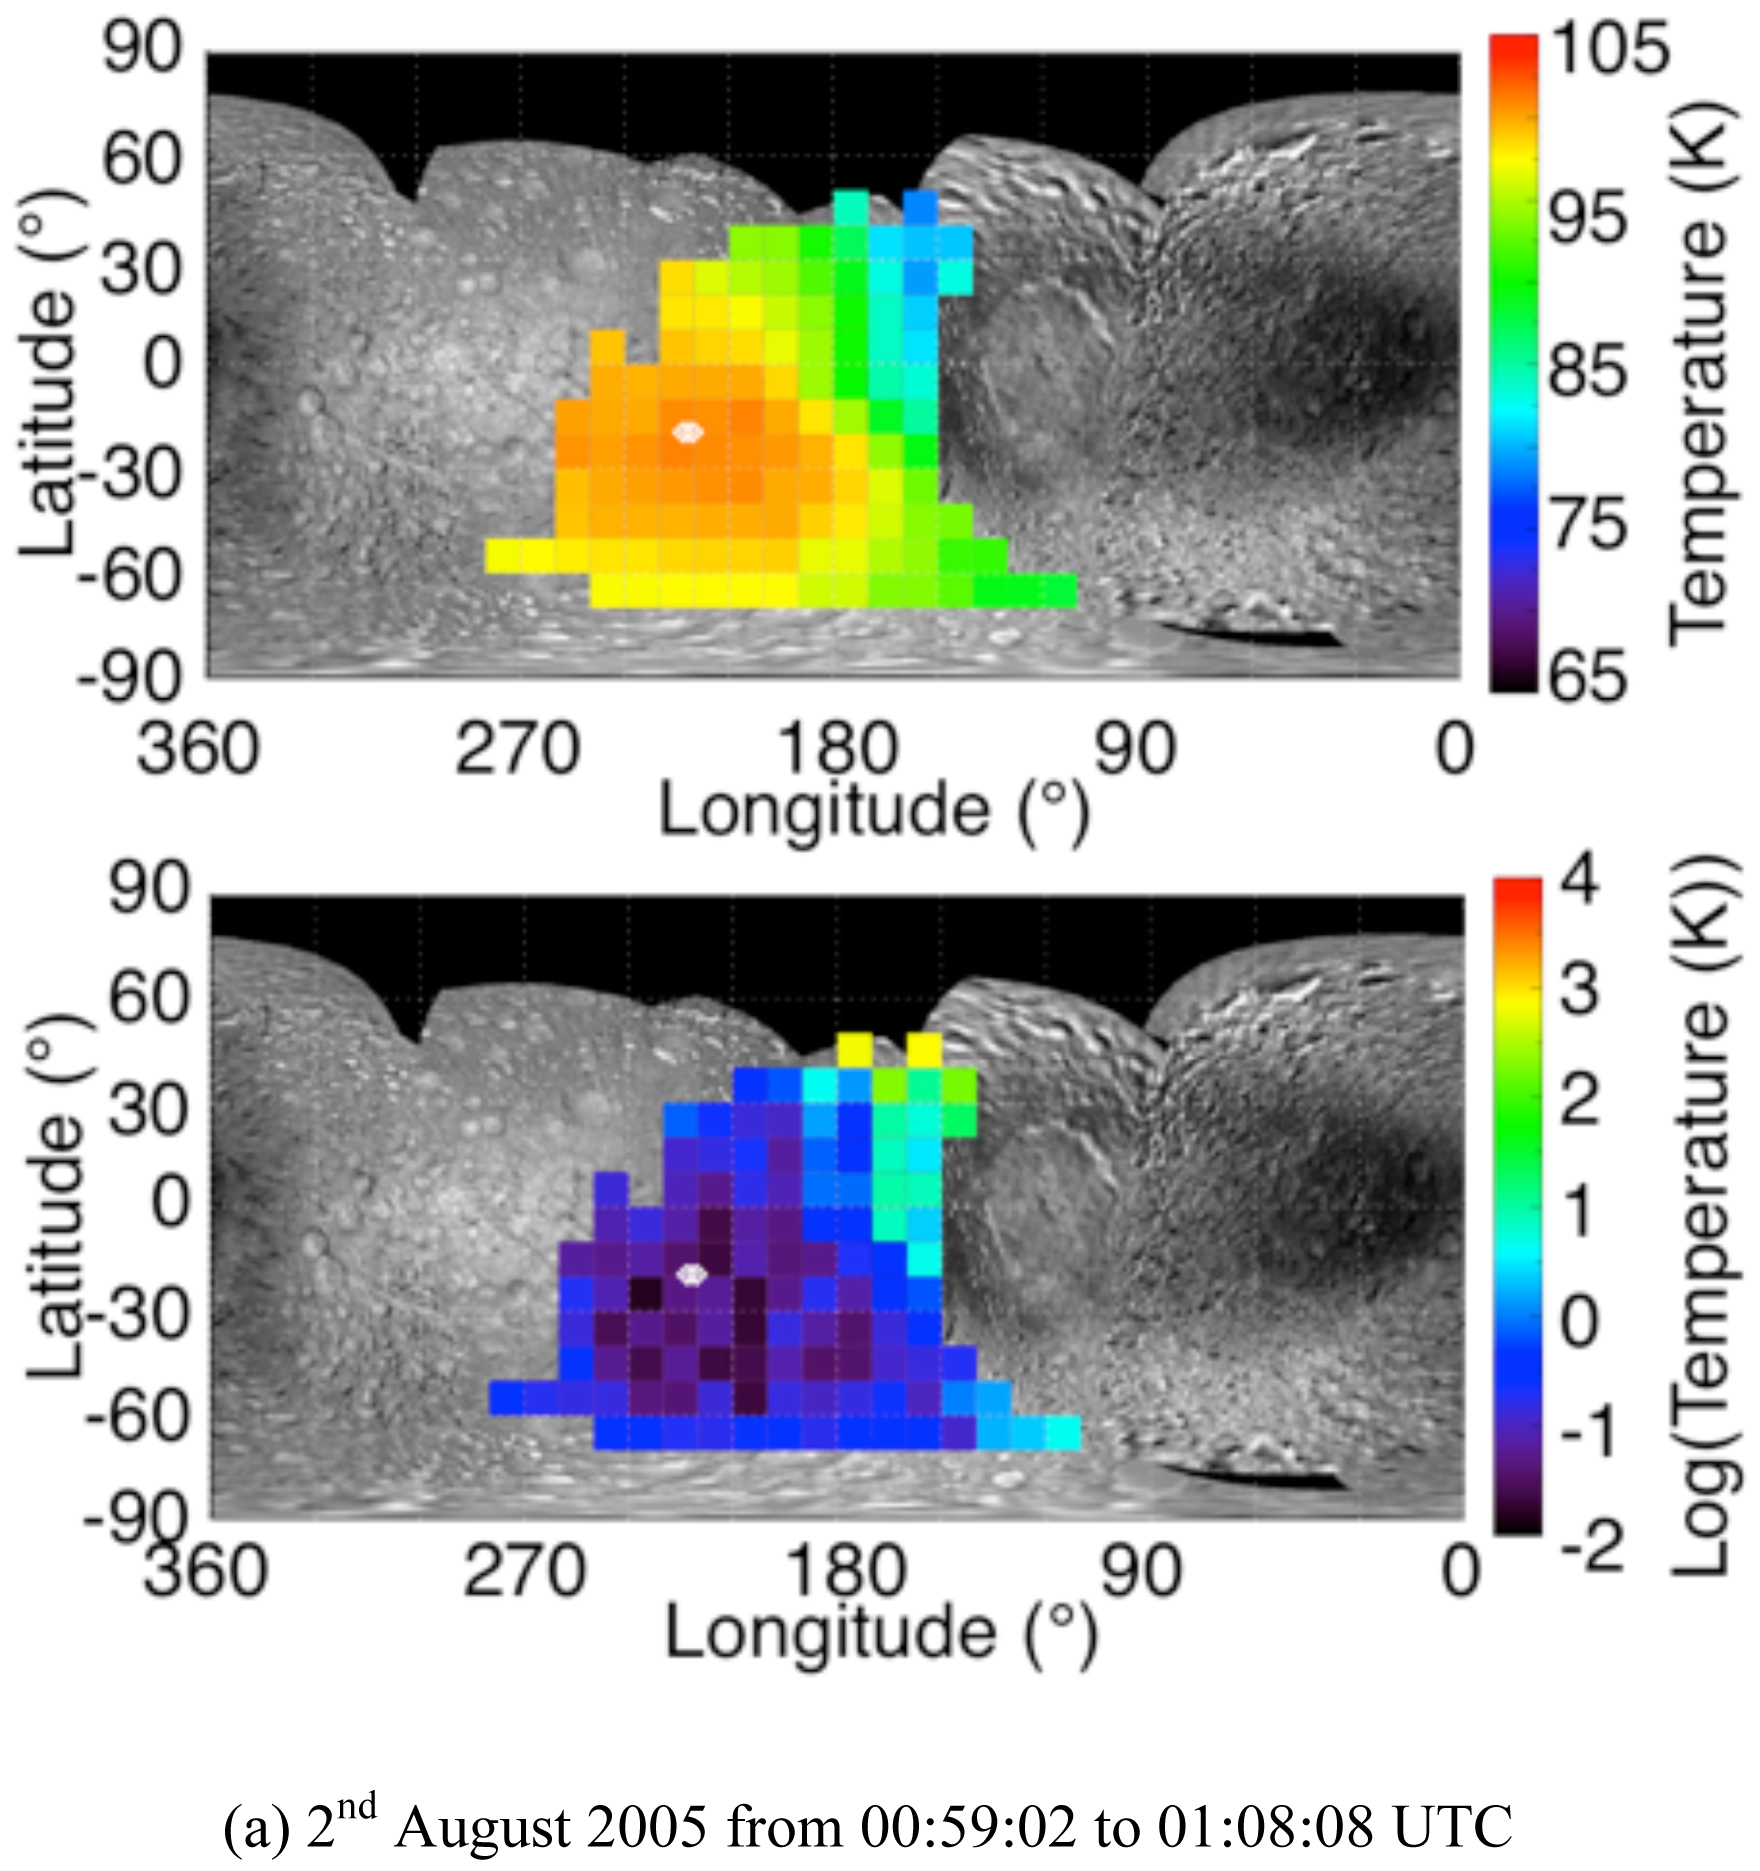
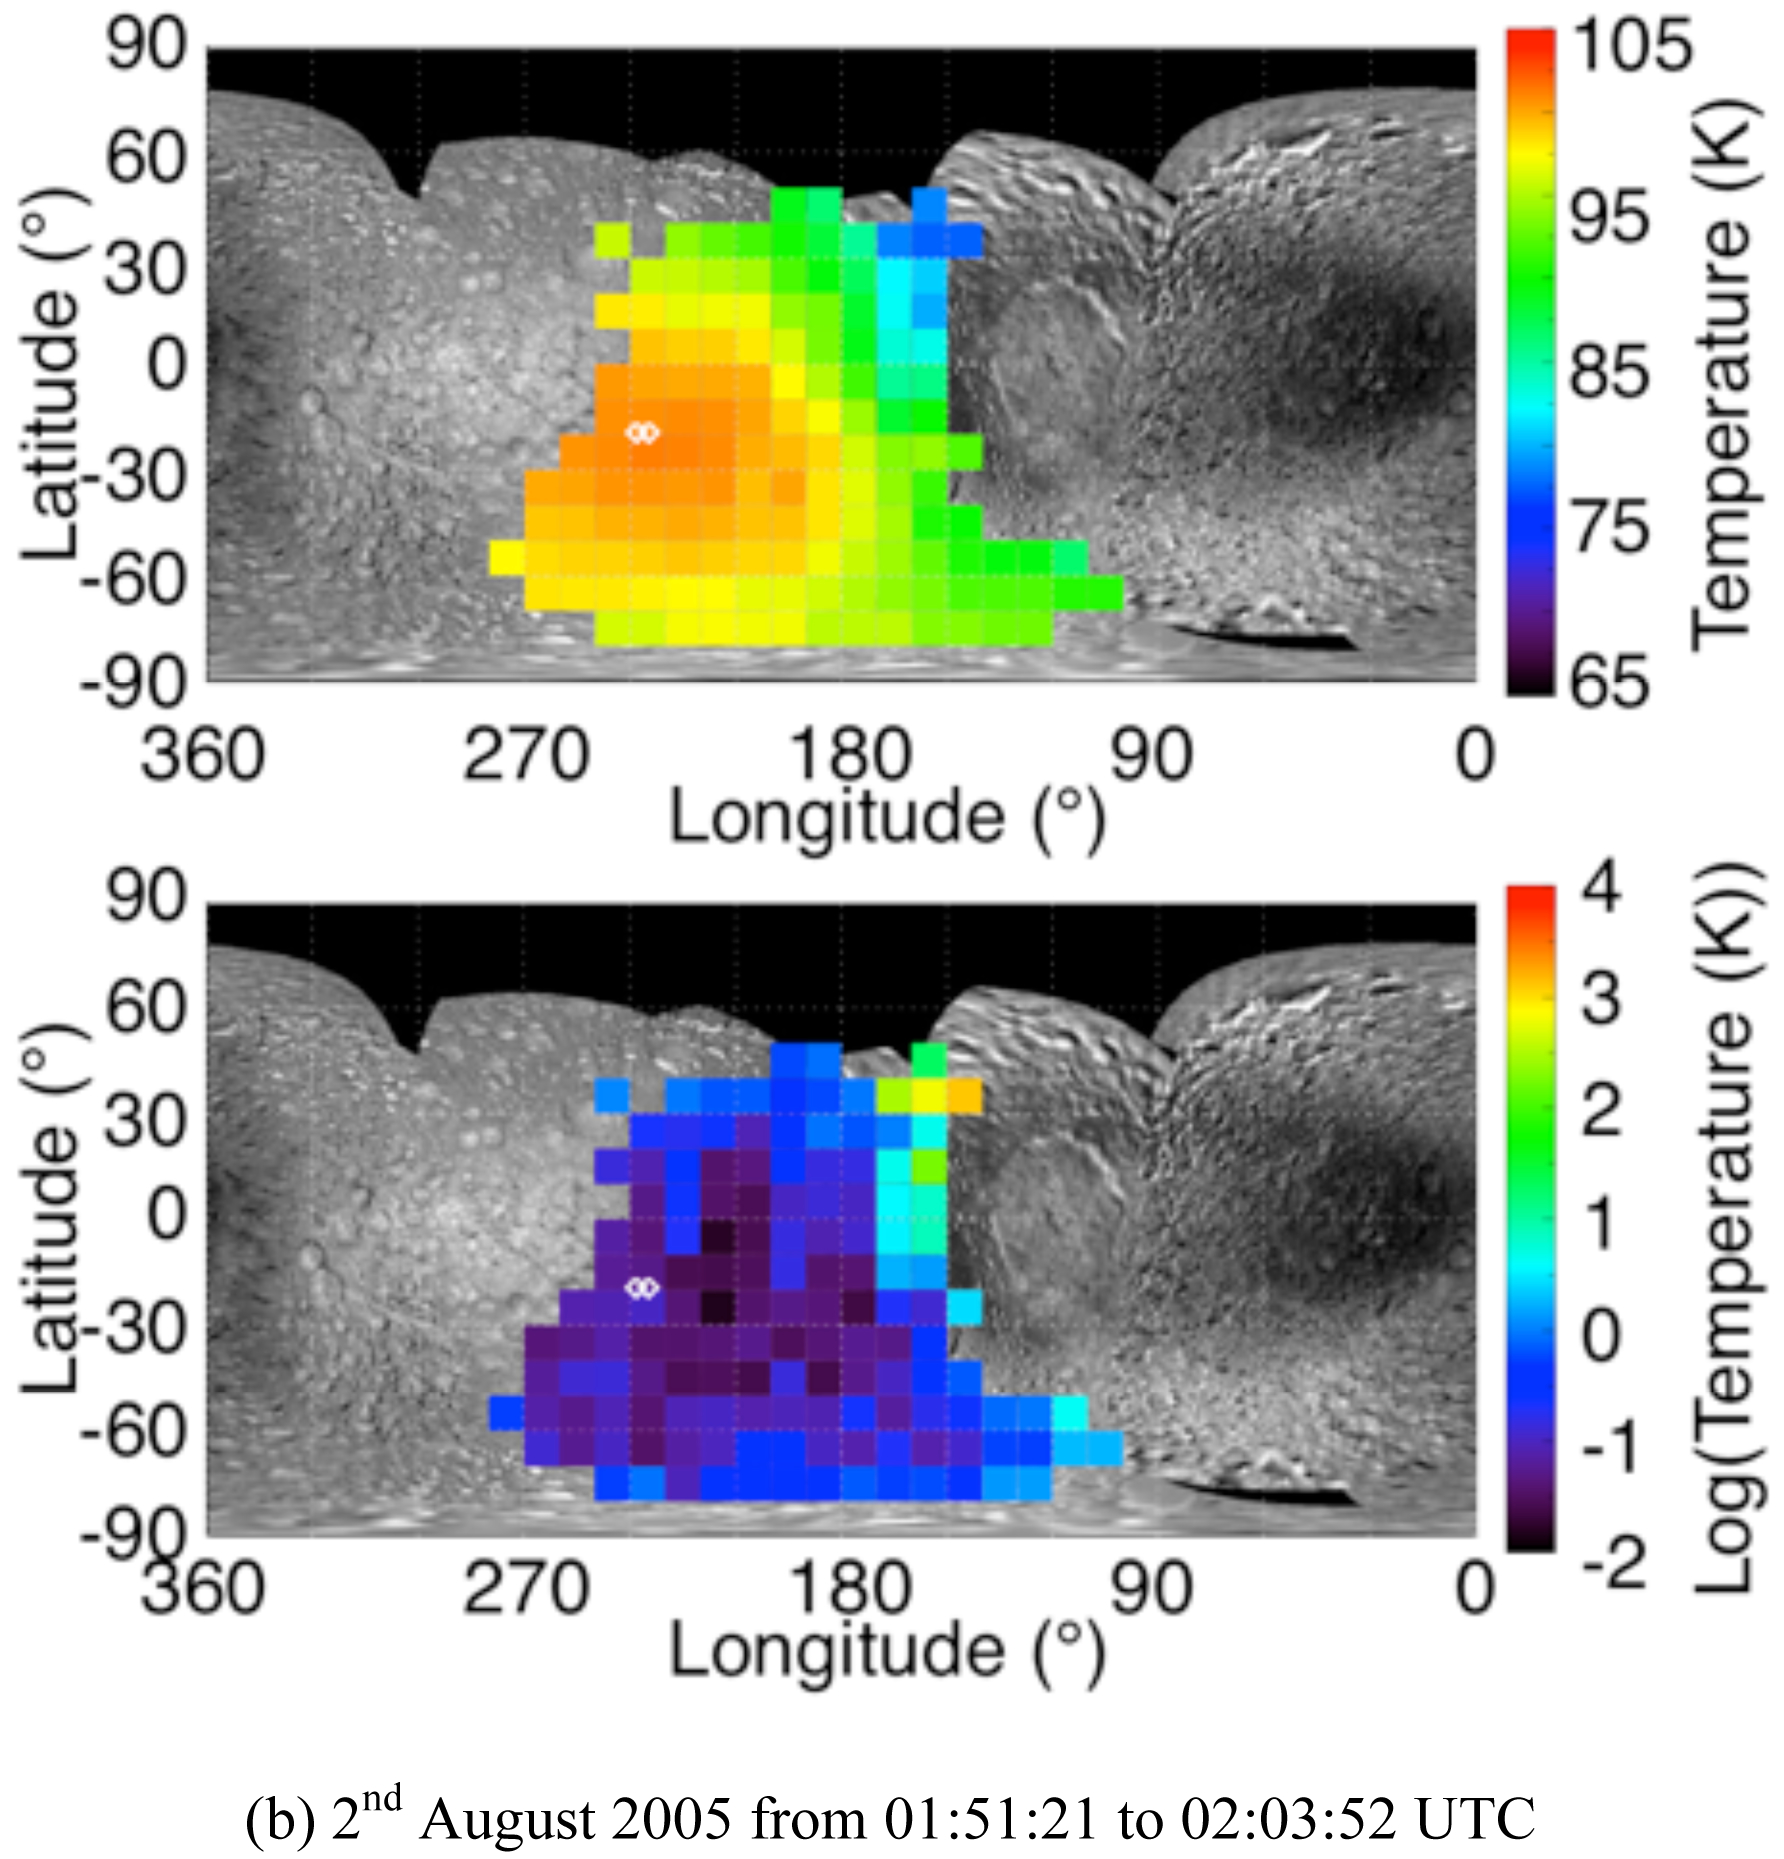
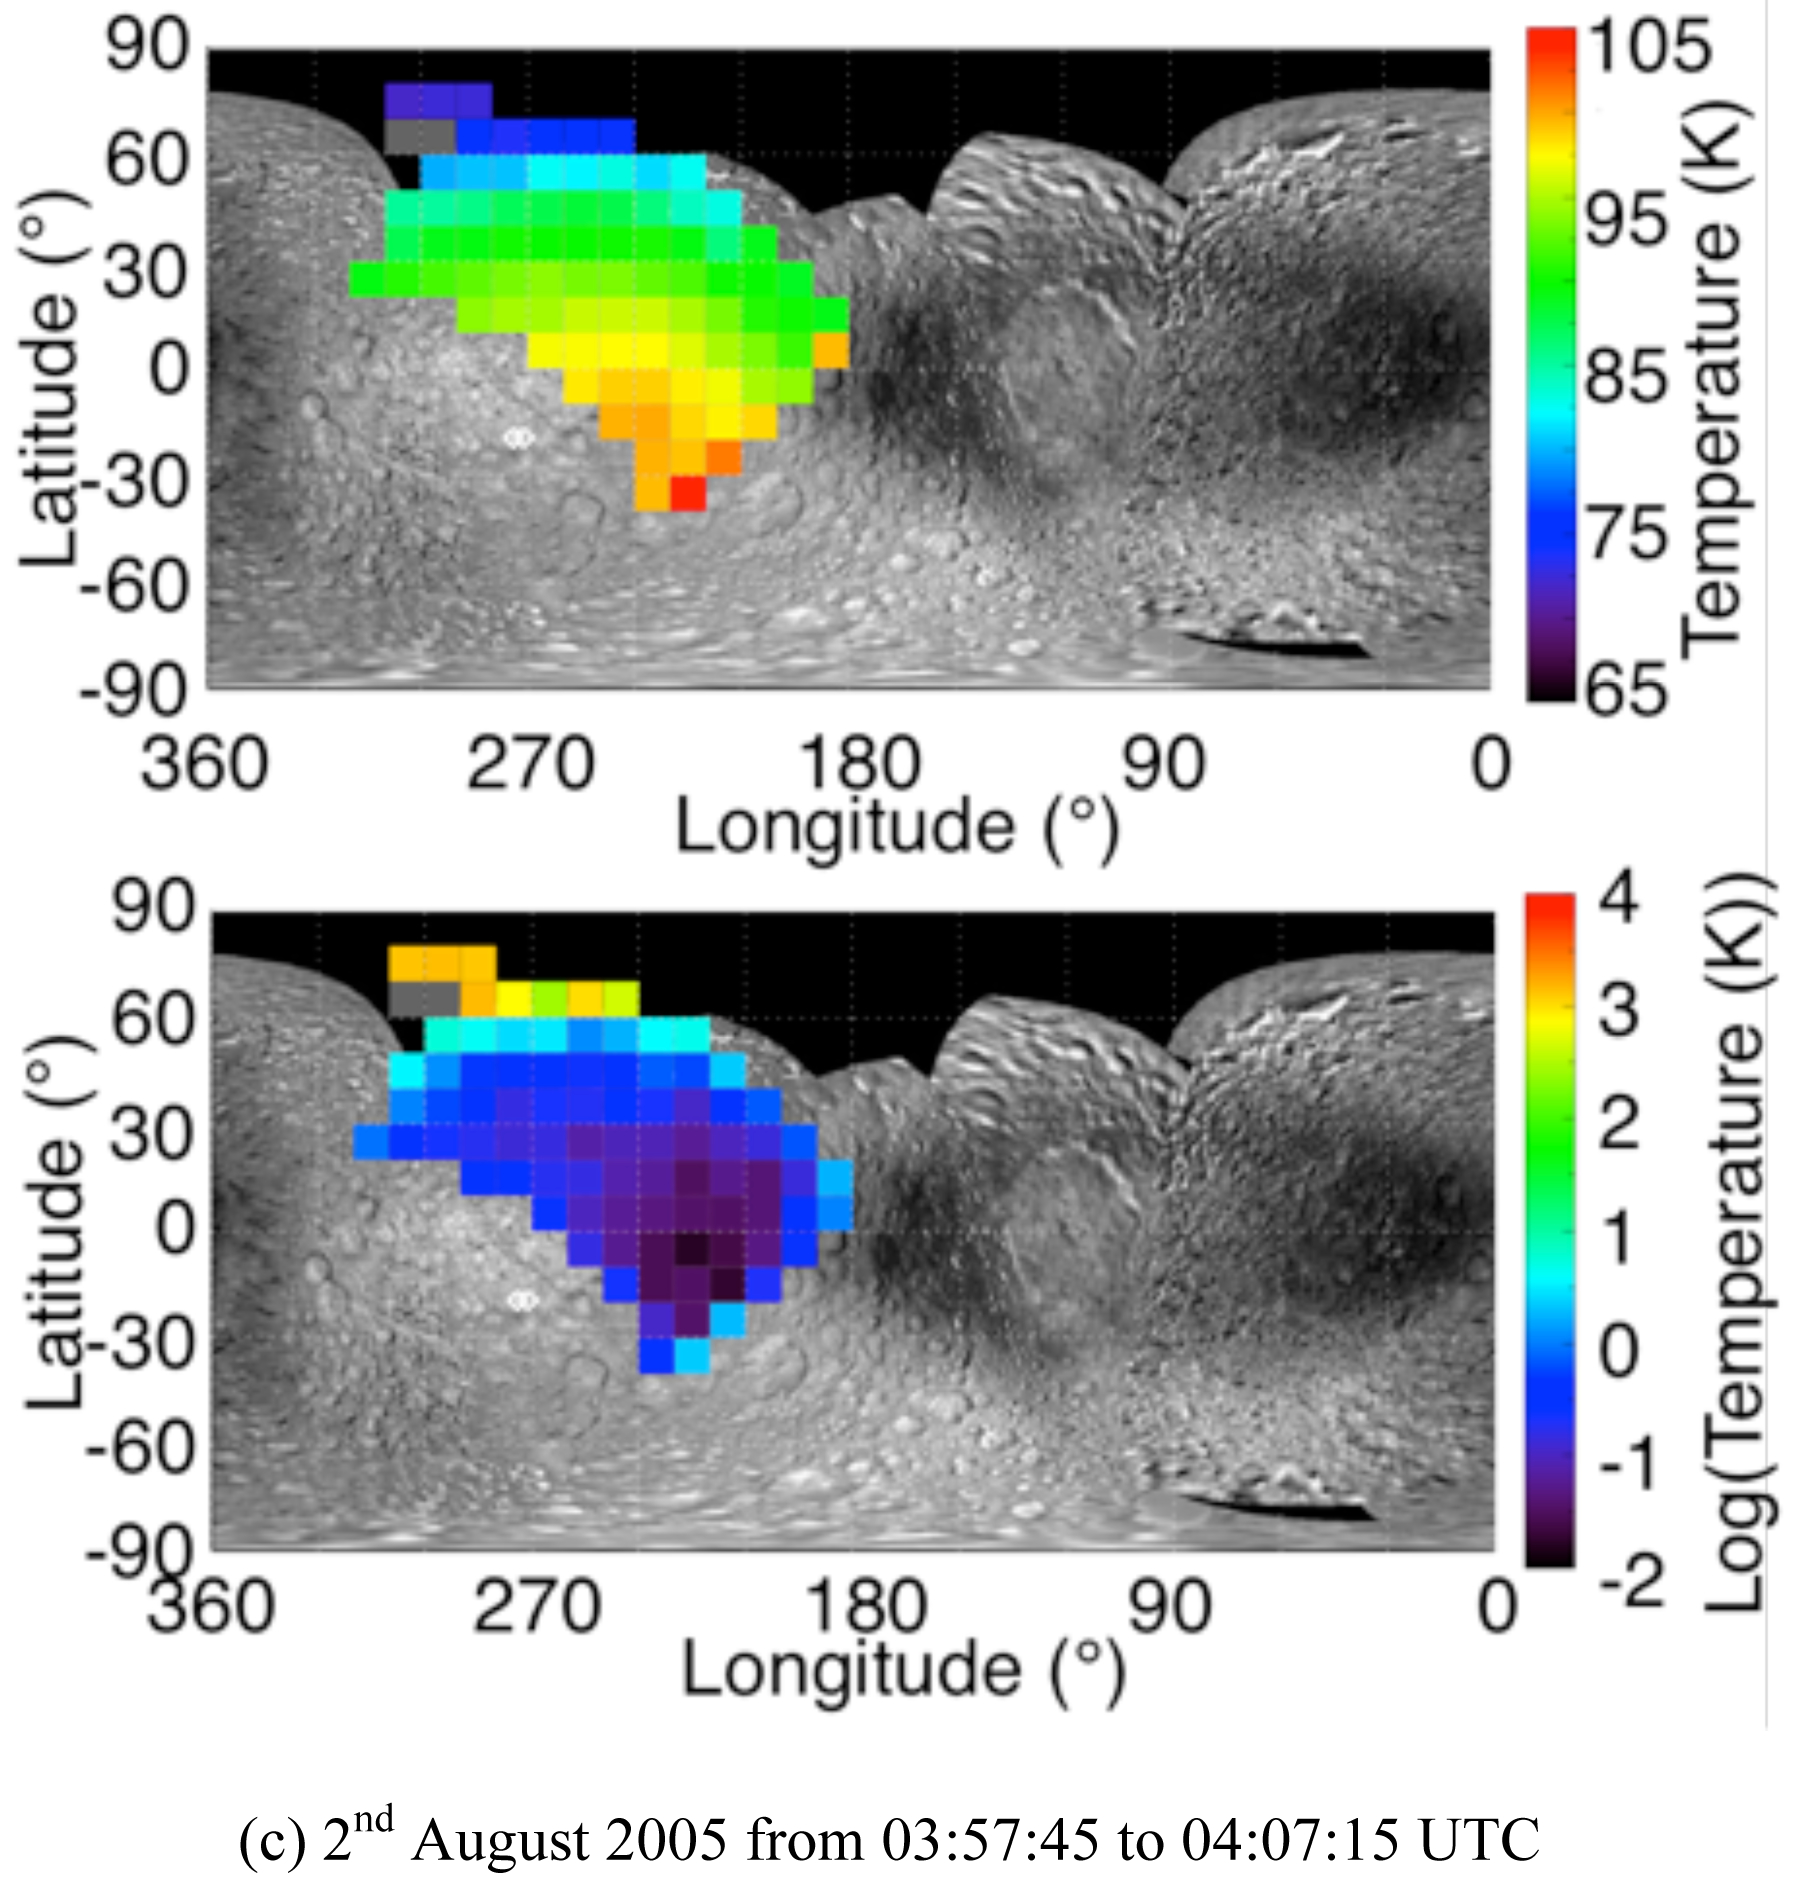
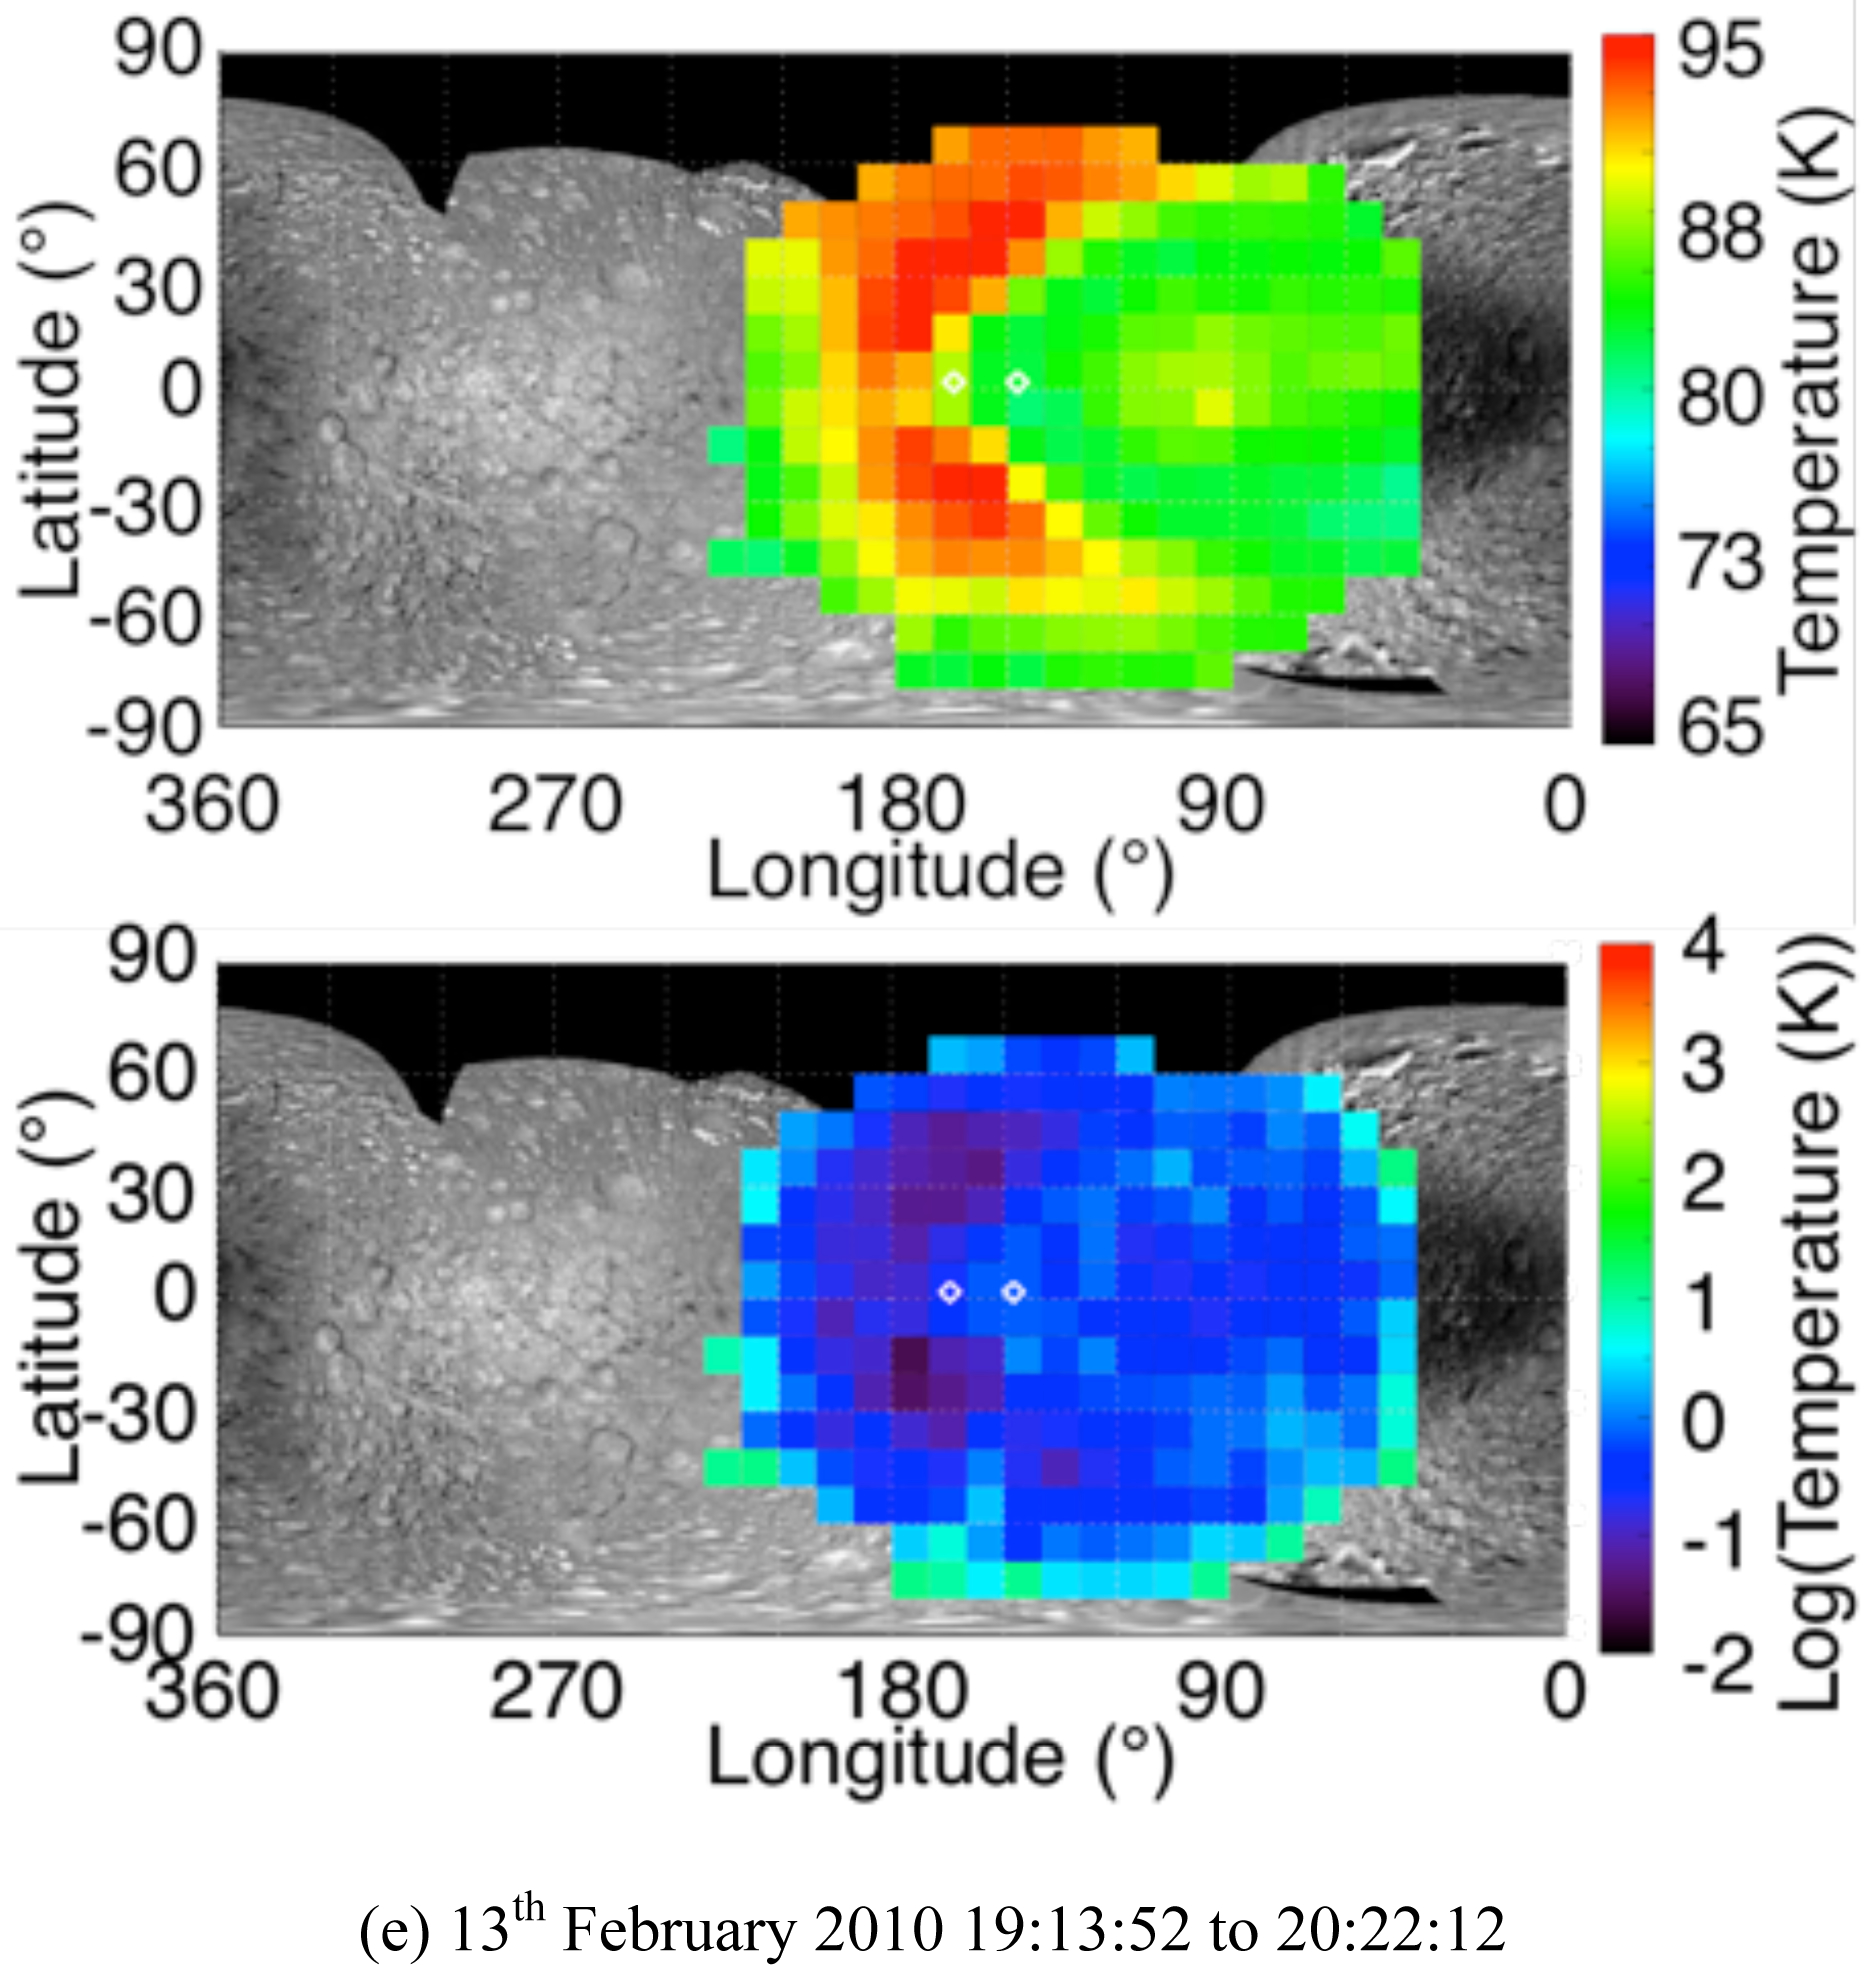
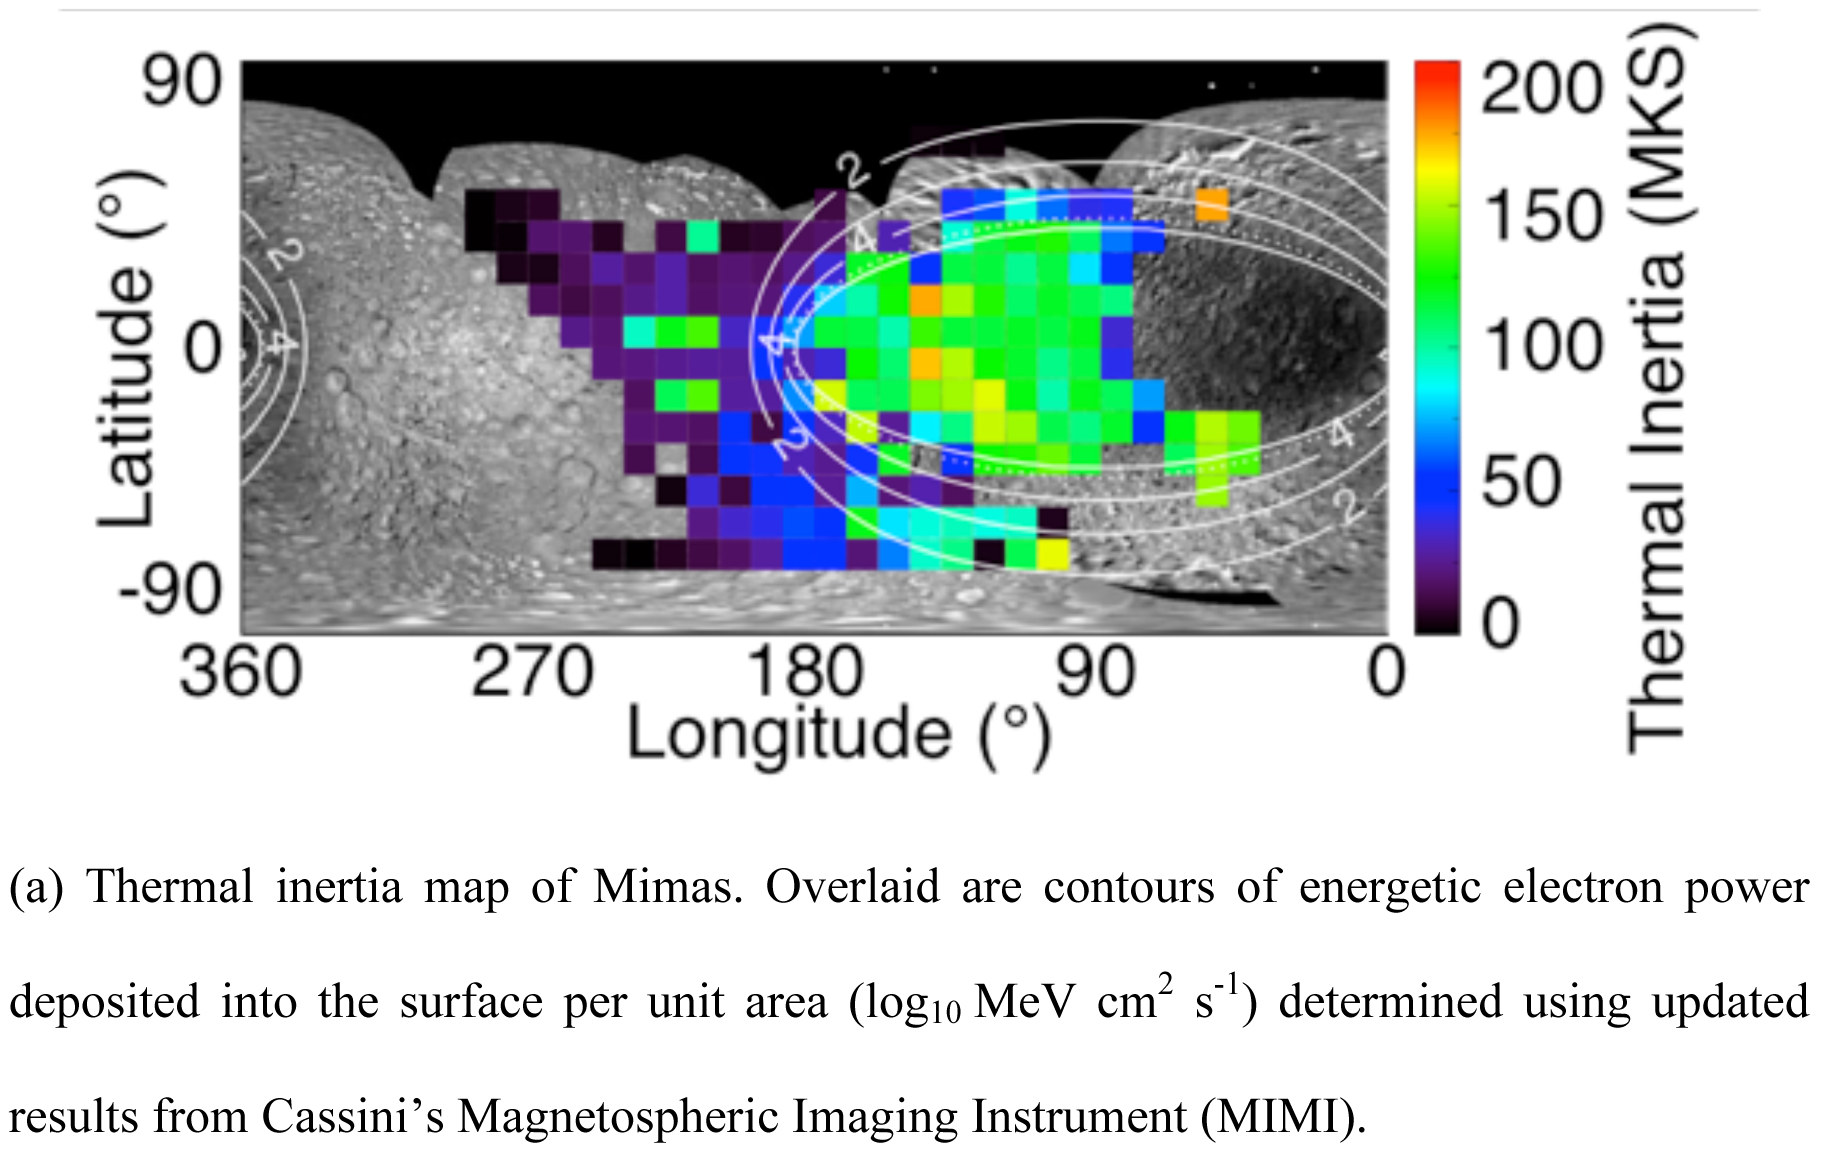
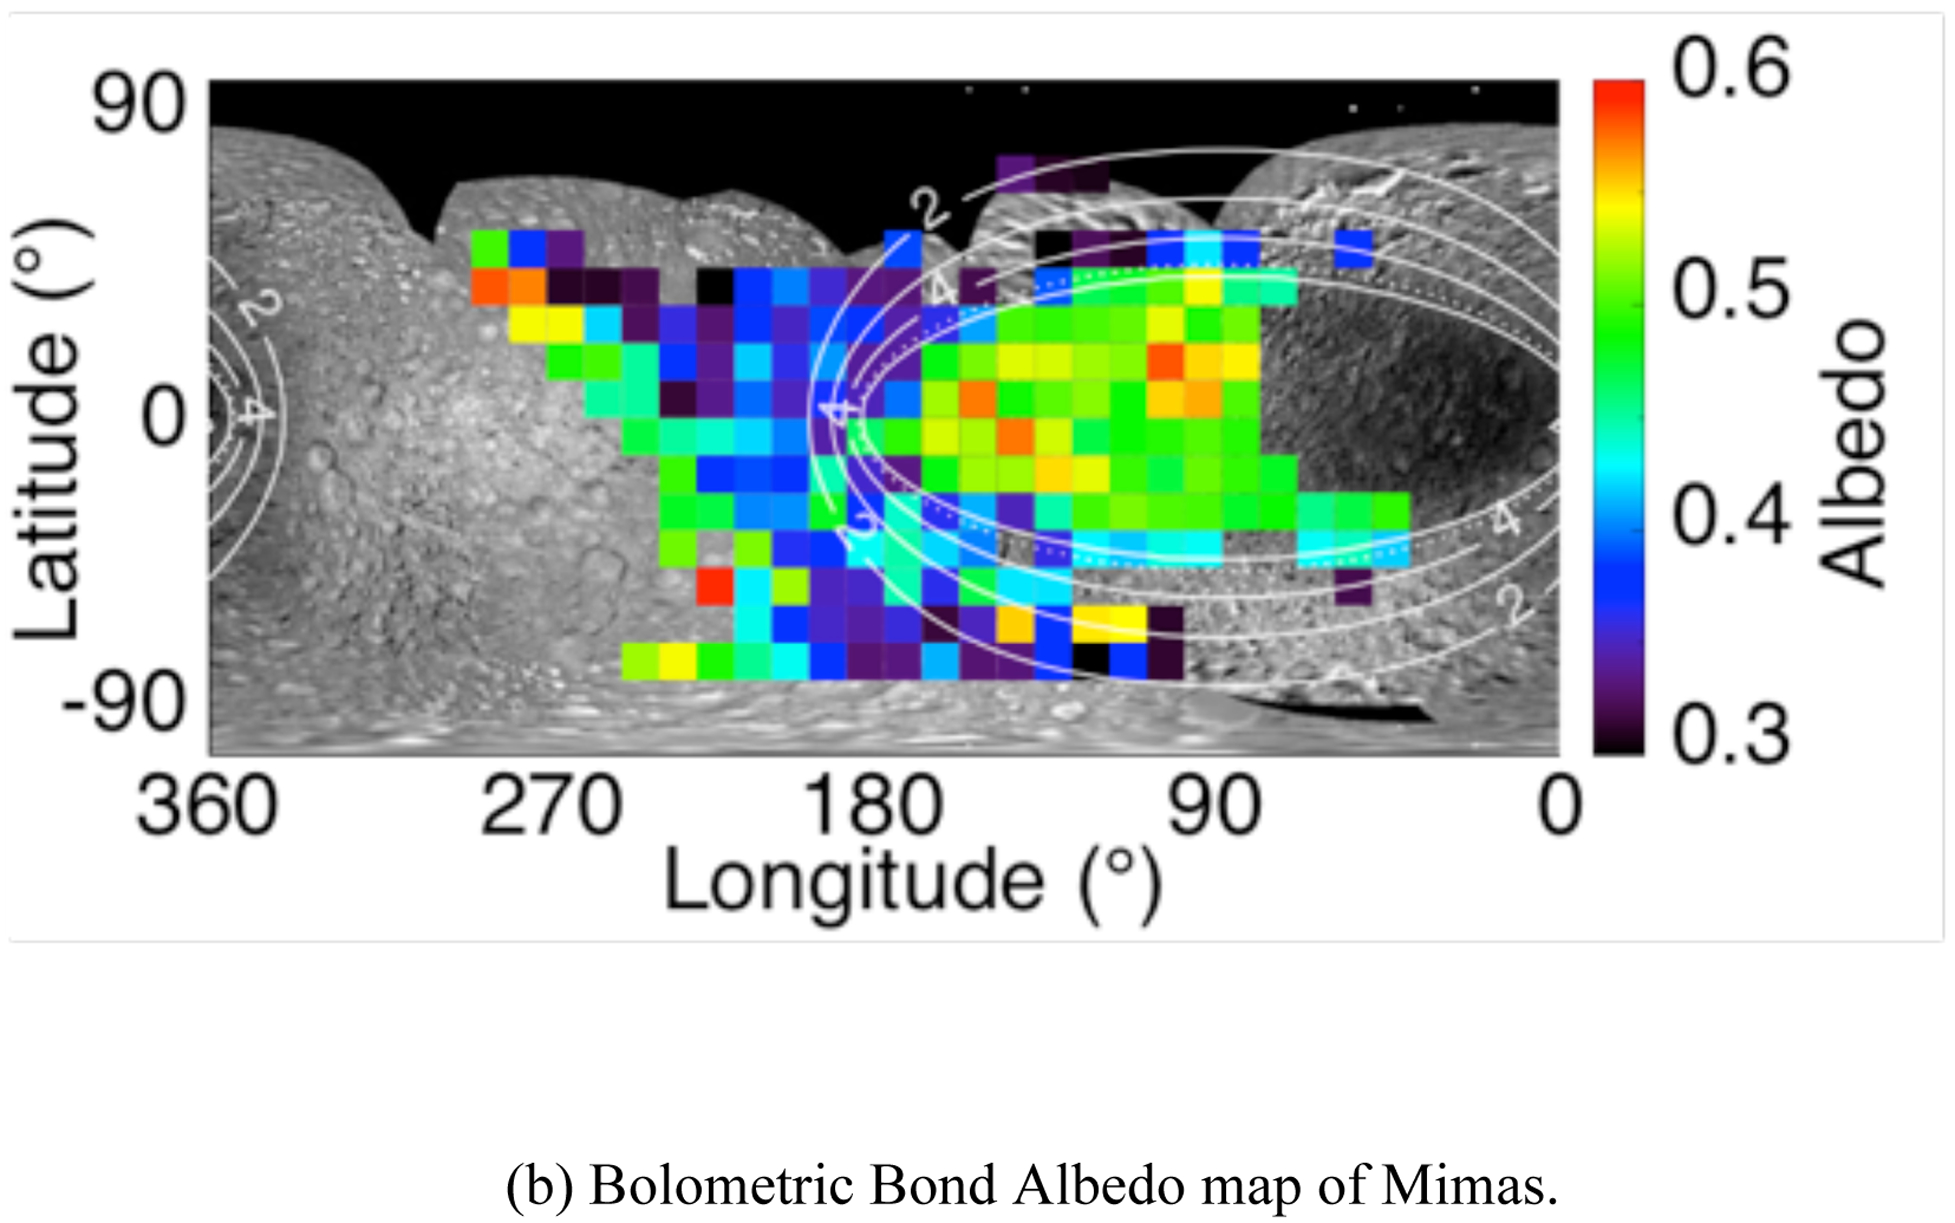
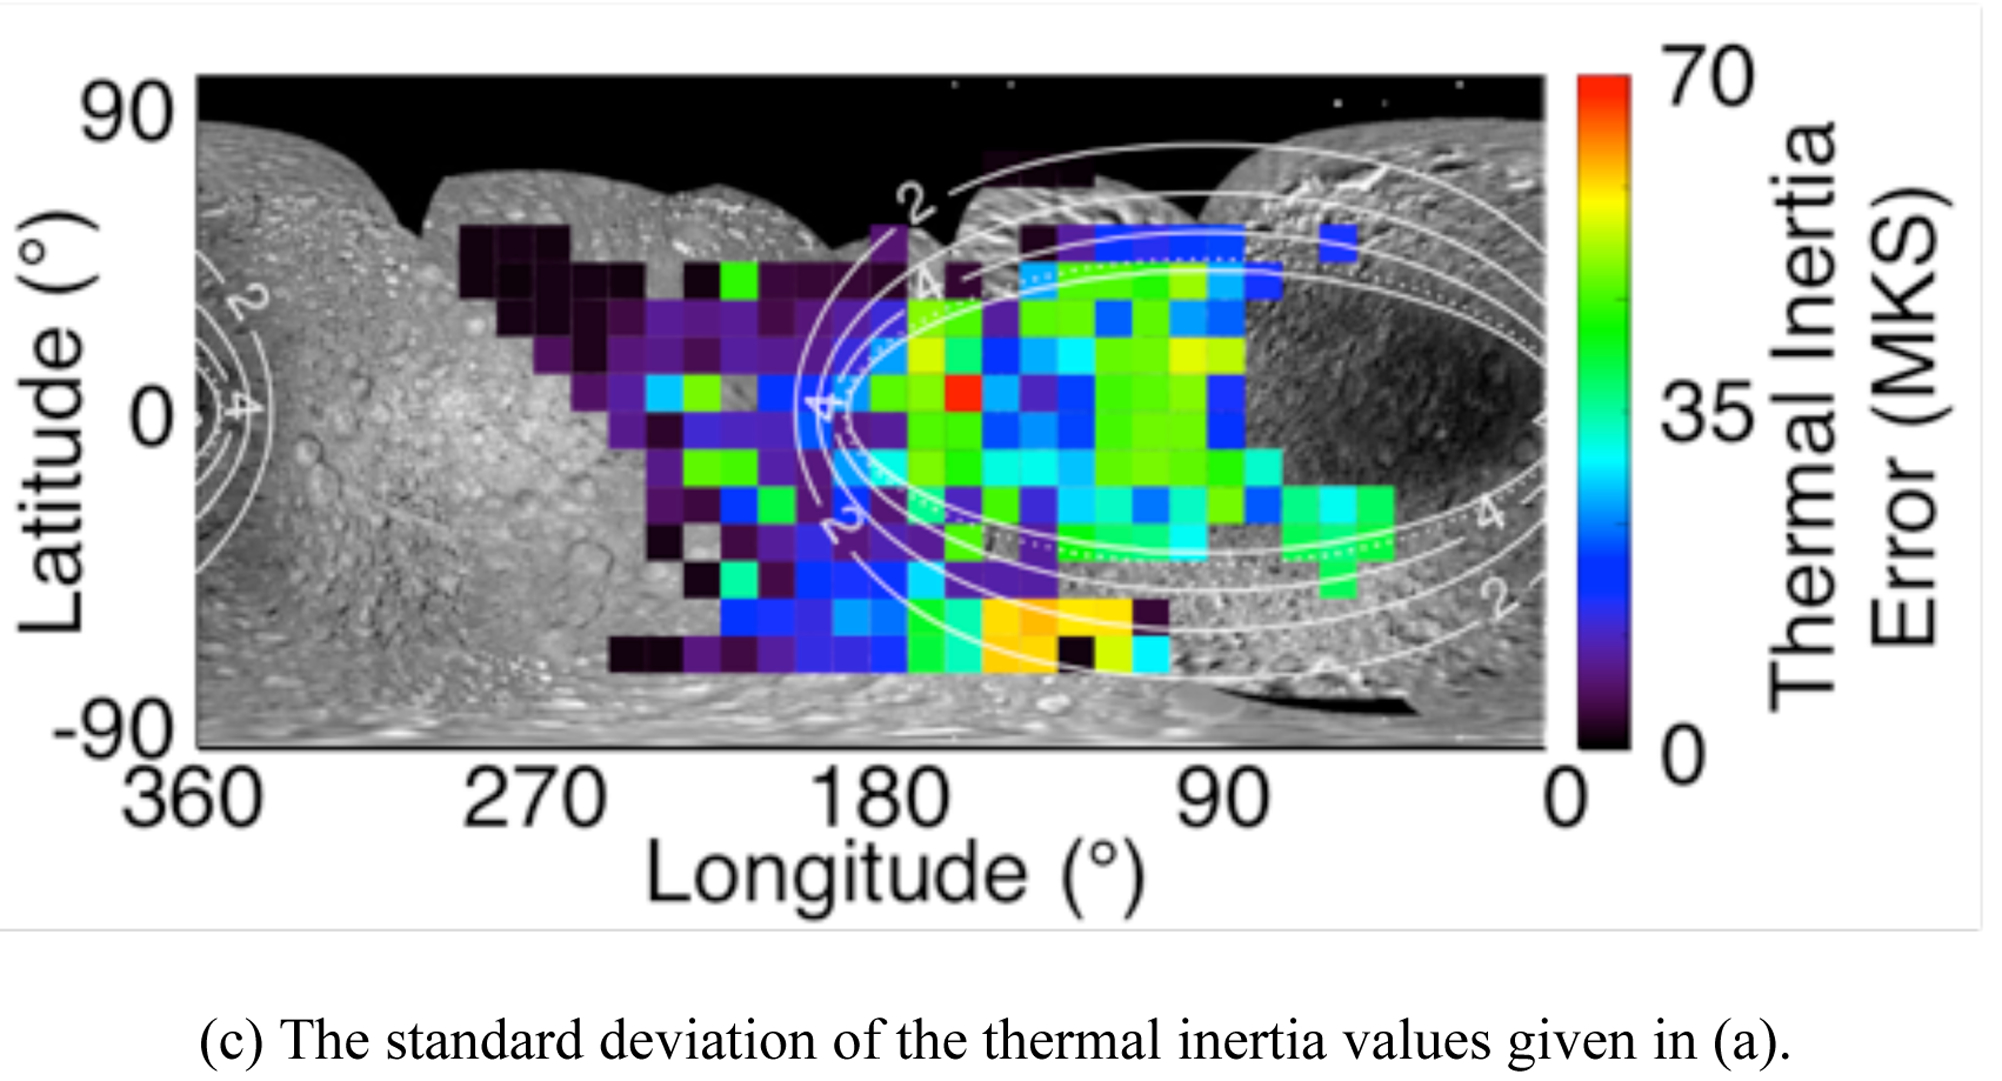
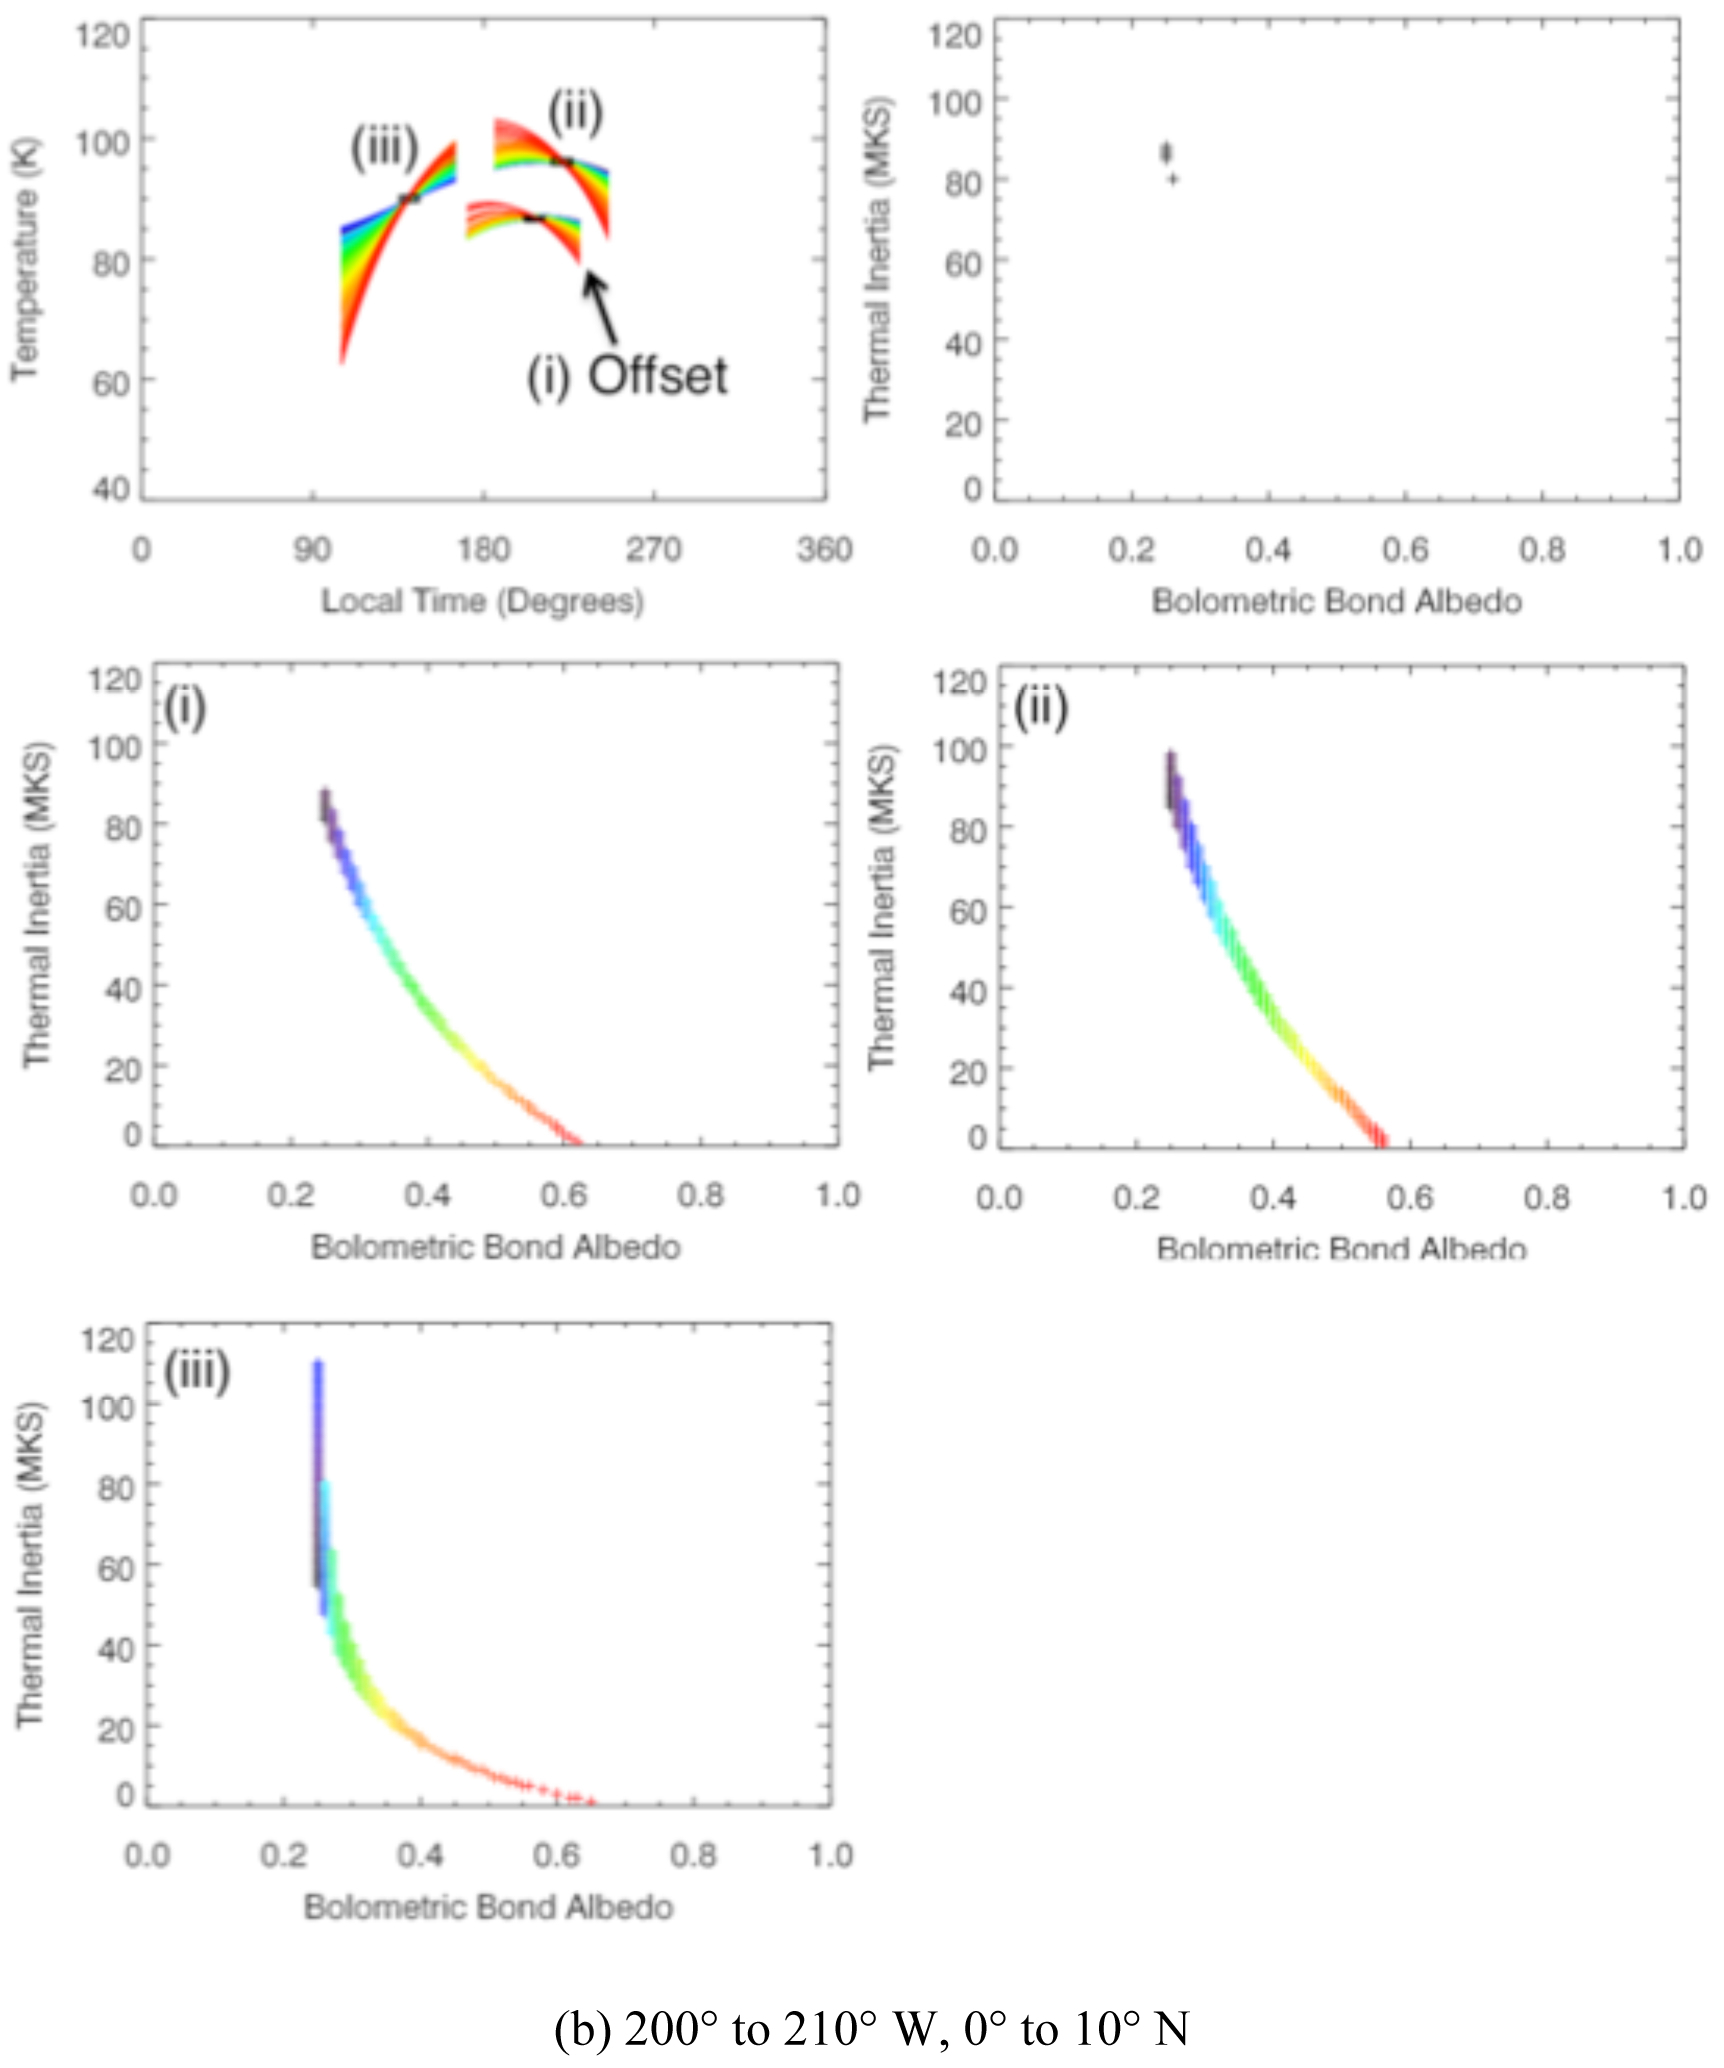
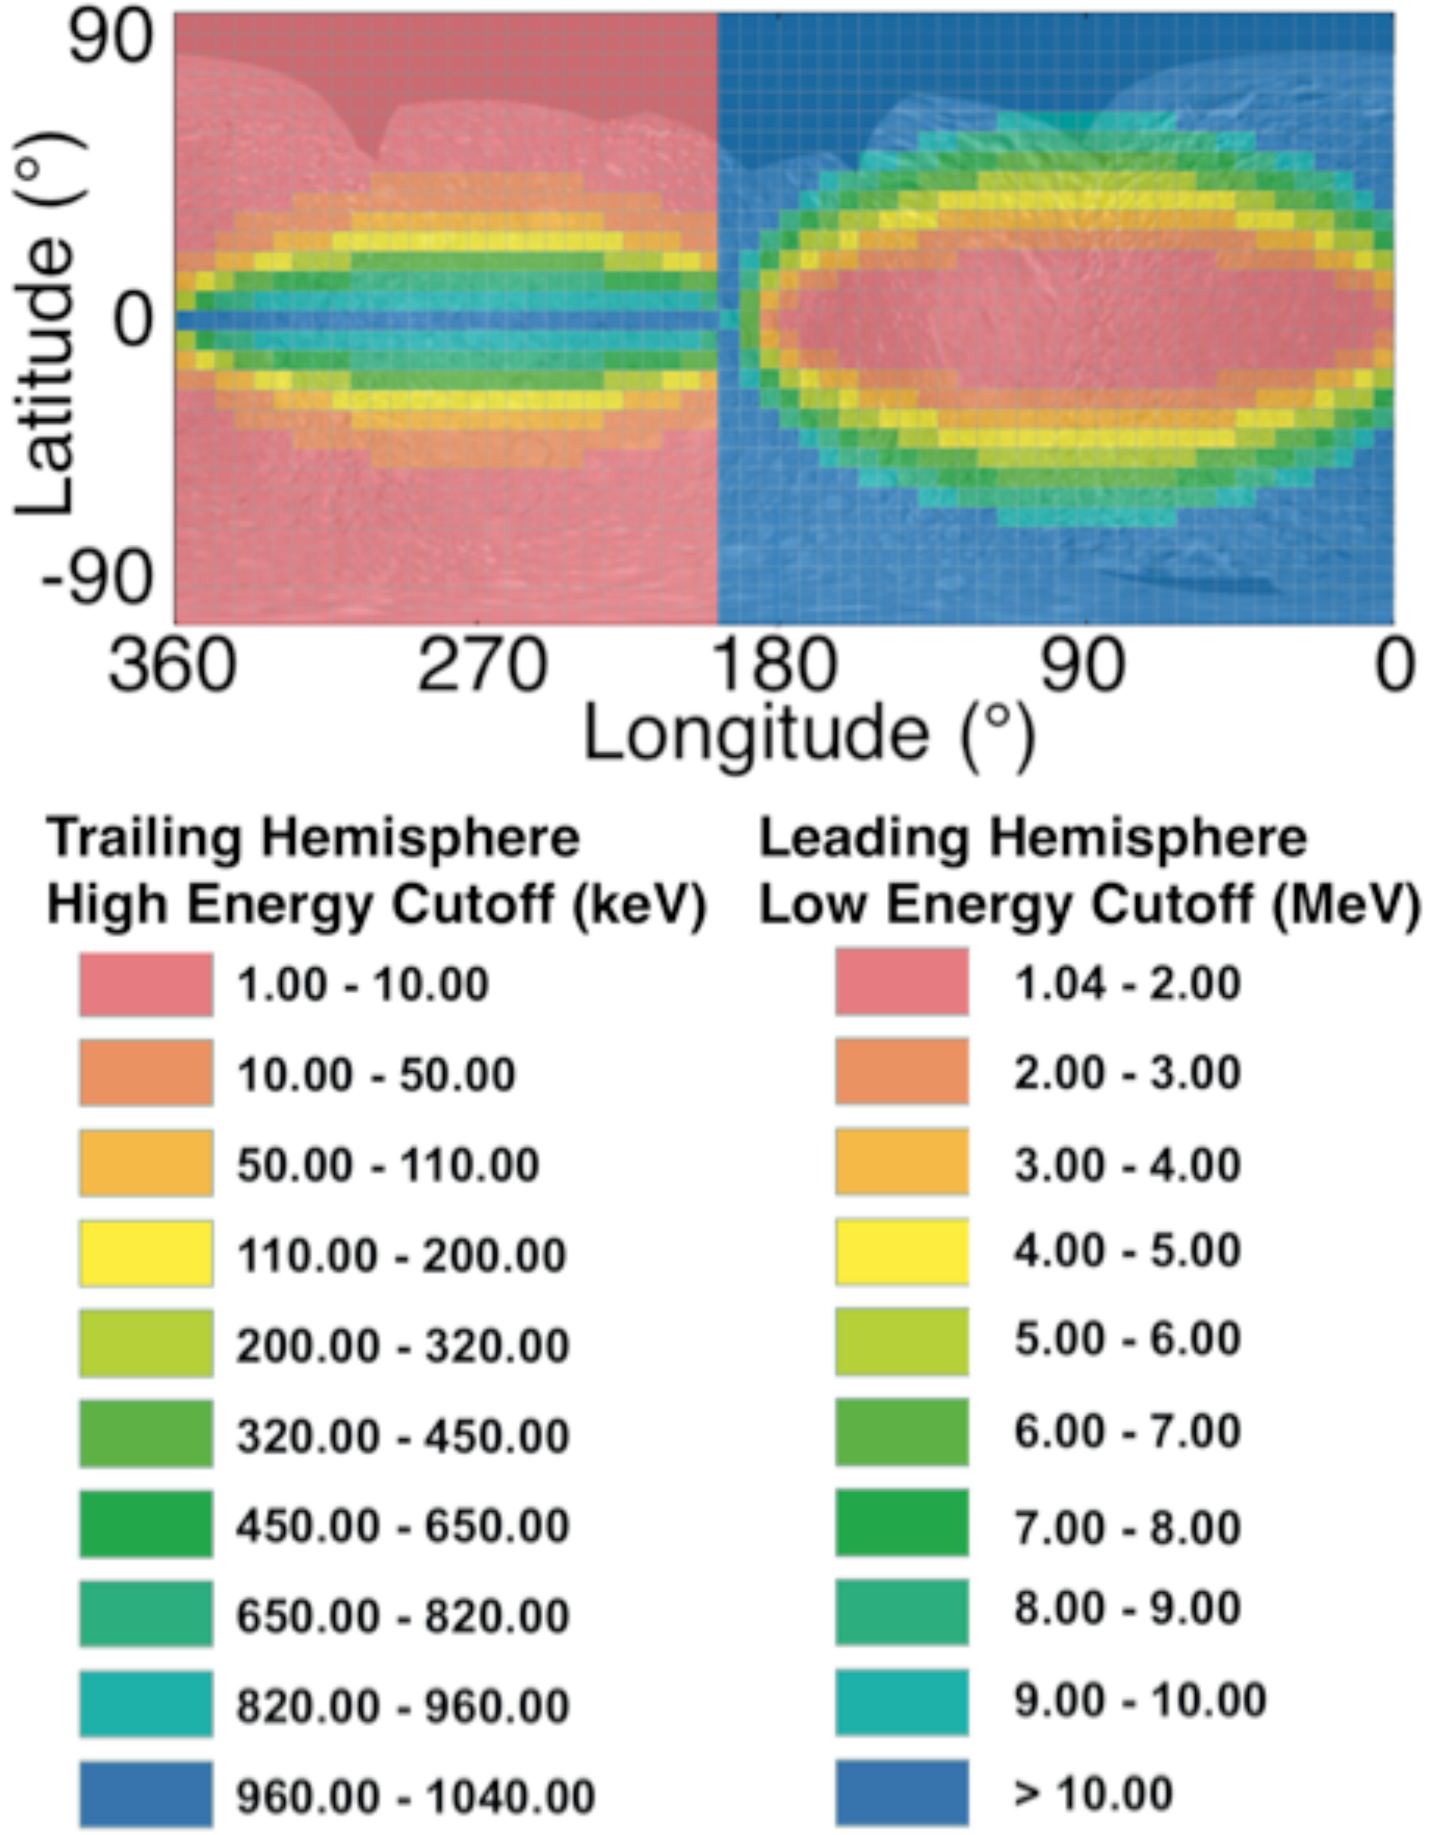
In 2011 a thermally anomalous region was discovered on Mimas, Saturn's innermost major icy satellite (Howett et al., 2011). The anomalous region is a lens-like shape located at low latitudes on Mimas' leading hemisphere. It manifests as a region with warmer nighttime temperatures, and cooler daytime ones than its surroundings. The thermally anomalous region is spatially correlated with a darkening in Mimas' IR/UV surface color (Schenk et al. 2011) and the region preferentially bombarded by high-energy electrons (Paranicas et al., 2012, 2014; Nordheim et al., 2017). We use data from Cassini's Composite Infrared Spectrometer (CIRS) to map Mimas' surface temperatures and its thermophysical properties. This provides a dramatic improvement on the work in Howett et al. (2011), where the values were determined at only two regions on Mimas (one inside, and another outside of the anomalous region). We use all spatially-resolved scans made by CIRS' focal plane 3 (FP3, 600 to 1100 cm-1) of Mimas' surface, which are largely daytime observations but do include one nighttime one. The resulting temperature maps confirm the presence and location of Mimas' previously discovered thermally anomalous region. No other thermally anomalous regions were discovered, although we note that the surface coverage is incomplete on Mimas' leading and anti-Saturn hemisphere. The thermal inertia map confirms that the anomalous region has a notably higher thermal inertia than its surroundings: 98±42 J m-2 K-1 s-1/2 inside of the anomaly, compared to 34±32 J m-2 K-1 s-1/2 outside. The albedo inside and outside of the anomalous region agrees within their uncertainty: 0.45±0.08 inside compared to 0.41±0.07 outside the anomaly. Interestingly the albedo appears brighter inside the anomaly region, which may not be surprising given this region does appear brighter at some UV wavelengths (0.338 μm, see Schenk et al., 2011). However, this result should be treated with caution because, as previously stated, statistically the albedo of these two regions is the same when their uncertainties are considered. These thermal inertia and albedo values determined here are consistent with those found by Howett et al. (2011), who determined the thermal inertia inside the anomaly to be 66±23 J m-2 K-1 s-1/2 and <16 J m-2 K-1 s-1/2 outside, with albedos that varied from 0.49 to 0.70.


Figures

Figure 1 –
Figure 1 –
The “PacMan” anomaly as discovered by Howett et al. (2011). The figure shows 600–650 cm−1 CIRS FP3 day and night images of the anti-Saturn side of Mimas, taken in February 2010 (orbit 126) , October 2010 (orbit 139) and January 2011 (orbit 144). The anomalously-cold region appears on the right hand side of the disk in the orbit 126 daytime image (left panel) and on the left side of the disk in the orbit 144 dayside image (right panel), which is centered at more easterly longitudes and thus shows the eastern extent of the anomaly. The same region appears anomalously warm at night (middle panel), indicating a higher thermal inertia than the rest of the disk. Saturn is in the background in the orbit 139 image.
Figure 2 -
Figure 2 -
IR/UV (0.930/0.338 μm) color ratio map of Mimas’ surface determine from Cassini ISS data from Schenk et al. (2011).
Figure 3 –
Figure 3 –
Top: Surface temperatures of Mimas derived from Cassini CIRS measurements, taken at different epochs. Bottom: The error of the surface temperatures shown on a logarithmic scale.
Figure 3 –
Figure 3 –
Top: Surface temperatures of Mimas derived from Cassini CIRS measurements, taken at different epochs. Bottom: The error of the surface temperatures shown on a logarithmic scale.
Figure 3 –
Figure 3 –
Top: Surface temperatures of Mimas derived from Cassini CIRS measurements, taken at different epochs. Bottom: The error of the surface temperatures shown on a logarithmic scale.
Figure 3 –
Figure 3 –
Top: Surface temperatures of Mimas derived from Cassini CIRS measurements, taken at different epochs. Bottom: The error of the surface temperatures shown on a logarithmic scale.
Figure 3 –
Figure 3 –
Top: Surface temperatures of Mimas derived from Cassini CIRS measurements, taken at different epochs. Bottom: The error of the surface temperatures shown on a logarithmic scale.
Figure 3 –
Figure 3 –
Top: Surface temperatures of Mimas derived from Cassini CIRS measurements, taken at different epochs. Bottom: The error of the surface temperatures shown on a logarithmic scale.
Figure 3 –
Figure 3 –
Top: Surface temperatures of Mimas derived from Cassini CIRS measurements, taken at different epochs. Bottom: The error of the surface temperatures shown on a logarithmic scale.
Figure 4 –
Figure 4 –
Maps of derived thermophysical properties for Mimas. The base-map is the IR/UV color map from Schenk et al. (2011). Overlaid are contours of energetic electron power deposited into the surface per unit area (log10 MeV cm2 s−1) determined using updated results from Cassini’s Magnetospheric Imaging Instrument (MIMI). The best fitting contour to the Mimas color and thermal inertia anomaly boundary (cf. Howett et al., 2011) is given by the dotted line at 4.75 (log10 MeV cm2 s−1) or 5.6 × 10⁴ MeV cm2 s−1.
Figure 4 –
Figure 4 –
Maps of derived thermophysical properties for Mimas. The base-map is the IR/UV color map from Schenk et al. (2011). Overlaid are contours of energetic electron power deposited into the surface per unit area (log10 MeV cm2 s−1) determined using updated results from Cassini’s Magnetospheric Imaging Instrument (MIMI). The best fitting contour to the Mimas color and thermal inertia anomaly boundary (cf. Howett et al., 2011) is given by the dotted line at 4.75 (log10 MeV cm2 s−1) or 5.6 × 10⁴ MeV cm2 s−1.
Figure 5 –
Figure 5 –
Details of the model fits to the derived surface temperatures for two locations, one inside the anomalous region (a) and another just outside (b) it. Top Left: The black box shows the surface temperatures observed in a given bin location, accounting for the breadth of local times covered by the bin and the error on the derived temperature. The color chords show the models that are able to fit the observed temperatures, each one modeled for the geometry of the encounter. Note, in subfigure (b) one of the chords (as indicated by the label and arrow) has been offset to colder temperatures by 10 K for clarity. Top right: The range of thermal inertias and albedos that are able to fit all observations. Other subfigures (i to iii): the thermal inertias and albedos able to fit a single observation, where the color of the point corresponds to the color of the cord shown for that observation (as labeled) in the Top Left subfigure.
Figure 5 –
Figure 5 –
Details of the model fits to the derived surface temperatures for two locations, one inside the anomalous region (a) and another just outside (b) it. Top Left: The black box shows the surface temperatures observed in a given bin location, accounting for the breadth of local times covered by the bin and the error on the derived temperature. The color chords show the models that are able to fit the observed temperatures, each one modeled for the geometry of the encounter. Note, in subfigure (b) one of the chords (as indicated by the label and arrow) has been offset to colder temperatures by 10 K for clarity. Top right: The range of thermal inertias and albedos that are able to fit all observations. Other subfigures (i to iii): the thermal inertias and albedos able to fit a single observation, where the color of the point corresponds to the color of the cord shown for that observation (as labeled) in the Top Left subfigure.
Figure 6 –
Figure 6 –
The bins that are considered “inside” the anomalous region (red), where the boundary is assumed to be the 4.75 log10 MeV cm2 s−1 contour energetic electron power deposited (5.6 × 10⁴ MeV cm2 s−1). “Outside” is assumed to be everywhere that is not colored red.
Figure 7 –
Figure 7 –
The mean and standard deviation of thermal inertias and bolometric Bond albedos with latitude. The values are split between those found inside (red, diamonds) and outside (blue, stars) of the anomalous region (see Figure 6 for how inside and outside are defined). Note, the latitudes are shown at the bin center, and the values inside and outside are slightly offset from this for clarity (latitudes outside (inside) the anomaly are decreased (increased) by 0.5°).
Figure 7 –
Figure 7 –
The mean and standard deviation of thermal inertias and bolometric Bond albedos with latitude. The values are split between those found inside (red, diamonds) and outside (blue, stars) of the anomalous region (see Figure 6 for how inside and outside are defined). Note, the latitudes are shown at the bin center, and the values inside and outside are slightly offset from this for clarity (latitudes outside (inside) the anomaly are decreased (increased) by 0.5°).
Figure 8:
Figure 8:
The predicted cutoff energy versus surface location for Mimas, from Nordheim et al. (2017). On the trailing hemisphere the highest energy able to access each location is plotted, whereas on the leading hemisphere the lowest energy is given. The leading hemisphere dose map is overlaid on the trailing hemisphere one. The basemap is from Schenk et al. (2011).
Figure 9:
Figure 9:
The predicted energy deposition at 1 cm on Mimas (~ the depth probed by CIRS), from Nordheim et al. (2017). The energetic electron dose is given in terms of years to reach a significant dose of 100 eV/ 16 amu, which is equal to a dose of 60.3 Grad. The basemap is from Schenk et al. (2011).

References

    1. Buratti BJ, Mosher JA, Nicholson PD, McGee CA, and French RG (1998). Near-infrared photometry of the saturnian satellites during ring plane crossing. Icarus 136, 223–231.
    1. Carvano JM, Migliorini A, Barucci A, Segura M and the CIRS Team (2007). Constraining the surface properties of Saturn’s icy moons, using Cassini/CIRS emissivity spectra, Icarus 187, 574–583.
    1. Flasar FM, Kunde VG, Abbas MM, Achterberg RK, Ade P, Barucci A, Bézard B, Bjoraker GL, Brasunas JC, Calcutt SB, Carlson R, Césarsky CJ, Conrath BJ, Coradini A, Courtin R, Coustenis A, Edberg S, Edgington S, Ferrari C, Fouchet T, Gautier D, Gierasch PJ, Grossman K, Irwin P, Jennings DE, Lellouch E, Mamoutkine AA, Marten A, Meyer JP, Nixon CA, Orton GS, Owen TC, Pearl JC, Prangé R, Raulin F, Read PL, Romani PN, Samuelson RE, Segura ME, Showalter MR, Simon-Miller AA, Smith MD, Spencer JR, Spilker LJ and Taylor FW (2004). Exploring the Saturn System in the Thermal Infrared: The Composite Infrared Spectrometer, Space Science Review 115, 169–297, doi: 10.1007/s11214-004-1454-9. - DOI
    1. Hamilton DP and Burns JA (1994). Origin of Saturn’s E ring: self-sustained, naturally Science 264, 550–553. doi: 10.1126/science.264.5158.550. - DOI - PubMed
    1. Hendrix AR, Cassidy TA, Buratti BJ, Paranicas C, Hansen CJ, Teolis B, Roussos E, Bradley ET, Kollmann P, Johnson RE (2012). Mimas’ far-UV albedo: Spatial variations, Icarus 220, 922–931.

LinkOut - more resources