. 2020;125(3):2695-2726.
doi: 10.1007/s11192-020-03706-z. Epub 2020 Sep 21.

Covid-19 pandemic and the unprecedented mobilisation of scholarly efforts prompted by a health crisis: Scientometric comparisons across SARS, MERS and 2019-nCoV literature

Affiliations

Covid-19 pandemic and the unprecedented mobilisation of scholarly efforts prompted by a health crisis: Scientometric comparisons across SARS, MERS and 2019-nCoV literature

Milad Haghani et al. Scientometrics. 2020.

Abstract

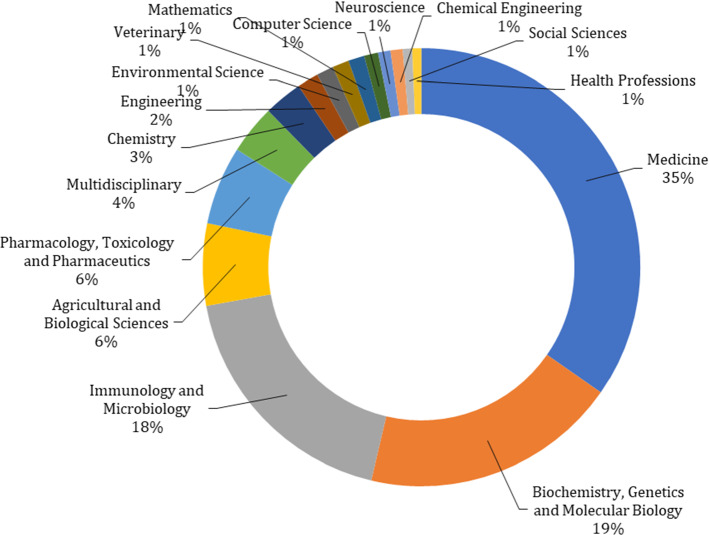
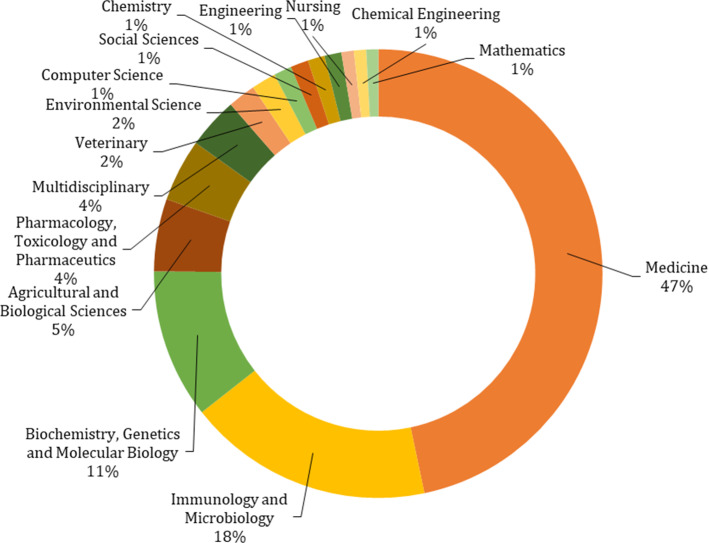
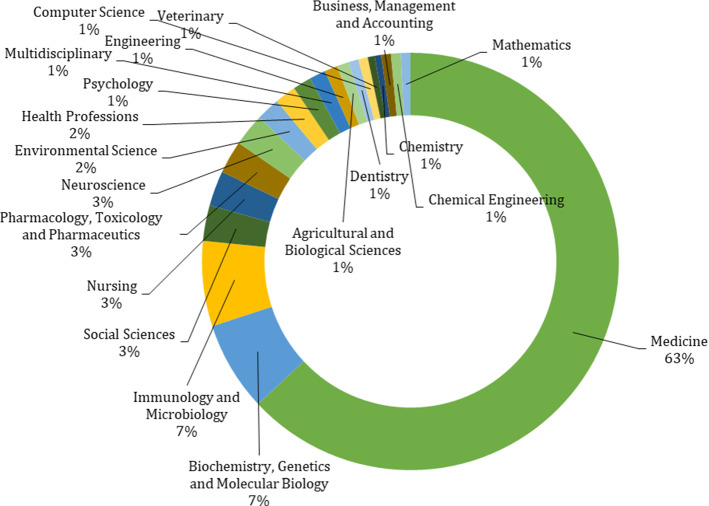
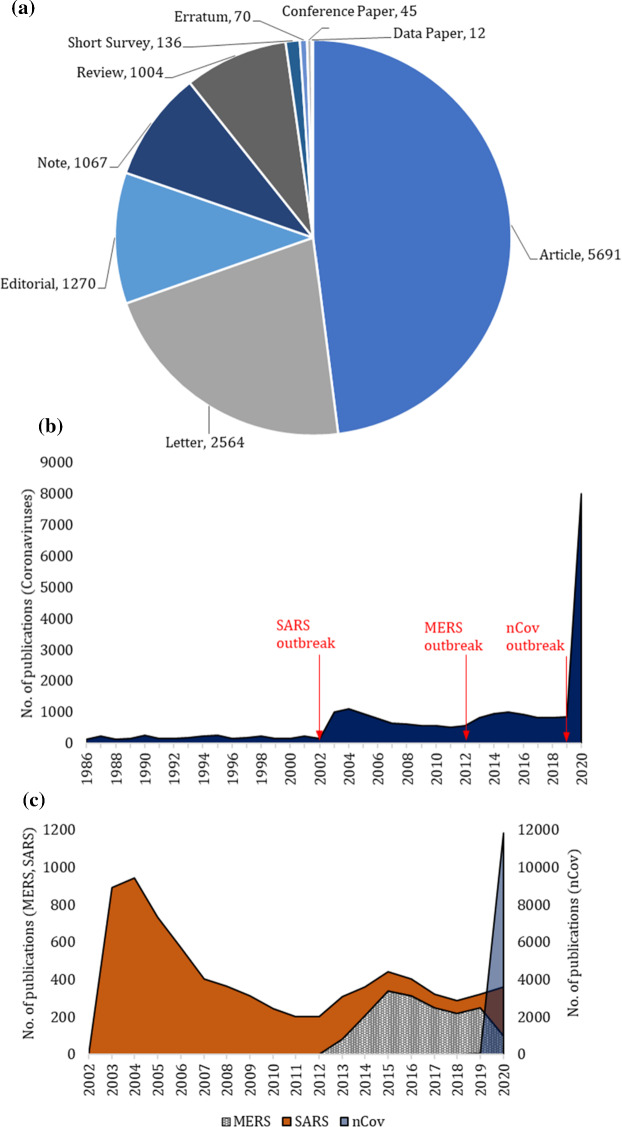
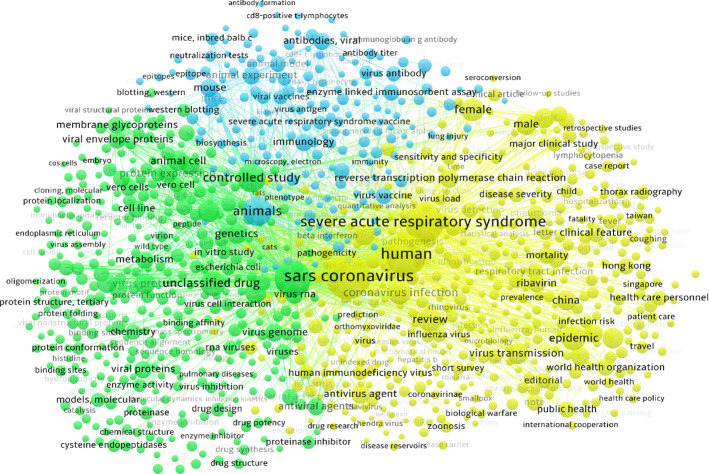
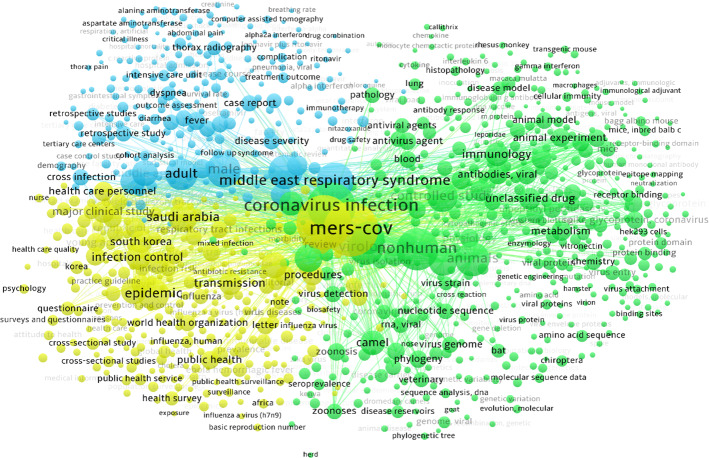
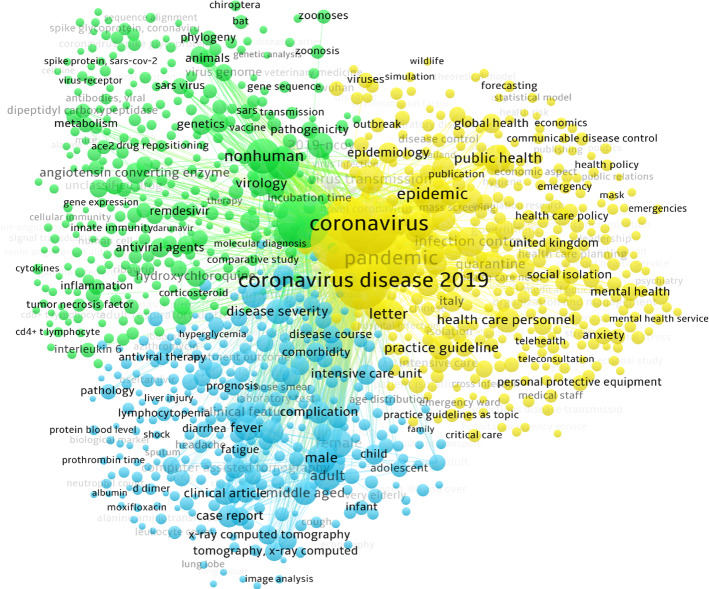
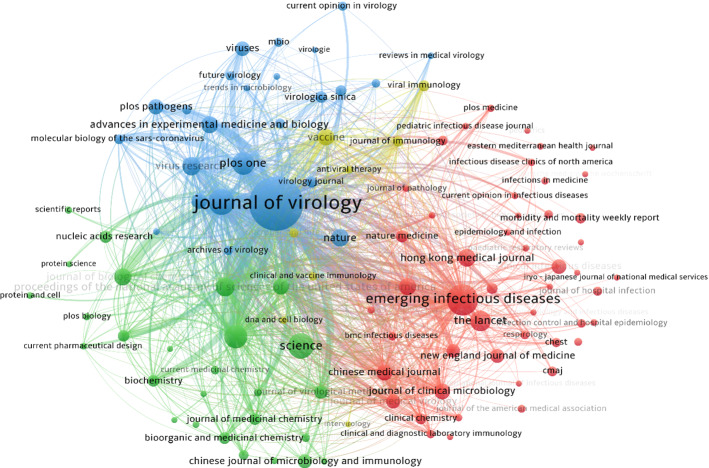
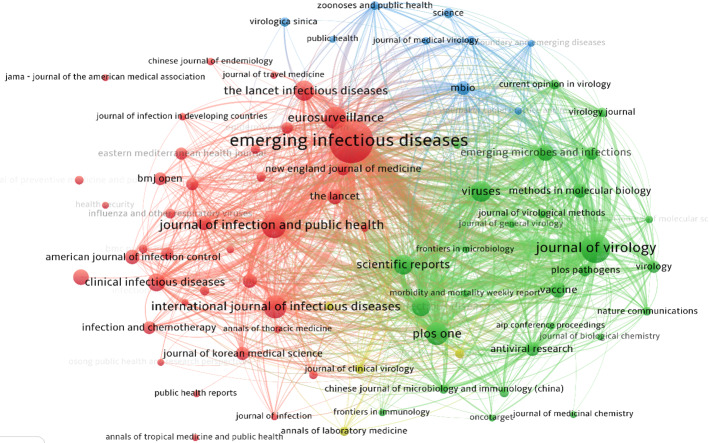
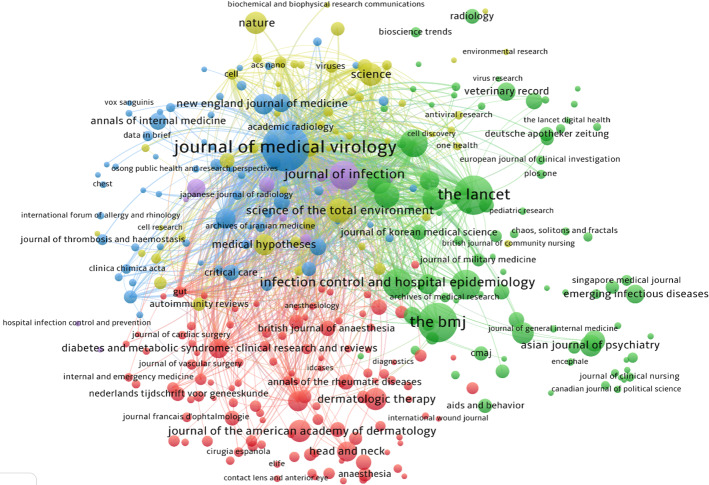
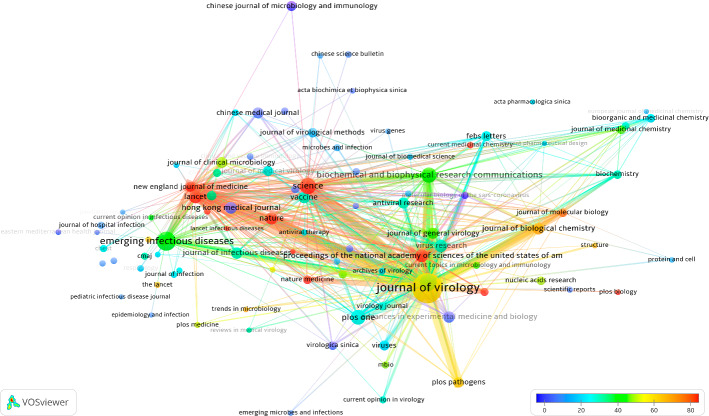
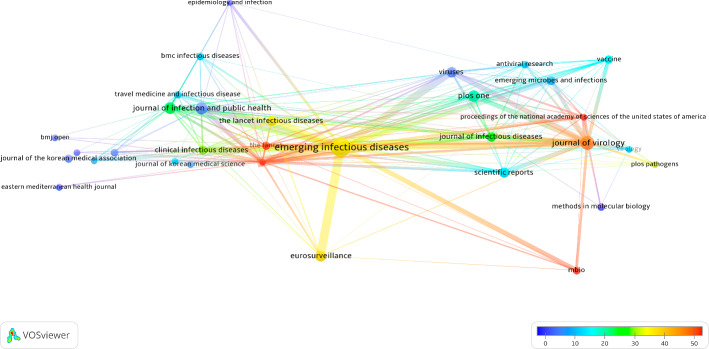
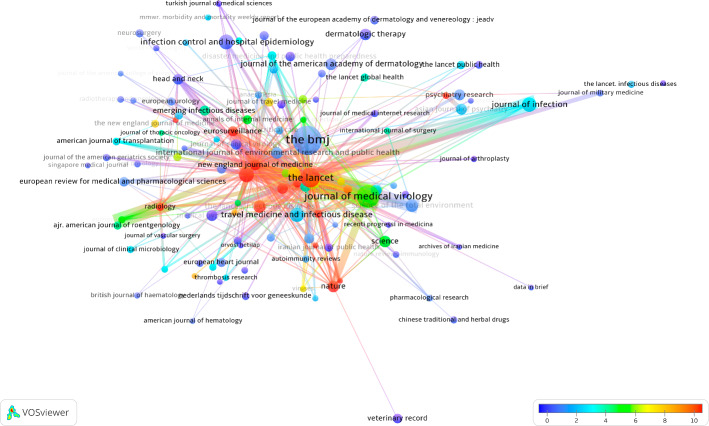
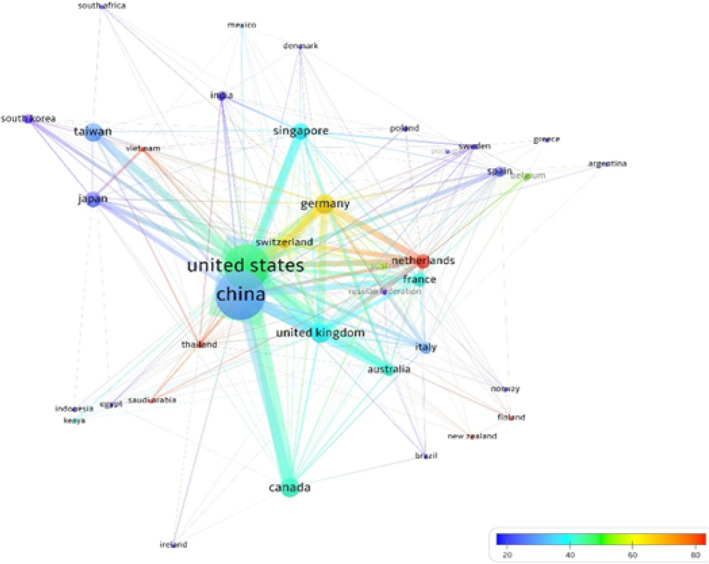
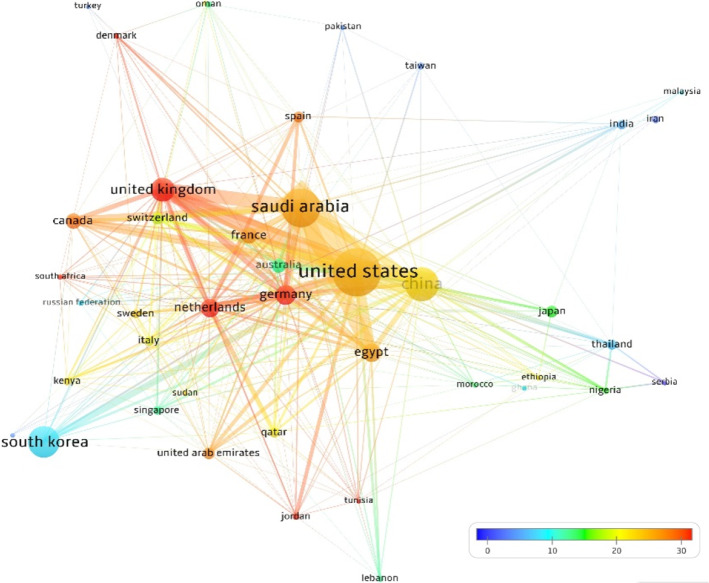
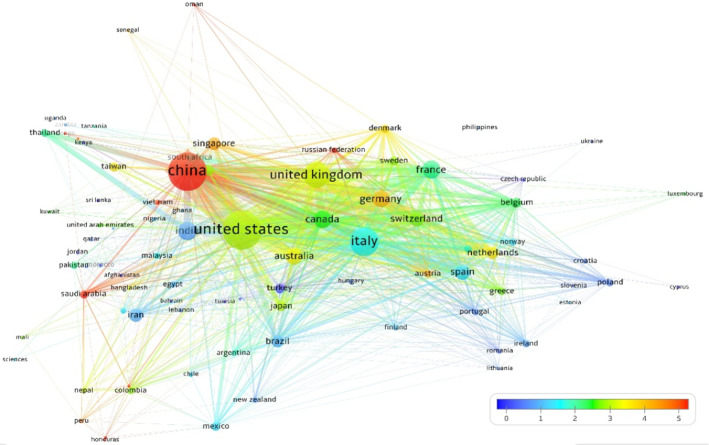
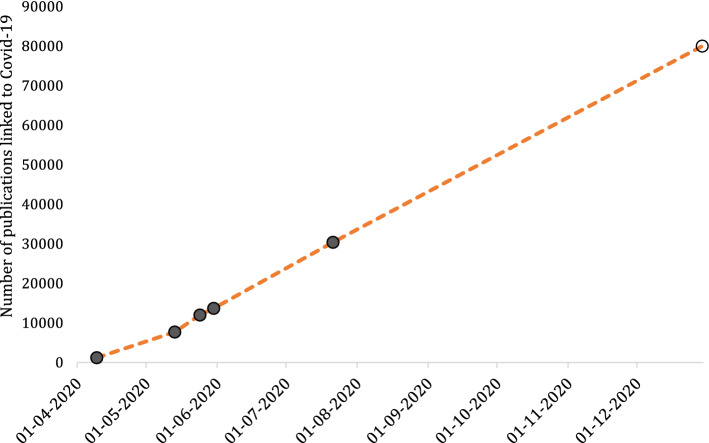
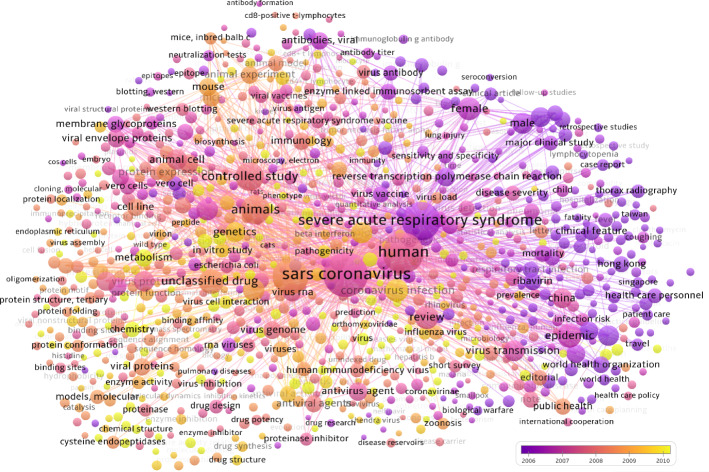
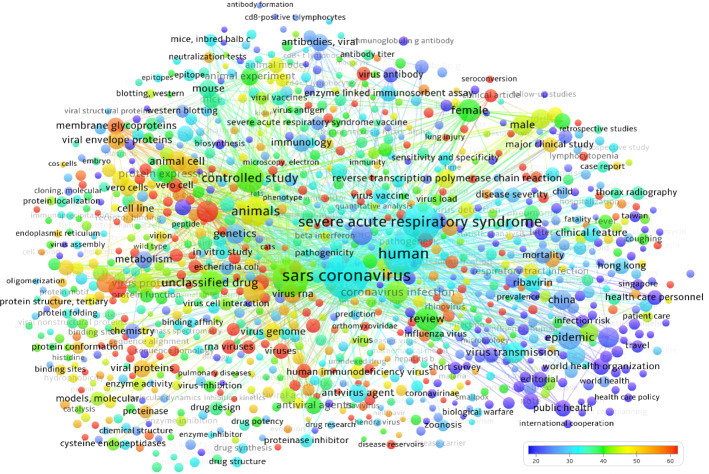
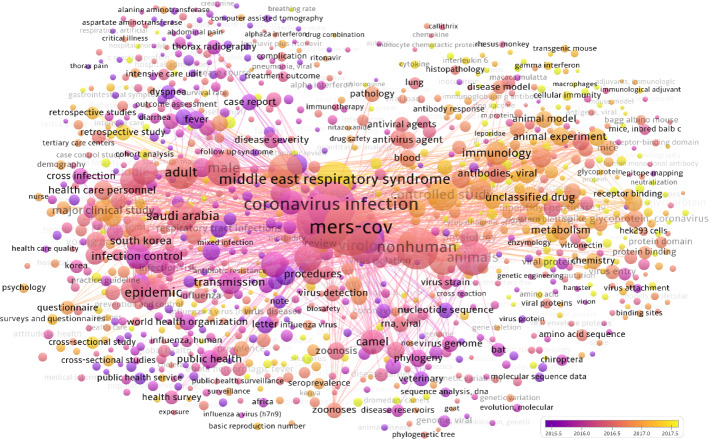
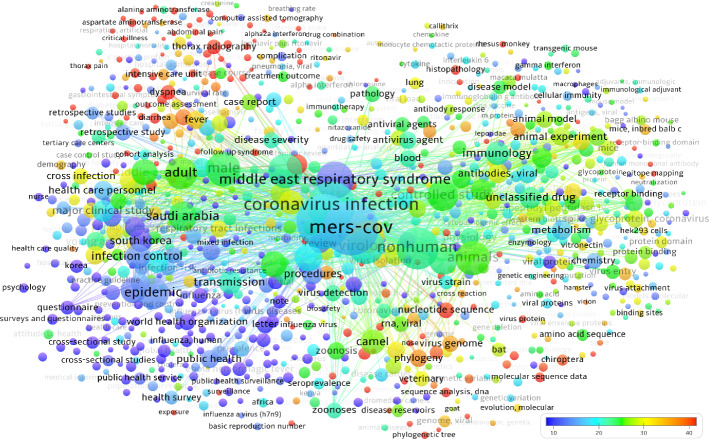
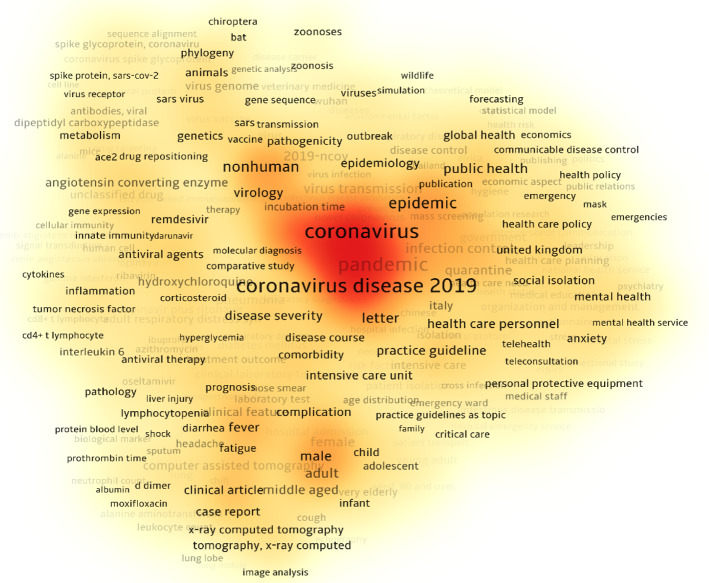
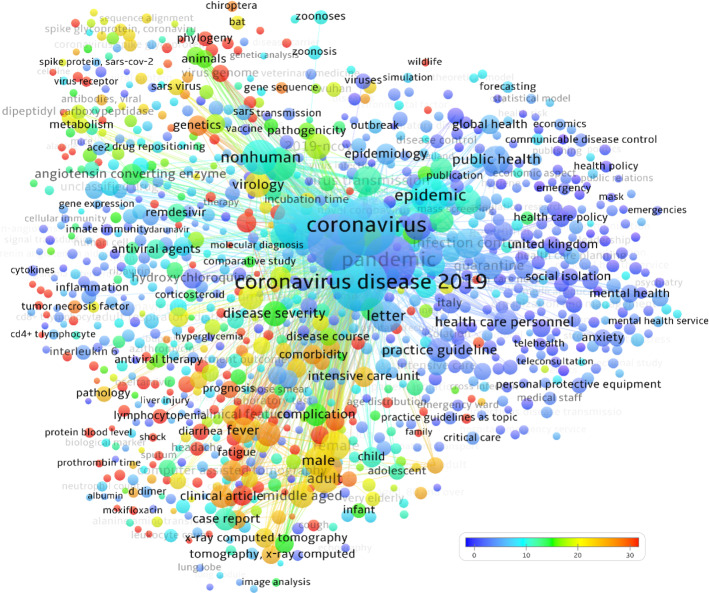
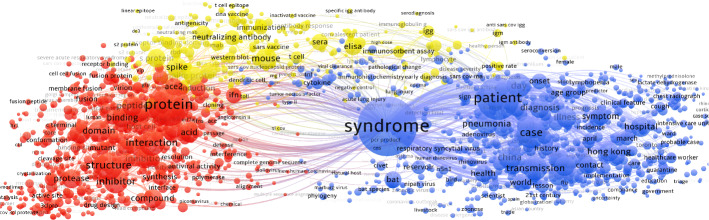
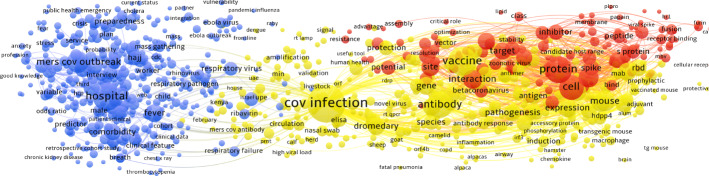
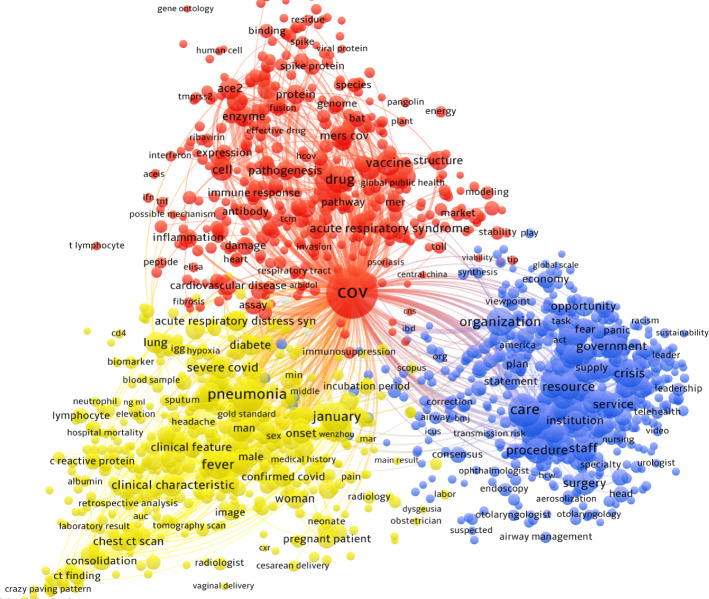
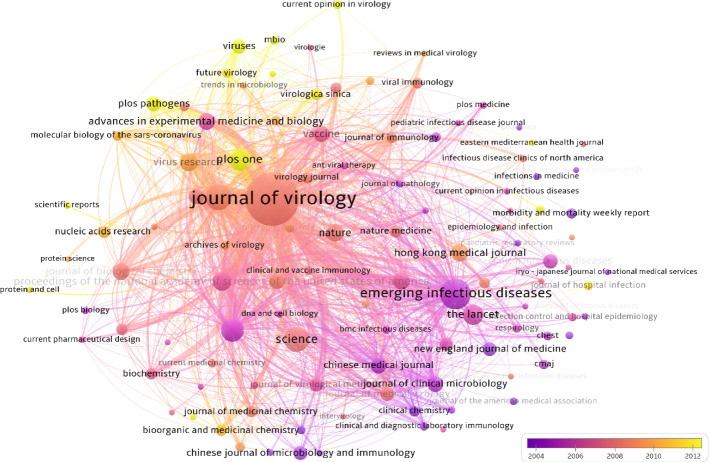
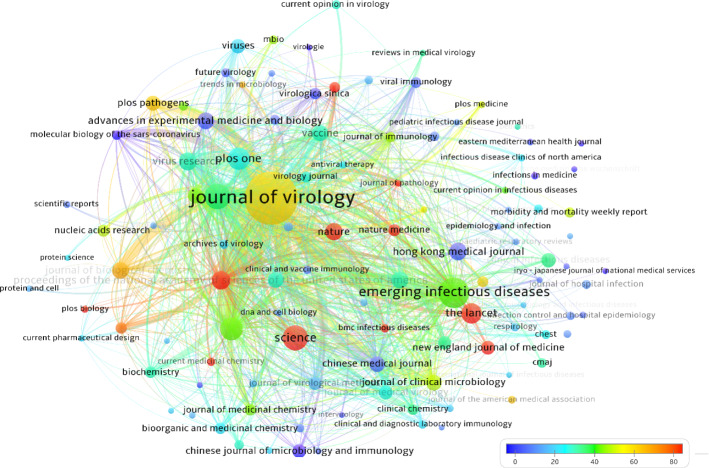
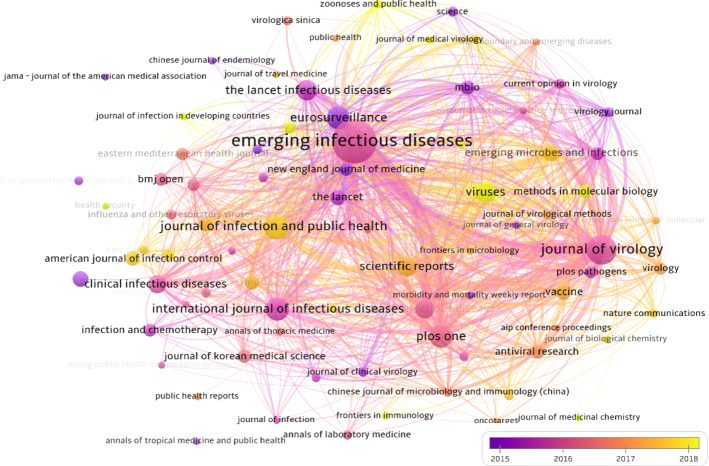
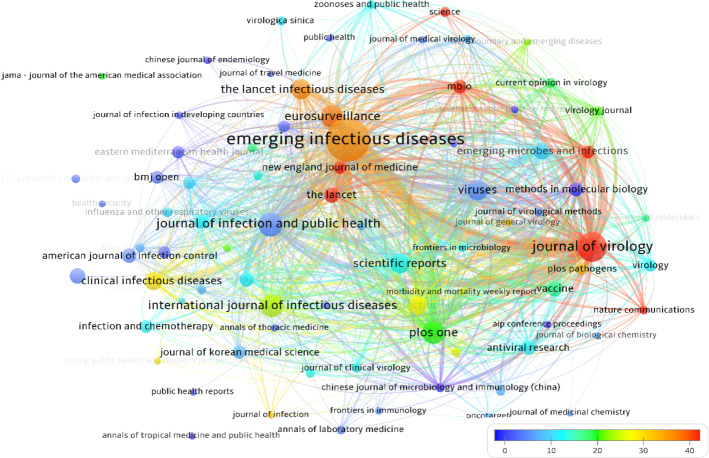
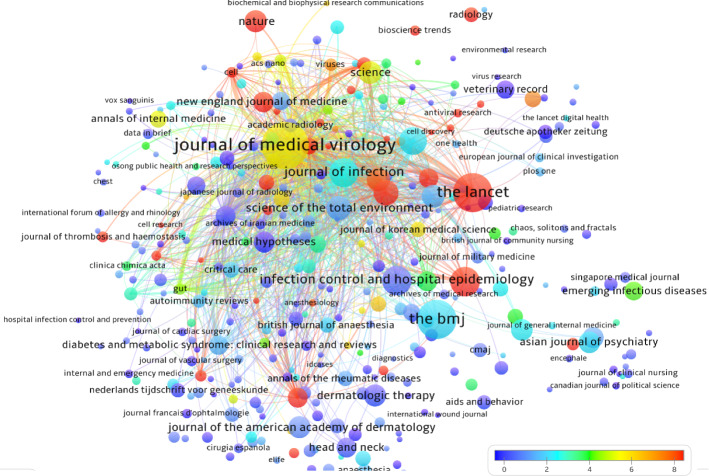
During the current century, each major coronavirus outbreak has triggered a quick and immediate surge of academic publications on its respective topic. The spike in research publications following the 2019 Novel Coronavirus (Covid-19) outbreak, however, has been like no other. The global crisis caused by the Covid-19 pandemic has mobilised scientific efforts at an unprecedented scale. In less than 5 months, more than 12,000 research items and in less than seven months, more than 30,000 items were indexed, while it is projected that the number could exceed 80,000 by the end of 2020, should the current trend continues. With the health crisis affecting all aspects of life, research on Covid-19 seems to have become a focal point of interest across many academic disciplines. Here, scientometric aspects of the Covid-19 literature are analysed and contrasted with those of the two previous major coronavirus diseases, i.e., Severe Acute Respiratory Syndrome (SARS) and Middle East Respiratory Syndrome (MERS). The focus is on the co-occurrence of key-terms, bibliographic coupling and citation relations of journals and collaborations between countries. Interesting recurring patterns across all three literatures were discovered. All three outbreaks have commonly generated three distinct cohorts of studies: (i) studies linked to public health response and epidemic control, (ii) studies on chemical constitution of the virus; and (iii) studies related to treatment, vaccine and clinical care. While studies affiliated with category (i) seem to have been relatively earliest to emerge, they have overall received relatively smaller number of citations compared to publications the two other categories. Covid-19 studies seem to have been disseminated across a broader variety of journals and across a more diverse range of subject areas. Clear links are observed between the geographical origins of each outbreak as well as the local geographical severity of each outbreak and the magnitude of research originated from regions. Covid-19 studies also display the involvement of authors from a broader variety of countries compared to SARS and MERS. Considering the speed at which the Covid-19-related literature is accumulating, an interesting dimension that warrants further exploration could be to assess if the quality and rigour of these publications have been affected.

Keywords: Bibliometrics; Coronaviruses; Research synthesis; Scientometrics; Viral respiratory diseases.


Figures

Fig. 1
Fig. 1
Distribution of SARS studies across Subject Areas
Fig. 2
Fig. 2
Distribution of MERS studies across Subject Areas
Fig. 3
Fig. 3
Distribution of Covid-19 studies across Subject Areas
Fig. 4
Fig. 4
a Distribution of Covid-19 studies across Document Types, b Temporal distribution of the number of coronavirus studies, c Temporal distribution of the SARS, MERS and Covid-19 studies
Fig. 5
Fig. 5
The map of keyword co-occurrences associated with the SARS literature
Fig. 6
Fig. 6
The map of keyword co-occurrences associated with the MERS literature
Fig. 7
Fig. 7
The map of keyword co-occurrences associated with the Covid-19 literature
Fig. 8
Fig. 8
The map of bibliographic coupling of sources associated with the SARS literature
Fig. 9
Fig. 9
The map of bibliographic coupling of sources associated with the MERS literature
Fig. 10
Fig. 10
The map of bibliographic coupling of sources associated with the Covid-19 literature
Fig. 11
Fig. 11
The map of strongest citation network of sources for SARS overlaid with the colour-coding of the average citation per document
Fig. 12
Fig. 12
The map of strongest citation network of sources for MERS overlaid with the colour-coding of the average citation per document
Fig. 13
Fig. 13
The map of strongest citation network of sources for Covid-19 overlaid with the colour-coding of the average citation per document
Fig. 14
Fig. 14
The map of country co-authorships associated with the SARS literature
Fig. 15
Fig. 15
The map of country co-authorships associated with the MERS literature
Fig. 16
Fig. 16
The map of country co-authorships associated with the Covid-19 literature
Fig. 17
Fig. 17
The number of studies related to Covid-19 indexed by Scopus at five different points in time since April 2020, along with a projection of the number at the end of 2020
Fig. 18
Fig. 18
Map of SARS keyword co-occurrence overlaid with the average publication year
Fig. 19
Fig. 19
Map of SARS keyword co-occurrence overlaid with the average citation number
Fig. 20
Fig. 20
The map of keyword co-occurrence for MERS overlaid with the colour-coding of the average year of publication
Fig. 21
Fig. 21
The map of keyword co-occurrence for MERS overlaid with the colour-coding of the average citation number
Fig. 22
Fig. 22
The heatmap of keyword co-occurrence for Covid-19
Fig. 23
Fig. 23
The map of keyword co-occurrence for Covid-19 overlaid with the colour-coding the average citation number
Fig. 24
Fig. 24
The map of term co-occurrence for SARS based on text analysis of titles and abstracts
Fig. 25
Fig. 25
The map of term co-occurrence for MERS based on text analysis of titles and abstract
Fig. 26
Fig. 26
The map of term co-occurrence for MERS based on text analysis of titles and abstracts
Fig. 27
Fig. 27
The map of bibliographic coupling of sources for SARS overlaid with the colour-coding of the average publication year
Fig. 28
Fig. 28
The map of bibliographic coupling of sources for SARS overlaid with the colour-coding of the average citation per document
Fig. 29
Fig. 29
The map of bibliographic coupling of sources for MERS overlaid with the colour-coding of the average publication year
Fig. 30
Fig. 30
The map of bibliographic coupling of sources for MERS overlaid with the colour-coding of the average citation per document
Fig. 31
Fig. 31
The map of bibliographic coupling of sources for Covid-19 overlaid with the colour-coding of the average citation per document

References

    1. Almeida J, Berry D, Cunningham C, Hamre D, Hofstad M, Mallucci L, Mcintosh K, Tyrrell D. Coronaviruses. Nature. 1968;220(650):2.
    1. Anggraeni S, Maulidina A, Dewi MW, Rahmadianti S, Rizky YPC, Arinalhaq ZF, Usdiyana D, Nandiyanto ABD, Mahdi Al-Obaidi AS. The deployment of drones in sending drugs and patient blood samples covid-19. Indonesian Journal of Science and Technology. 2020;5(2):18–25. doi: 10.17509/ijost.v5i2.24462. - DOI
    1. Barmparis GD, Tsironis GP. Estimating the infection horizon of covid-19 in eight countries with a data-driven approach. Chaos Solitons and Fractals. 2020 doi: 10.1016/j.chaos.2020.109842. - DOI - PMC - PubMed
    1. Bekiros S, Kouloumpou D. Sbdiem: A new mathematical model of infectious disease dynamics. Chaos Solitons and Fractals. 2020 doi: 10.1016/j.chaos.2020.109828. - DOI - PMC - PubMed
    1. Boccaletti S, Ditto W, Mindlin G, Atangana A. Modeling and forecasting of epidemic spreading: The case of covid-19 and beyond. Chaos Solitons and Fractals. 2020 doi: 10.1016/j.chaos.2020.109794. - DOI - PMC - PubMed

LinkOut - more resources