. 2020 Oct:139:110296.
doi: 10.1016/j.chaos.2020.110296. Epub 2020 Sep 18.

Simulation of coronavirus disease 2019 (COVID-19) scenarios with possibility of reinfection

Affiliations

Simulation of coronavirus disease 2019 (COVID-19) scenarios with possibility of reinfection

Egor Malkov. Chaos Solitons Fractals. 2020 Oct.

Abstract

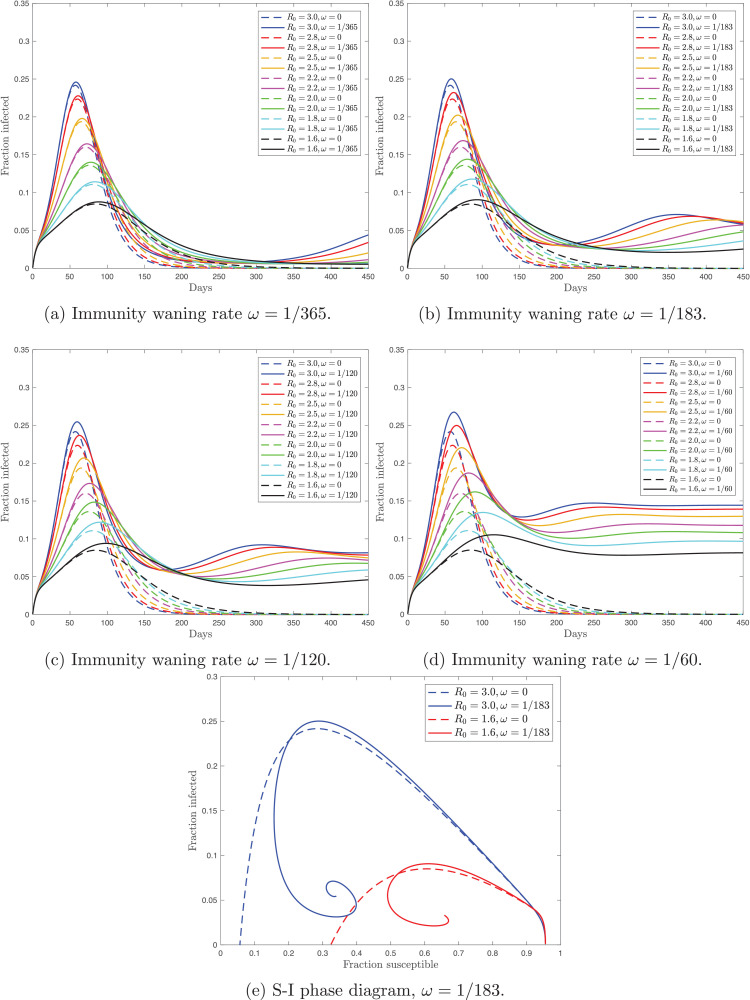
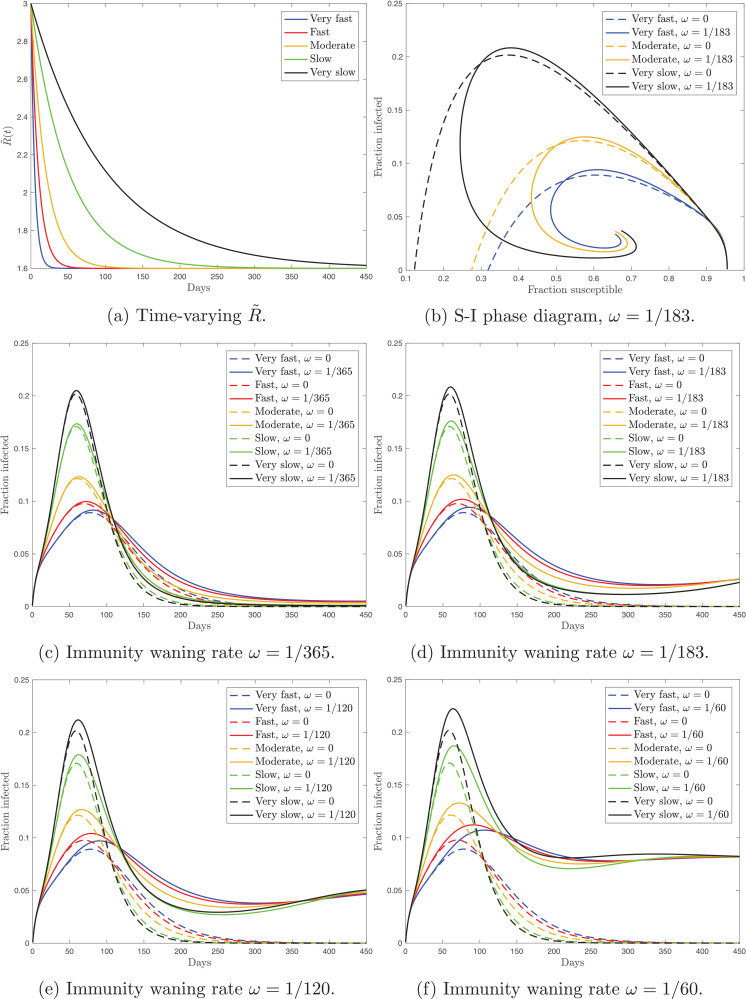
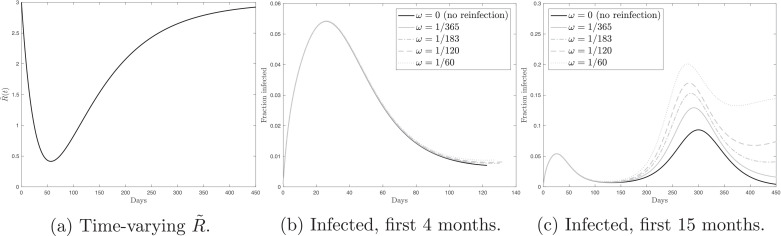
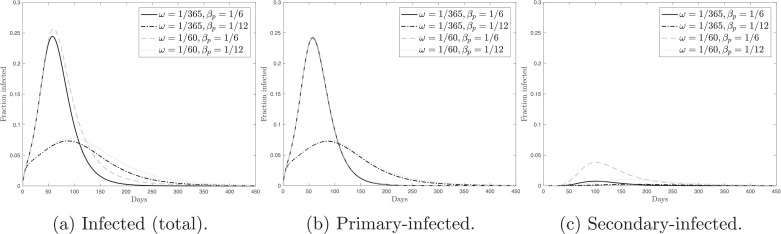
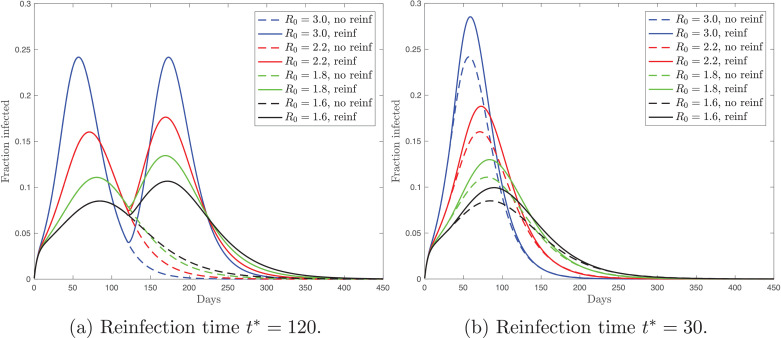
Epidemiological models of COVID-19 transmission assume that recovered individuals have a fully protected immunity. To date, there is no definite answer about whether people who recover from COVID-19 can be reinfected with the severe acute respiratory syndrome coronavirus 2 (SARS-CoV-2). In the absence of a clear answer about the risk of reinfection, it is instructive to consider the possible scenarios. To study the epidemiological dynamics with the possibility of reinfection, I use a Susceptible-Exposed-Infectious-Resistant-Susceptible model with the time-varying transmission rate. I consider three different ways of modeling reinfection. The crucial feature of this study is that I explore both the difference between the reinfection and no-reinfection scenarios and how the mitigation measures affect this difference. The principal results are the following. First, the dynamics of the reinfection and no-reinfection scenarios are indistinguishable before the infection peak. Second, the mitigation measures delay not only the infection peak, but also the moment when the difference between the reinfection and no-reinfection scenarios becomes prominent. These results are robust to various modeling assumptions.

Keywords: COVID-19; Epidemiological dynamics; Mitigation; Reinfection; SEIRS model.


Conflict of interest statement

The authors declare that they have no known competing financial interests or personal relationships that could have appeared to influence the work reported in this paper.

Figures

Fig. 1
Fig. 1
Panels (a)–(d) show the fraction of the actively infected population over time under the reinfection (solid) and no-reinfection (dashed) scenarios and with different values of the basic reproduction number, R0. Panels (a)–(d) differ in the size of the immunity waning ratio, ω. Panel (e) contains the phase diagram that shows the evolution of the fraction of the actively infected population against the fraction of the susceptible population with and without reinfection.
Fig. 2
Fig. 2
Panel (a) shows the time paths for the time-varying reproduction number, R˜. Panel (b) contains the phase diagram that shows the evolution of the fraction of the actively infected population against the fraction of the susceptible population with and without reinfection. Panels (c)–(e) show the fraction of the actively infected population over time under the reinfection (solid) and no-reinfection (dashed) scenarios and with different speed of the change in R˜. Panels (c)–(e) differ in the size of the immunity waning ratio, ω.
Fig. 3
Fig. 3
Panel (a) shows the time path for the time-varying reproduction number, R˜. Panel (b) shows the fraction of the actively infected population over time under the temporary and extremely severe mitigation measures in the first 4 months. Panel (c) shows the fraction of the actively infected population over time under the temporary and extremely severe mitigation measures in the first 15 months. In panels (b) and (c), black solid line (ω=0) corresponds to the no-reinfection scenario. The grey lines (ω > 0) correspond to the reinfection scenarios. The lines coincide in panel (b).
Fig. 4
Fig. 4
Panel (a) shows the fraction of the total (primary and secondary) actively infected population over time. Panel (b) shows the fraction of the actively primary-infected population over time. Panel (c) shows the fraction of the actively secondary-infected population over time. Panels (a)–(c) consider various combinations of the immunity waning rate, ω, and the primary-transmission rate, βp.
Fig. 5
Fig. 5
Fraction of the actively infected population over time under the reinfection (solid) and no-reinfection (dashed) scenarios and with different values of the basic reproduction number, R0. Panels (a) and (b) differ in the time of reinfection.

References

    1. An J., Liao X., Xiao T., Qian S., Yuan J., Ye H., et al. Clinical Characteristics of the Recovered COVID-19 Patients with Re-Detectable Positive RNA Test. medRxiv 20200326200442222020; 10.1101/2020.03.26.20044222 - PMC - PubMed
    1. Anderson R.M., Heesterbeek H., Klinkenberg D., Hollingsworth T.D. How will country-based mitigation measures influence the course of the COVID-19 epidemic? Lancet. 2020;395(10228):931–934. doi: 10.1016/S0140-6736(20)30567-5. - DOI - PMC - PubMed
    1. Atkeson A.G. NBER working paper No 26867. 2020. What will be the economic impact of COVID-19 in the US? Rough estimates of disease scenarios. - DOI
    1. Bao L., Deng W., Gao H., Xiao C., Liu J., Xue J., et al. Reinfection Could not Occur in SARS-CoV-2 Infected Rhesus Macaques. bioRxiv, 2020; 10.1101/2020.03.13.990226
    1. Berger D.W., Huang C., Herkenhoff K.F., Mongey S. University of Chicago Unpublished Manuscript; 2020. Reopening in an SEIR model with testing and targeted quarantine.