Review
. 2020 Sep 2:12:272.
doi: 10.3389/fnagi.2020.00272. eCollection 2020.

Bridging the Gap Between Fluid Biomarkers for Alzheimer's Disease, Model Systems, and Patients

Affiliations
Review

Bridging the Gap Between Fluid Biomarkers for Alzheimer's Disease, Model Systems, and Patients

Christiana Bjorkli et al. Front Aging Neurosci. .

Abstract

Alzheimer's disease (AD) is a debilitating neurodegenerative disease characterized by the accumulation of two proteins in fibrillar form: amyloid-β (Aβ) and tau. Despite decades of intensive research, we cannot yet pinpoint the exact cause of the disease or unequivocally determine the exact mechanism(s) underlying its progression. This confounds early diagnosis and treatment of the disease. Cerebrospinal fluid (CSF) biomarkers, which can reveal ongoing biochemical changes in the brain, can help monitor developing AD pathology prior to clinical diagnosis. Here we review preclinical and clinical investigations of commonly used biomarkers in animals and patients with AD, which can bridge translation from model systems into the clinic. The core AD biomarkers have been found to translate well across species, whereas biomarkers of neuroinflammation translate to a lesser extent. Nevertheless, there is no absolute equivalence between biomarkers in human AD patients and those examined in preclinical models in terms of revealing key pathological hallmarks of the disease. In this review, we provide an overview of current but also novel AD biomarkers and how they relate to key constituents of the pathological cascade, highlighting confounding factors and pitfalls in interpretation, and also provide recommendations for standardized procedures during sample collection to enhance the translational validity of preclinical AD models.

Keywords: Alzheimer’s disease; biomarkers; cerebrospinal fluid; screening tools; translational research.


Figures

BOX 1
BOX 1
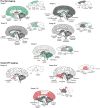
Spatiotemporal pattern of Aβ and NFT deposition during the AD disease cascade in the human and mouse brain. Stages of Aβ deposition in the AD brain (Gomez-Isla et al., 1996). Stage I is characterized by exclusively neocortical Aβ deposits (neocortex: green) (Gomez-Isla et al., 1996). This includes Aβ deposits in frontal, temporal, parietal, and occipital cortices (Gomez-Isla et al., 1996). Stage II shows additional allocortical Aβ deposits (green) in entorhinal cortex, CA1, cingulate cortex, amygdala, presubiculum, and the fascia dentata (Gomez-Isla et al., 1996). In stage III, there are additional Aβ deposits in diencephalic nuclei and striatum (green) including thalamus, hypothalamus, the basal forebrain, caudate nucleus, putamen, claustrum, the lateral habenular nucleus, and white matter (Gomez-Isla et al., 1996). In stage IV there are Aβ deposits in distinct brainstem nuclei (substantia nigra, superior and inferior colliculi, inferior olivary nucleus, intermediate reticular zone, central gray of the midbrain, CA4, and the red nucleus; green) (Gomez-Isla et al., 1996). In stage V there are Aβ deposits in the cerebellum and additional brainstem nuclei (pons, locus coeruleus, reticular formation, raphe nuclei, parabrachial nuclei, and the dorsal tegmental nucleus; green) (Gomez-Isla et al., 1996). Stages of NFT deposition in the AD brain (Thal et al., 2002). Stages I-II show alterations which are confined to the superficial entorhinal cellular layer (pre-α; layer II/layer IIa) (Thal et al., 2002; Freudenberg-Hua et al., 2018). The next stage is an aggravation of stage I (Thal et al., 2002). Stages III-IV lead to severe involvement of the entorhinal and transentorhinal layer pre-α (pink) (Thal et al., 2002). Stage IV is characterized by layer pre-α, pri-α (layer V) (Freudenberg-Hua et al., 2018), and pre-β (layer III; layer IIb) (Thal et al., 2002; Freudenberg-Hua et al., 2018) involvement. CA1, the basolateral nuclei of the amygdala, the reuniens nucleus, the antero-dorsal thalamic nucleus, putamen, and nucleus accumbens are densely filled with NFTs (Thal et al., 2002). Stages V-VI are marked by isocortical destruction (pink) (Thal et al., 2002). In stage V, the deep layer pri-α is severely involved. Layers pre-β and pre-γ (layer III) (Freudenberg-Hua et al., 2018) are also affected (Thal et al., 2002). Virtually all components of the hippocampal formation are involved, and the isocortex is severely affected (Thal et al., 2002). By stage VI, the subcortical nuclei show a much more pronounced involvement (Thal et al., 2002), and considerable nerve cell loss is seen in layers pre-α and pri-α (Thal et al., 2002). Grayscale represents the recency of involved regions for each stage of neuropathology. Human brain regions adapted from Jürgen et al. (2016); mouse brain regions adapted from Allen brain atlas (Sunkin et al., 2013).
FIGURE 1
FIGURE 1
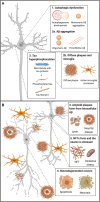
Early and late timepoints of neuropathological development in AD. (A) Early molecular abnormalities leading to the development of neuropathological hallmarks in AD. First, disruption of endocytic and autophagic systems may lead to, or simultaneously become disrupted, as monomeric Aβ aggregates. Following, monomeric Aβ aggregates into oligomeric and protofibrillar forms. At the same time, diffuse amyloid plaques may be present extracellularly and begin to sequester Aβ from synapses, leading to microglial activation (and other inflammatory responses). Next, tau proteins become hyperphosphorylated and move from the axon to the somatodendritic compartment of the neuron. (B) Late molecular abnormalities in AD. While diffuse plaques are present extracellularly and may become neuritic by sequestering Aβ peptides from the synapse, a lysis event of the neuron occurs, and intracellular protofibrillar Aβ is deposited into the extracellular space leading to the development of neuritic plaques (composed of fibrillar Aβ). Other amyloid plaques in close vicinity may sequester Aβ peptides between each other, leading to the increased accumulation of neuritic plaques. Next, hyperphosphorylated tau from paired helical filaments form NFTs which results in excitotoxicity and oxidative stress. Ultimately neurodegeneration of the neuron occurs, primarily by necrosis, but apoptosis may also occur from some intracellular processes. Aβ, amyloid-β; NFT, neurofibrillary tangle.
FIGURE 2
FIGURE 2
Chronobiological biomarkers to Alzheimer’s disease clinical stage. This disease model displays that biomarkers become abnormal in a temporally ordered manner as the disease progresses (Jack et al., 2010). Amyloid plaque biomarkers are dynamic early in the disease, prior to the appearance of clinical symptoms, and have largely reached a plateau by the time clinical symptoms appear (Jack et al., 2010). Biomarkers of neuronal injury, dysfunction, and degeneration are dynamic later in the disease and correlate with clinical symptom severity. MRI is the last biomarker to become aberrant. None of the biomarkers are static, and rates of change in each biomarker vary over time and follow a non-linear time-course, which is hypothesized to be sigmoid shaped (Jack et al., 2010). A sigmoid shape as a function of time implies that the maximum effect of each biomarker varies over the course of disease progression (Jack et al., 2010). Figure adapted with permission from Leclerc and Abulrob (2013). MCI, mild cognitive impairment; CSF, cerebrospinal fluid; Aβ, amyloid-β; PET, positron emission tomography; FDG, fluorine-based tracers; MRI, magnetic resonance imaging; t-tau, total tau; p-tau, phosphorylated tau.
FIGURE 3
FIGURE 3
AD molecular processes that can be detected by biomarkers. Amyloid plaques: a widely used biomarker for diagnosis in AD is the concentration of CSF Aβ42 and Aβ40 (Rogeberg et al., 2015). Studies have shown that CSF Aβ42 can detect amyloid pathology earlier than amyloid PET imaging (Palmqvist et al., 2016). Some research shows that serum Aβ42 levels do not correlate with CSF levels (Liu et al., 2004), whereas others have found that plasma Aβ can be measured with good sensitivity (Lee et al., 2019). Several S100 proteins (S100B, S100A1, S100A6, S100A8, S100A9, and S100A12) are found within amyloid plaques and in astrocytes and/or microglia near amyloid deposits (Boom et al., 2004; Shepherd et al., 2006; Walker et al., 2006; Ha et al., 2010; Afanador et al., 2014; Lodeiro et al., 2017). NFTs: increased CSF tau is a sensitive biomarker for neurodegeneration, but CSF p-tau is more specific to neurodegeneration linked to AD (Lewczuk et al., 2004; Blennow et al., 2015). P-tau is secreted via exosomal release, and reaches the CSF (Saman et al., 2012). Increased levels of CSF t-tau and p-tau can predict the progression of cognitive symptoms better than CSF Aβ42 (El Kadmiri et al., 2018), but the diagnostic utility of CSF t-tau and p-tau are improved when measured in combination with Aβ42 (Dubois et al., 2014). Increased plasma tau observed in AD patients compared to MCI patients and healthy controls (Mattsson et al., 2016; Pase et al., 2019). S100B and S100A9 are found within NFTs (Sheng et al., 1994, 1997; Shepherd et al., 2006). Autophagy: late stages of autophagy is disrupted in AD patients, as an accumulation of autophagic vesicles can be observed in dystrophic neurites (Komatsu et al., 2006), and are observed prior to extracellular Aβ deposition (Mehrpour et al., 2010; Nixon and Yang, 2011). Microglia: YKL-40 is expressed by microglia. CSF TREM2 is associated with higher CSF t-tau and p-tau levels, probably reflecting a corresponding change in microglia activation in response to neurodegeneration (Suarez-Calvet et al., 2016). It has been shown that AD patients have higher levels of interleukin-6, 12, and 18, TNF-α and TGF-β, in blood, and higher levels of TGF-β in CSF, compared to healthy controls (Swardfager et al., 2010). Decreases in CSF neuronal CX3CL1 is found in AD patients (Perea et al., 2018). Astrocytes: YKL-40 is expressed in astrocytes near Aβ plaques (Craig-Schapiro et al., 2010) and correlates positively with tau pathology (Querol-Vilaseca et al., 2017; Janelidze et al., 2018). Axon terminals: CSF levels of SNAP-25 (Brinkmalm et al., 2014; Sutphen et al., 2018) and synaptotagmin (Öhrfelt et al., 2016) have been found at elevated levels in patients with AD or MCI compared with control subjects. Synaptic neurodegeneration can be detected by DTI or FDG-PET (Shen et al., 2018). Dendrites: increased CSF neurogranin is found in MCI and AD patients as compared with healthy controls (Thorsell et al., 2010; De Vos et al., 2015). Axon: increased neurofilament light is observed in response to axonal damage, which occurs in AD. The core CSF biomarkers (Aβ42, t-tau, and p-tau) and CSF neurofilament light levels strongly correlated with AD (Olsson et al., 2016). Blood levels of this protein strongly correlate with its CSF levels (Gisslen et al., 2016; Kuhle et al., 2016; Rojas et al., 2016). Mitochondria: studies have shown that TDP-43 contributes to neuroinflammation and may have a role in mitochondrial and neuronal dysfunction (James et al., 2016). NAD+ levels can be detected in CSF and plasma in early AD. Extracellular: miRNAs released from exosomes appear to be associated with neurodegenerative aspects in AD (Wang et al., 2008, 2012; Chen et al., 2017). Studies have reported that changes in levels of blood miRNA distinguished AD patients from healthy controls with 93% accuracy (Leidinger et al., 2013; Swarbrick et al., 2019). AD, Alzheimer’s disease; CSF, cerebrospinal fluid; Aβ, amyloid-β; PET, positron emission tomography; NFTs, neurofibrillary tangles; p-tau, phosphorylated tau; t-tau, total tau; MCI, mild cognitive impairment; TREM2, triggering receptor expressed on myeloid cells 2; TNF-α, tumor necrosis factor-α; TGF-β, transforming growth factor-β; CX3CL1, CX3 chemokine ligand 1; SNAP-25, synaptosomal-associated protein 25; TDP-43, transactive response element (TAR) deoxyribonucleic acid (DNA)-binding protein 43; NAD+, oxidized nicotinamide adenine dinucleotide; miRNA, microRNA.
FIGURE 4
FIGURE 4
A comparison of pathology and subsequent symptoms along the AD disease cascade between a preclinical model and patients. In the 3xTg AD mouse model (Oddo et al., 2003), cognitive impairment is observed at 3 months of age, whereas amyloid plaques and gliosis are present at 6 months of age. Tau pathology is first present at 12 months of age. In the typical sporadic AD patient, amyloid plaques and associated gliosis may be abundant at 50 years of age, and this pathology is followed by NFTs at approximately 60 years of age. Between 70 and 80 years of age, neurodegeneration occurs, and cognitive impairment becomes prominent in patients. AD, Alzheimer’s disease; NFTs, neurofibrillary tangles. Images were generated using BioRender or taken from a public database.

References

    1. Afanador L., Roltsch E. A., Holcomb L., Campbell K. S., Keeling D. A., Zhang Y., et al. (2014). The Ca2+ sensor S100A1 modulates neuroinflammation, histopathology and Akt activity in the PSAPP Alzheimer’s disease mouse model. Cell Calcium. 56 68–80. 10.1016/j.ceca.2014.05.002 - DOI - PubMed
    1. Ahmed Z., Cooper J., Murray T. K., Garn K., McNaughton E., Clarke H., et al. (2014). A novel in vivo model of tau propagation with rapid and progressive neurofibrillary tangle pathology: the pattern of spread is determined by connectivity, not proximity. Acta Neuropathol. 127 667–683. 10.1007/s00401-014-1254-6 - DOI - PMC - PubMed
    1. Akama K., Van Eldik L. (2000). β-Amyloid stimulation of Inducible nitric-oxide synthase in astrocytes Is interleukin-1β- and tumor necrosis factor-α (TNFα)-dependent, and involves a TNFα receptor-associated factor- and nfκb-inducing kinase-dependent signaling mechanism. J. Biol. Chem. 275 7918–7924. 10.1074/jbc.275.11.7918 - DOI - PubMed
    1. Akiyama H., Barger S., Barnum S., Bradt B., Bauer J., Cole G. M., et al. (2000). Inflammation and Alzheimer’s disease. Neurobiol. Aging 21 383–421. 10.1016/s0197-4580(00)00124-x - DOI - PMC - PubMed
    1. Albright C. F., Dockens R. C., Meredith J. E., Olson R. E., Slemmon R., Lentz K. A., et al. (2013). Pharmacodynamics of selective inhibition of γ-secretase by avagacestat. J. Pharmacol. Exp. Ther. 344 686–695. 10.1124/jpet.112.199356 - DOI - PubMed