

Analysis of Co-inhibitory Receptor Expression in COVID-19 Infection Compared to Acute Plasmodium falciparum Malaria: LAG-3 and TIM-3 Correlate With T Cell Activation and Course of Disease
- PMID: 32983106
- PMCID: PMC7479337
- DOI: 10.3389/fimmu.2020.01870
Analysis of Co-inhibitory Receptor Expression in COVID-19 Infection Compared to Acute Plasmodium falciparum Malaria: LAG-3 and TIM-3 Correlate With T Cell Activation and Course of Disease
Abstract
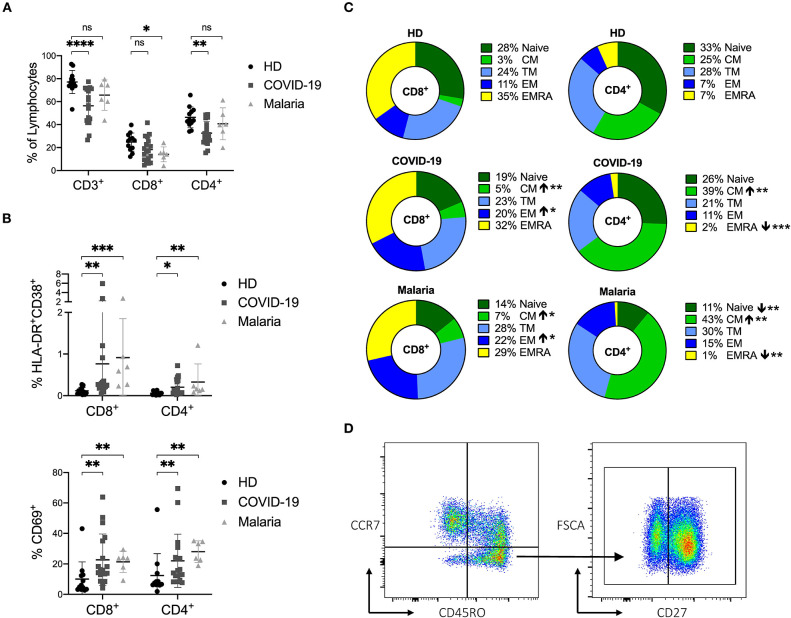
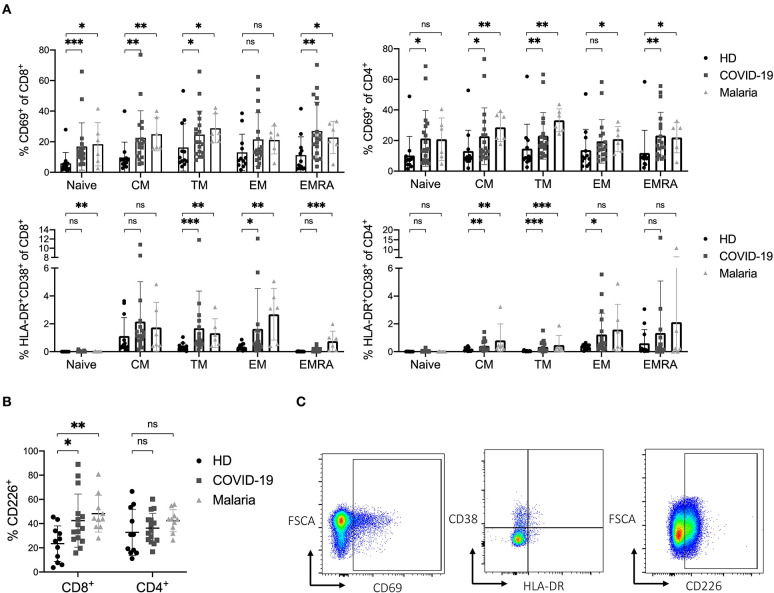
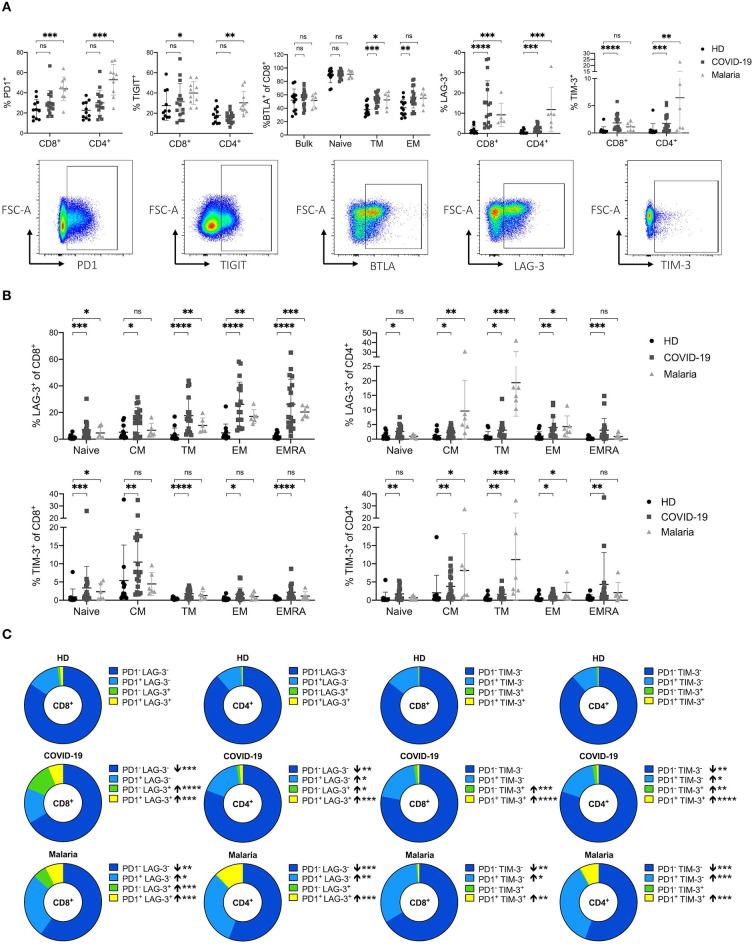
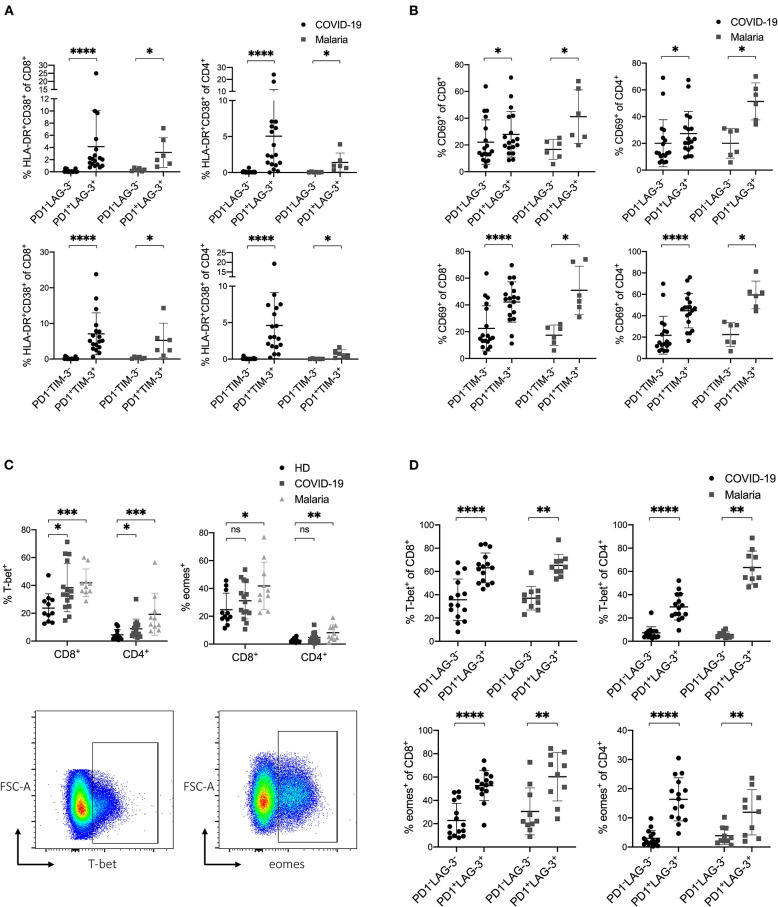
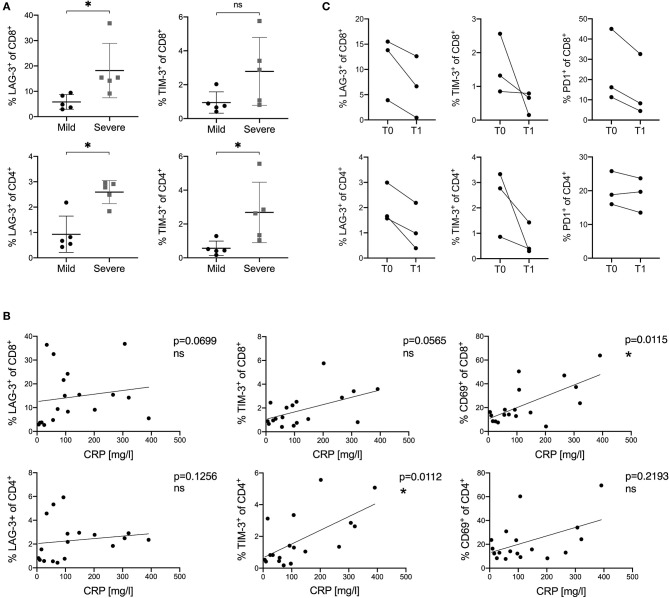
Coronavirus disease 2019 (COVID-19) which is caused by the novel SARS-CoV-2 virus is a severe flu-like illness which is associated with hyperinflammation and immune dysfunction. The virus induces a strong T and B cell response but little is known about the immune pathology of this viral infection. Acute Plasmodium falciparum malaria also causes acute clinical illness and is characterized by hyperinflammation due to the strong production of pro-inflammatory cytokines and a massive activation of T cells. In malaria, T cells express a variety of co-inhibitory receptors which might be a consequence of their activation but also might limit their overwhelming function. Thus, T cells are implicated in protection as well as in pathology. The outcome of malaria is thought to be a consequence of the balance between co-activation and co-inhibition of T cells. Following the hypothesis that T cells in COVID-19 might have a similar, dual function, we comprehensively characterized the differentiation (CCR7, CD45RO) and activation status (HLA-DR, CD38, CD69, CD226), the co-expression of co-inhibitory molecules (PD1, TIM-3, LAG-3, BTLA, TIGIT), as well as the expression pattern of the transcription factors T-bet and eomes of CD8+ and CD4+ T cells of PBMC of n = 20 SARS-CoV-2 patients compared to n = 10 P. falciparum infected patients and n = 13 healthy controls. Overall, acute COVID-19 and malaria infection resulted in a comparably elevated activation and altered differentiation status of the CD8+ and CD4+ T cell populations. T effector cells of COVID-19 and malaria patients showed higher frequencies of the inhibitory receptors T-cell immunoglobulin mucin-3 (TIM-3) and Lymphocyte-activation gene-3 (LAG-3) which was linked to increased activation levels and an upregulation of the transcription factors T-bet and eomes. COVID-19 patients with a more severe disease course showed higher levels of LAG-3 and TIM-3 than patients with a mild disease course. During recovery, a rapid normalization of these inhibitory receptors could be observed. In summary, comparing the expression of different co-inhibitory molecules in CD8+ and CD4+ T cells in COVID-19 vs. malaria, there is a transient increase of the expression of certain inhibitory receptors like LAG-3 and TIM-3 in COVID-19 in the overall context of acute immune activation.
Keywords: COVID-19; LAG-3; PD-1; Plasmodium falciparum; SARS-CoV-2; T cells; TIM-3; malaria.
Copyright © 2020 Herrmann, Schulte, Wildner, Wittner, Brehm, Ramharter, Woost, Lohse, Jacobs and Schulze zur Wiesch.
Figures
Similar articles
-
T cells expressing multiple co-inhibitory molecules in acute malaria are not exhausted but exert a suppressive function in mice.Eur J Immunol. 2022 Feb;52(2):312-327. doi: 10.1002/eji.202149424. Epub 2021 Nov 25. Eur J Immunol. 2022. PMID: 34752634
-
Differential expression pattern of co-inhibitory molecules on CD4+ T cells in uncomplicated versus complicated malaria.Sci Rep. 2018 Mar 19;8(1):4789. doi: 10.1038/s41598-018-22659-1. Sci Rep. 2018. PMID: 29555909 Free PMC article.
-
Deciphering the Plasmodium falciparum malaria-specific CD4+ T-cell response: ex vivo detection of high frequencies of PD-1+TIGIT+ EXP1-specific CD4+ T cells using a novel HLA-DR11-restricted MHC class II tetramer.Clin Exp Immunol. 2022 Apr 4;207(2):227-236. doi: 10.1093/cei/uxab027. Clin Exp Immunol. 2022. PMID: 35020841 Free PMC article.
-
Lag-3, Tim-3, and TIGIT: Co-inhibitory Receptors with Specialized Functions in Immune Regulation.Immunity. 2016 May 17;44(5):989-1004. doi: 10.1016/j.immuni.2016.05.001. Immunity. 2016. PMID: 27192565 Free PMC article. Review.
-
Cerebral malaria pathogenesis: Dissecting the role of CD4+ and CD8+ T-cells as major effectors in disease pathology.Int Rev Immunol. 2024;43(5):309-325. doi: 10.1080/08830185.2024.2336539. Epub 2024 Apr 15. Int Rev Immunol. 2024. PMID: 38618863 Review.
Cited by
-
Immunomodulatory Potential of Non-Classical HLA-G in Infections including COVID-19 and Parasitic Diseases.Biomolecules. 2022 Feb 4;12(2):257. doi: 10.3390/biom12020257. Biomolecules. 2022. PMID: 35204759 Free PMC article.
-
A comprehensive review about immune responses and exhaustion during coronavirus disease (COVID-19).Cell Commun Signal. 2022 Jun 2;20(1):79. doi: 10.1186/s12964-022-00856-w. Cell Commun Signal. 2022. PMID: 35655192 Free PMC article. Review.
-
Physical activity and exercise as an essential medical strategy for the COVID-19 pandemic and beyond.Exp Biol Med (Maywood). 2021 Nov;246(21):2324-2331. doi: 10.1177/15353702211028543. Epub 2021 Jul 7. Exp Biol Med (Maywood). 2021. PMID: 34233523 Free PMC article.
-
Multi-dimensional and longitudinal systems profiling reveals predictive pattern of severe COVID-19.iScience. 2021 Jul 23;24(7):102752. doi: 10.1016/j.isci.2021.102752. Epub 2021 Jun 19. iScience. 2021. PMID: 34179733 Free PMC article.
-
PDGFR kinase inhibitor protects against septic death via regulation of BTLA.Sci China Life Sci. 2022 Oct;65(10):1917-1928. doi: 10.1007/s11427-021-2136-y. Epub 2022 Sep 29. Sci China Life Sci. 2022. PMID: 35918604 Free PMC article.
References
Publication types
MeSH terms
Substances
Grants and funding
LinkOut - more resources
Full Text Sources
Research Materials
Miscellaneous