

Increased Neutrophil Count and Decreased Neutrophil CD15 Expression Correlate With TB Disease Severity and Treatment Response Irrespective of HIV Co-infection
- PMID: 32983107
- PMCID: PMC7485225
- DOI: 10.3389/fimmu.2020.01872
Increased Neutrophil Count and Decreased Neutrophil CD15 Expression Correlate With TB Disease Severity and Treatment Response Irrespective of HIV Co-infection
Abstract
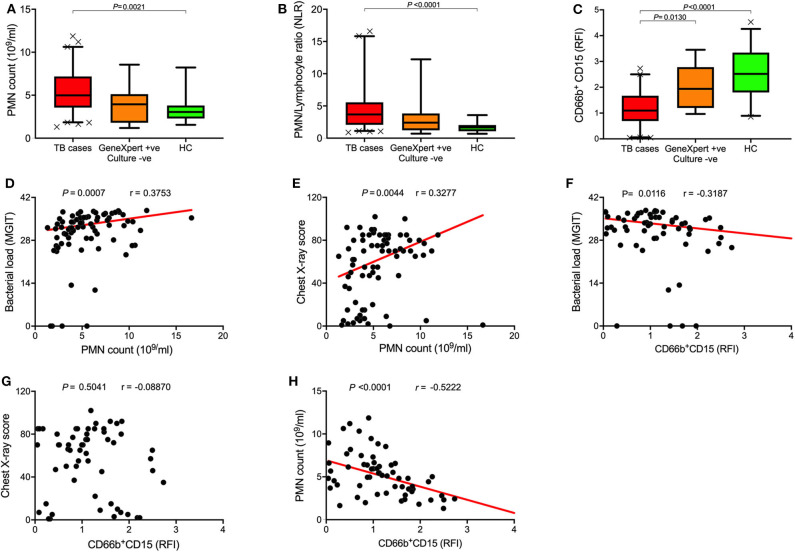
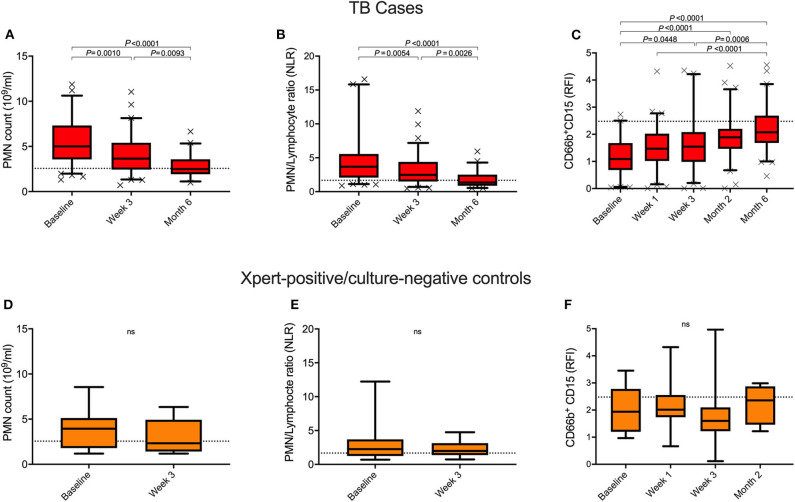
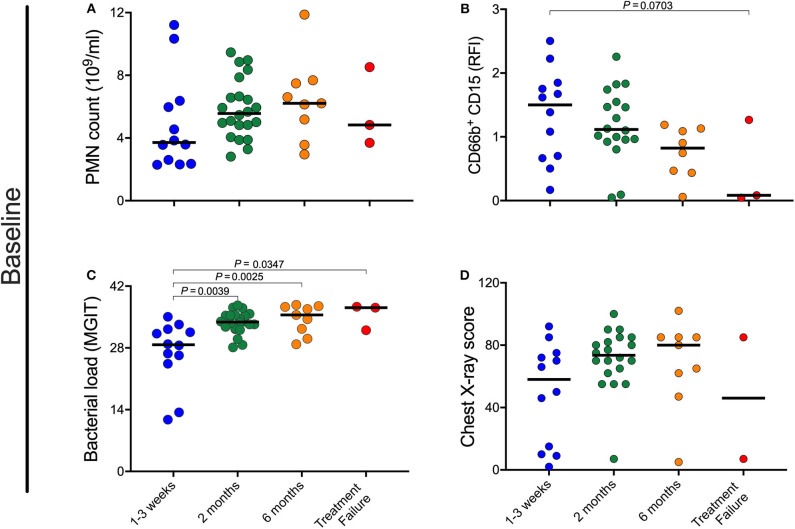
Tuberculosis remains a leading cause of death globally despite curative treatment, partly due to the difficulty of identifying patients who will not respond to therapy. Simple host biomarkers that correlate with response to drug treatment would facilitate improvement in outcomes and the evaluation of novel therapies. In a prospective longitudinal cohort study, we evaluated neutrophil count and phenotype at baseline, as well as during TB treatment in 79 patients [50 (63%) HIV-positive] with microbiologically confirmed drug susceptible TB undergoing standard treatment. At time of diagnosis, blood neutrophils were highly expanded and surface expression of the neutrophil marker CD15 greatly reduced compared to controls. Both measures changed rapidly with the commencement of drug treatment and returned to levels seen in healthy control by treatment completion. Additionally, at the time of diagnosis, high neutrophil count, and low CD15 expression was associated with higher sputum bacterial load and more severe lung damage on chest x-ray, two clinically relevant markers of disease severity. Furthermore, CD15 expression level at diagnosis was associated with TB culture conversion after 2 months of therapy (OR: 0.14, 95% CI: 0.02, 0.89), a standard measure of early TB treatment success. Importantly, our data was not significantly impacted by HIV co-infection. These data suggest that blood neutrophil metrics could potentially be exploited to develop a simple and rapid test to help determine TB disease severity, monitor drug treatment response, and identify subjects at diagnosis who may respond poorly to treatment.
Keywords: blood neutrophil count; neutrophil phenotype; tuberculosis biomarker; tuberculosis disease severity; tuberculosis treatment outcome.
Copyright © 2020 Ndlovu, Peetluk, Moodley, Nhamoyebonde, Ngoepe, Mazibuko, Khan, Karim, Pym, Maruri, Moosa, van der Heijden, Sterling and Leslie.
Figures
References
-
- World Health Organisation Tuberculosis. (2019). Available online at: https://www.who.int/news-room/fact-sheets/detail/tuberculosis (accessed March 23, 2020).
Publication types
MeSH terms
Substances
Grants and funding
LinkOut - more resources
Full Text Sources
Medical