. 2020 Aug 28:11:502359.
doi: 10.3389/fpls.2020.502359. eCollection 2020.

Latitudinal Biogeographic Structuring in the Globally Distributed Moss Ceratodon purpureus

Affiliations

Latitudinal Biogeographic Structuring in the Globally Distributed Moss Ceratodon purpureus

Elisabeth M Biersma et al. Front Plant Sci. .

Abstract

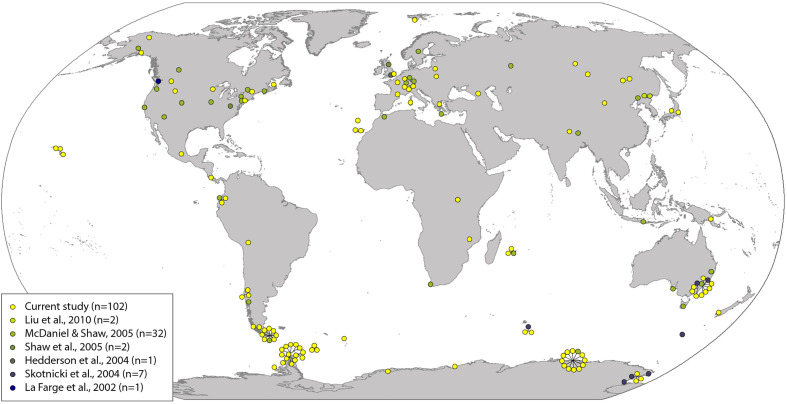
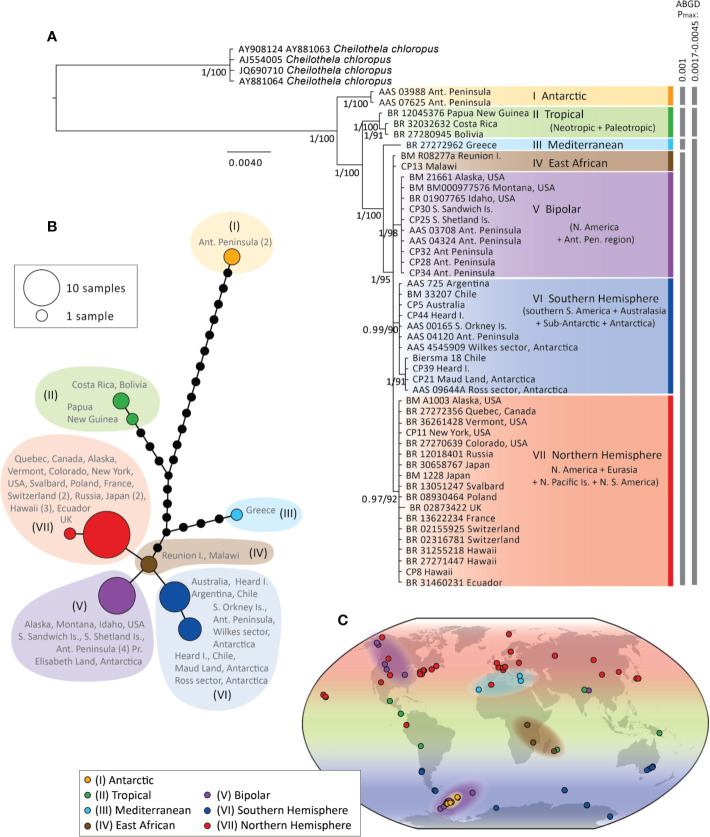
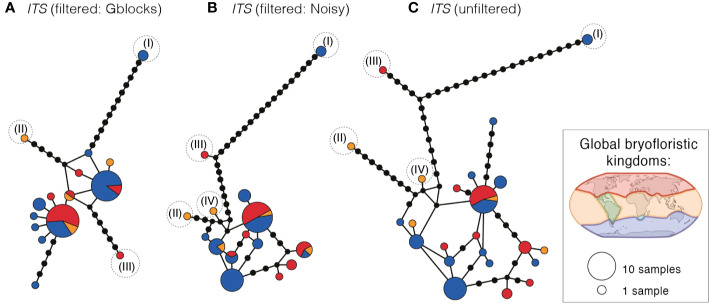
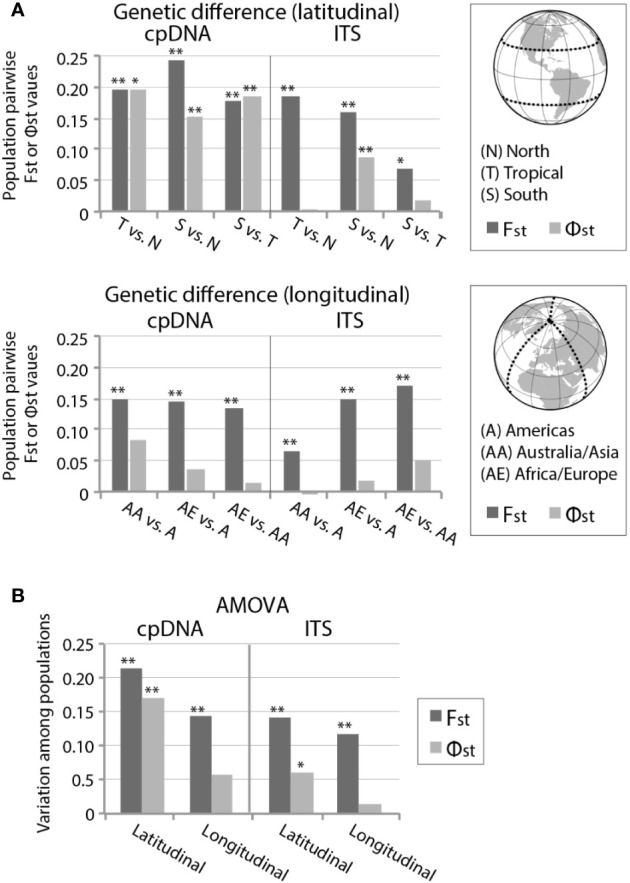
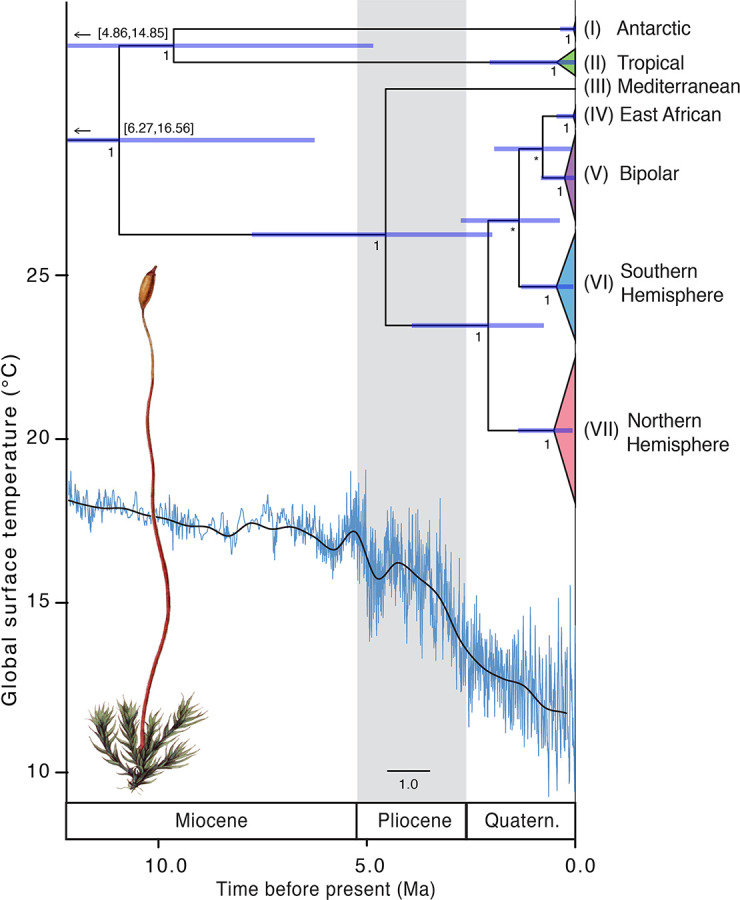
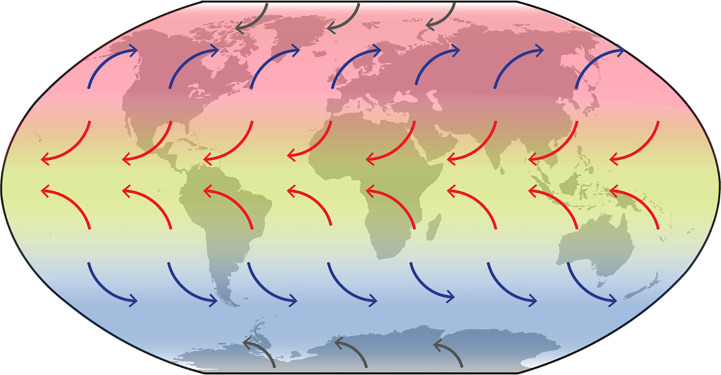
Biogeographic patterns of globally widespread species are expected to reflect regional structure, as well as connectivity caused by occasional long-distance dispersal. We assessed the level and drivers of population structure, connectivity, and timescales of population isolation in one of the most widespread and ruderal plants in the world - the common moss Ceratodon purpureus. We applied phylogenetic, population genetic, and molecular dating analyses to a global (n = 147) sampling data set, using three chloroplast loci and one nuclear locus. The plastid data revealed several distinct and geographically structured lineages, with connectivity patterns associated with worldwide, latitudinal "bands." These imply that connectivity is strongly influenced by global atmospheric circulation patterns, with dispersal and establishment beyond these latitudinal bands less common. Biogeographic patterns were less clear within the nuclear marker, with gene duplication likely hindering the detection of these. Divergence time analyses indicated that the current matrilineal population structure in C. purpureus has developed over the past six million years, with lineages diverging during the late Miocene, Pliocene, and Quaternary. Several colonization events in the Antarctic were apparent, as well as one old and distinct Antarctic clade, possibly isolated on the continent since the Pliocene. As C. purpureus is considered a model organism, the matrilineal biogeographic structure identified here provides a useful framework for future genetic and developmental studies on bryophytes. Our general findings may also be relevant to understanding global environmental influences on the biogeography of other organisms with microscopic propagules (e.g., spores) dispersed by wind.

Keywords: Antarctica; bryophyte; global; model organism; moss; phylogeography; spore; wind.


Figures

Figure 1
Figure 1
Geographical distribution of Ceratodon purpureus samples. Colored dots refer to sequences generated in this study (yellow) and previously published studies (remaining colors; for more information see Supplementary Table S1).
Figure 2
Figure 2
Bayesian phylogeny (A) and haplotype network (B) for Ceratodon purpureus constructed with a concatenated cpDNA data set (atpB-rbcL+rps4+trnL-F). Posterior probabilities and bootstrap support are shown next to branches (A). The scale bar represents the mean number of nucleotide substitutions per site. Biogeographic clade descriptions (I–VII) and ABGD species-clusters with different Pmax-values are shown next to (A). In (B) haplotype circle sizes and colors correspond to the number of specimens and clades I–VII, respectively. Branches represent mutations between haplotypes, with mutations shown as 1-step edges. (C) represents the sample locations and biogeographic regions of samples in the different clades (I–VII) as interpreted from the concatenated cpDNA data set (A), as well as the placement of samples in phylogenies of single cpDNA markers (e.g. when samples were only represented by one or two single cpDNA marker(s); see also Supplementary Figures S1A–D). For example, while the Mediterranean clade (III) includes just one sample (from Greece) in the concatenated cpDNA data set (A), clade III on the map in (C) includes one more sample from Greece (AY881059) and one from the Canary Islands (BM 27), based on the well-resolved placement of these samples in clade III in the Bayesian phylogenies of atpB-rbcL (Figure S1A) for the former, and rps4 and trnL-F (Figures S1C, D) for the latter, respectively.
Figure 3
Figure 3
Haplotype networks of ITS for Ceratodon purpureus, after treatment with (A) GBLOCKS, (B) NOISY or as (C) original data. Haplotype circle sizes and colors correspond to the number of specimens and globally recognized bryofloristic kingdoms (see legend; Schofield, 1992), respectively. Branches represent mutations between haplotypes, with mutations shown as 1-step edges. Numbers (I–IV) indicate the placement of the same samples falling in clades I–IV as resolved in the cpDNA data sets (see Figure 2).
Figure 4
Figure 4
(A) Pairwise FST and ΦST values and (B) analysis of molecular variance (AMOVA) within Ceratodon purpureus populations based on latitudinal and longitudinal geographically divided areas, including samples from the “concatenated cpDNA” and GBLOCKS filtered ITS data set. For details see Tables S3–S5. For geographically divided areas see legend in (A). P-values are represented by * for P < 0.05 and ** for P < 0.01.
Figure 5
Figure 5
Time-calibrated phylogeny of Ceratodon purpureus. The maximum clade credibility tree presents the median divergence time estimates for major lineages (Figure 2A) from a concatenated cpDNA data set (atpB-rbcL+rps4+trnL-F) using a coalescent tree prior. Node bars represent 95% height posterior distribution of age estimates. Posterior support (PP) values are shown below nodes, with PP < 0.5 provided as *. Global surface temperature estimates (blue and solid line representing temperature variations and a 500 kyr smoothed resolution, respectively), reproduced from Hansen et al. 2013, are provided below. Due to the old age (62.78 Mya; 95HDP 26.94–91.13 Mya; ) the split of the outgroup Cheilothela chloropus and Ceratodon purpureus is not shown in this figure. Note that the lower part of the 95HPD range of the two oldest nodes is not shown, but given in numbers above the node bars. Scale bar indicates the number of substitutions per site. Illustration by Christiaan Sepp (Kops et al., 1868; Wikimedia Commons).
Figure 6
Figure 6
Global wind patterns overlaying the distributions of the Southern Hemisphere (VI), Northern Hemisphere (VII), and tropical (II) clades (see Figure 2A). Red arrows: Trade Winds; blue arrows: Westerlies; grey arrows: Polar Easterlies.

References

    1. Biersma E. M., Jackson J. A., Hyvönen J., Koskinen S., Linse K., Griffiths H., et al. (2017). Global biogeographic patterns in bipolar moss species. R. Soc Open Sci. 4:170147. 10.1098/rsos.170147 - DOI - PMC - PubMed
    1. Biersma E. M., Jackson J. A., Bracegirdle T. J., Griffiths H., Linse K., Convey P. (2018. a). Low genetic variation between South American and Antarctic populations of the bank−forming moss Chorisodontium aciphyllum (Dicranaceae). Polar. Biol. 41, 599–610. 10.1007/s00300-017-2221-1 - DOI
    1. Biersma E. M., Jackson J. A., Stech M., Griffiths H., Linse K., Convey P. (2018. b). Molecular data suggest long-term in situ Antarctic persistence within Antarctica’s most speciose plant genus, Schistidium. Front. Ecol. Evol. 6:77. 10.3389/fevo.2018.00077 - DOI
    1. Biersma E. M., Torres-Díaz C., Molina-Montenegro M. A., Newsham K. K., Vidal M. A., Collado G. A., et al. (2020). Multiple post-glacial colonisation events of the Antarctic pearlwort Colobanthus quitensis (Caryophyllaceae) reveal the recent arrival of native Antarctic vascular flora. J. Biogeogr. 00, 1–11. 10.1111/jbi.13843 - DOI
    1. Bond W. J. (2015). Fires in the Cenozoic: a late flowering of flammable ecosystems. Front. Plant Sci. 5:749. 10.3389/fpls.2014.00749 - DOI - PMC - PubMed