. 2020 Sep 2:11:544435.
doi: 10.3389/fpls.2020.544435. eCollection 2020.

Respiratory CO2 Combined With a Blend of Volatiles Emitted by Endophytic Serendipita Strains Strongly Stimulate Growth of Arabidopsis Implicating Auxin and Cytokinin Signaling

Affiliations

Respiratory CO2 Combined With a Blend of Volatiles Emitted by Endophytic Serendipita Strains Strongly Stimulate Growth of Arabidopsis Implicating Auxin and Cytokinin Signaling

Jolien Venneman et al. Front Plant Sci. .

Abstract

Rhizospheric microorganisms can alter plant physiology and morphology in many different ways including through the emission of volatile organic compounds (VOCs). Here we demonstrate that VOCs from beneficial root endophytic Serendipita spp. are able to improve the performance of in vitro grown Arabidopsis seedlings, with an up to 9.3-fold increase in plant biomass. Additional changes in VOC-exposed plants comprised petiole elongation, epidermal cell and leaf area expansion, extension of the lateral root system, enhanced maximum quantum efficiency of photosystem II (Fv/Fm), and accumulation of high levels of anthocyanin. Notwithstanding that the magnitude of the effects was highly dependent on the test system and cultivation medium, the volatile blends of each of the examined strains, including the references S. indica and S. williamsii, exhibited comparable plant growth-promoting activities. By combining different approaches, we provide strong evidence that not only fungal respiratory CO2 accumulating in the headspace, but also other volatile compounds contribute to the observed plant responses. Volatile profiling identified methyl benzoate as the most abundant fungal VOC, released especially by Serendipita cultures that elicit plant growth promotion. However, under our experimental conditions, application of methyl benzoate as a sole volatile did not affect plant performance, suggesting that other compounds are involved or that the mixture of VOCs, rather than single molecules, accounts for the strong plant responses. Using Arabidopsis mutant and reporter lines in some of the major plant hormone signal transduction pathways further revealed the involvement of auxin and cytokinin signaling in Serendipita VOC-induced plant growth modulation. Although we are still far from translating the current knowledge into the implementation of Serendipita VOCs as biofertilizers and phytostimulants, volatile production is a novel mechanism by which sebacinoid fungi can trigger and control biological processes in plants, which might offer opportunities to address agricultural and environmental problems in the future.

Keywords: Piriformospora; endophytic Sebacinales; fungal volatiles; phytohormone signaling; plant growth and development; plant-microbe interactions.


Figures

Figure 1
Figure 1
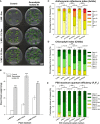
Effect of volatile production by PDA-grown Serendipita isolate 30 on A. thaliana grown on ½ MS with 0%, 1% and 3% sucrose, in a Petri-dish-in-box-assay. (A) Plant growth promotion after 10 days of co-cultivation. (B) Increase in mean shoot fresh weight. (C–E) Distribution of pixels across different classes of the spectral parameters anthocyanin (AriIdx, C) and chlorophyll (ChlIdx, D) content, and of the chlorophyll fluorescence parameter Fv/Fm (E). Average total values (± standard error) of the different spectral and fluorescence parameters for each of the tested conditions are shown above the respective stacked bars. For a visualization of the pixel distribution across the different classes in the shoot see Supplementary Figure S4. Error bars in (B–E) represent standard errors on the mean of four biological replicates with each replicate consisting of four plants. Asterisks indicate significant differences compared with the control values according to one-sided t-tests (* < 0.05, ** < 0.01, *** < 0.001). C, Control; MS, Murashige and Skoog; S, Serendipita; Suc, sucrose.
Figure 2
Figure 2
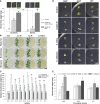
VOC-mediated effects of Serendipita on A. thaliana growth in split-plate assays. (A) VOC-driven plant growth effects (on ½ MS without sucrose) for a representative subset of PDA-grown Serendipita isolates after 10 days of co-cultivation. (B) Leaf series visualizing differences in leaf surface area and petiole length between control and VOC-treated plants. (C) Epidermal pavement cells as observed by light microscopy on the abaxial side of the fourth leaf of a control plant. (D) Same as (C) but with the leaf originating from a VOC-exposed plant. Data on the impact of Serendipita VOCs on Arabidopsis shoot biomass are presented in Supplementary Figures S5 and S9. Con, Control; Is., Isolate; Si, Serendipita indica; Sw, Serendipita williamsii.
Figure 3
Figure 3
VOC-mediated effects on Arabidopsis root development, examined in a vertical setup using a selection of Serendipita isolates. (A, B) Root and shoot growth stimulation of plants grown on ½ MS without sucrose after four (A) and eight (B) days of co-cultivation with isolates 30, 46 and S. indica cultured on PDA. Photographs of the entire plates for all tested isolates are included in Supplementary Figure S8. (C–E) Average primary root length (C), total lateral root length (D), and lateral root density (number of lateral roots per cm of primary root; E), measured per plant after 4 and 8 days of VOC exposure. Error bars indicate standard errors on the mean of the different treatments, based on three (4 DPI) or five (8 DPI) replicates. For each parameter and for both evaluation moments, values were compared across the different treatments using a Tukey HSD post hoc test (α = 0.05); treatments sharing the same letter above their respective bars do not exhibit statistically significant differences. The corresponding data on total root length (primary plus lateral roots) and shoot fresh weight are given in Supplementary Figures S9 and S10. Con, Control; DPI, days post “inoculation” (start of co-cultivation); Is., Isolate; N°, Number; Si, Serendipita indica; Sw, Serendipita williamsii.
Figure 4
Figure 4
The degree of VOC-mediated plant growth promotion in Arabidopsis depends on the Serendipita culture medium. (A) Arabidopsis plant growth (on ½ MS without sucrose) after 10 days of co-cultivation with Serendipita isolate 30, grown on different nutrient sources in the right compartment of I‐plates: 1. ½ MS + 1% sucrose (control plate), 2. plant nutrition medium (PNM), 3. ½ MS without sucrose, 4. ½ MS + 1% sucrose, 5. malt yeast peptone (MYP), 6. malt extract agar (MEA), 7. complex medium (CM), 8. potato dextrose agar (PDA). Plates 2–8 are inoculated with Serendipita whereas plate 1 is not. (B) Leaf series of a representative plant from each of the different growth conditions as presented in (A). (C) Plant growth effects caused by a 10-day exposure to Serendipita volatiles in a Petri-dish-in-box assay using isolate 30 grown on PDA and on ½ MS medium with 0%, 1% and 3% sucrose. (D) Mean shoot fresh weight of plants from (C). (E) Pixel distribution across five Fv/Fm classes based on chlorophyll fluorescence imaging of plant shoots from the Petri-dish-in-box assay (C). Average total values of Fv/Fm for each of the tested fungal media are shown above the respective stacked bars (standard errors are very low, ≤ 0.02). The results of the spectral measurements of anthocyanin and chlorophyll content are included in Supplementary Figure S11. Error bars in (D, E) indicate standard errors on the mean of four biological replicates; treatments sharing the same letter do not show statistically significant differences according to Tukey HSD post hoc tests (α = 0.05). Con, Control; MS, ½ Murashige and Skoog medium; Suc, Sucrose; PDA, potato dextrose agar. Scale bars = 1 cm.
Figure 5
Figure 5
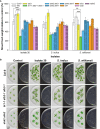
Volatile assays with Arabidopsis to assess the contribution of Serendipita respiratory CO2 to plant growth stimulation and morphology. (A) Plant growth and mean shoot fresh weight of Col-0 plants grown on ½ MS without sucrose after 8 days of co-cultivation with Serendipita isolate 30 cultured on PDA and on ½ MS with 1% sucrose in Y-plates in the presence and absence of 7 ml 0.1 M Ba(OH)2 as a CO2 trap. Full images of the different tested conditions can be found in Supplementary Figures S12A, B. (B) Arabidopsis plant growth (on ½ MS without sucrose) as observed after 10 days of co-cultivation with Serendipita isolates 30, 34, and S. indica (on PDA) in plates sealed with plastic foil, Breathe-Easy strips and Micropore tape. (C) Comparison of the average relative shoot fresh weight of Arabidopsis plants from plates closed with the sealing tapes from (B). The plastic foil data are derived from four independent experiments with one biological replicate each (see also Supplementary Figure S10), while the Breathe-Easy and Micropore results are based on a single experiment with three biological replicates. (D) Plant growth responses of the chloroplast mutants apg2, apg3, and cla1 grown on ½ MS + 1% sucrose after 14 days of exposure to volatiles from PDA-grown Serendipita isolate 30, S. indica and S. williamsii in I‐plates. Note that not only shoots but also roots in apg2 mutants are better developed under influence of Serendipita volatiles. Photographs of the entire plates are shown in Supplementary Figure S12C. (E) Mean shoot fresh weights corresponding to the treatments presented in (D). Error bars in (A, C, E) indicate standard errors on the mean of three replicates (four in case of plastic foil sealing in C). Asterisks in (A, E) point to significant differences between indicated treatments (A) or compared with the control (E) according to one-sided t-tests (* < 0.05, ** < 0.01, *** < 0.001). Treatments sharing the same letter above their respective bars in (A, C) are not significantly different according to Tukey HSD post hoc tests (α = 0.05). Note that although this test did not detect differences among the isolates in the assay with Micropore tape (C), a one-sided Dunnett’s test on the same data, comparing each treatment specifically with the control, revealed that exposure to VOCs from isolates 12 and 34 did lead to a significantly higher shoot biomass than that recorded for the corresponding control (see green asterisks; * < 0.05). Con, Control; Is., Isolate; MS, Murashige and Skoog medium; PDA, potato dextrose agar; Si, Serendipita indica; Suc, Sucrose; Sw, Serendipita williamsii.
Figure 6
Figure 6
Comparison of the effects of exposure to 1500 ppm CO2 and Serendipita VOCs on Arabidopsis in 4‐L glass reaction vessels. (A) Growth responses in shoots and roots of plants grown on ½ MS without sucrose after a 7-day treatment with either volatiles from PDA-grown isolate 30 or 1500 ppm CO2, as compared to the two control treatments. (B) Average shoot fresh weight of Arabidopsis plants subjected to the above treatments, expressed relative to the control. Asterisks indicate statistically significant differences with the control according to one-sided t-tests (* < 0.05, ** < 0.01). (C, D) Distribution of pixels across different classes of the spectral parameter anthocyanin (AriIdx, C) and of the chlorophyll fluorescence parameter Fv/Fm (D). Average total values of the two parameters (± standard errors) for each of the evaluated treatments are shown above the respective stacked bars. Treatments sharing the same letter do not exhibit statistically significant differences according to Tukey HSD post hoc tests (α = 0.05). For a visualization of the pixel distribution across the different classes in the shoots, see Supplementary Figure S14B. Graphical data for chlorophyll content (ChlIdx) are presented in Supplementary Figure S14C. Error bars in all displayed graphs indicate standard errors on the mean of three replicates with each replicate representing three plants (each vessel contained three Petri plates, which were considered as internal biological replicates). When we refer to “Control,” the data from the control vessel with air circulation are shown (does not differ from the control without circulation; see A).
Figure 7
Figure 7
Determination of Serendipita volatile profiles by direct headspace analysis using PTR-TOF-MS. (A) PCA plot visualizing general differences in the samples’ volatile profile as measured after 4 days of (co-)cultivation via PTR-TOF-MS. Color codes indicate whether the vessel contained either Arabidopsis cultures (green; grown on ½ MS without sucrose), fungal cultures (blue; isolate 30 cultured on either PDA or ½ MS without sucrose, S. indica on PDA, or S. williamsii on PDA) or both of them adjacent to each other (pink). Symbols refer to the different fungal strains and medium conditions tested. Numbers signify which samples were analyzed on the same day. The position of the samples in the reduced ordination space reveals that neither the two fungal conditions evaluated per isolate (co-cultivated with Arabidopsis or not) nor the three Serendipita isolates studied here can be distinguished based on their volatile profiles. The only exception to this general observation is isolate 30 cultured on ½ MS without sucrose: the VOC composition of this culture is different from that of the PDA cultures and appears to be modified in the presence of plants. (B, C) Concentrations of the two compounds that were most abundant in the headspace of the Serendipita cultures. These VOCs were detected at m/z ratios 63.024 (B) and 137.060 (C) during PTR-TOF-MS analysis, corresponding to DMS (C2H6S) and methyl benzoate (C8H8O2), respectively. Color codes are the same as in (A). The green dots for the plant controls in (B) stand for a concentration of 0 ppb. Experiments with isolate 30 on PDA were set up on three different days. Error bars represent standard deviations; treatments sharing the same letter above their respective bars are not significantly different according to a Dunn’s test adjusted for multiple comparisons (Bonferroni correction; α = 0.05). S. indica and S. williamsii (and isolate 30 on ½ MS) were evaluated in a single experiment (no error bars or statistics). The inset graphs (B1 and C1) show that the recorded concentration decreases over the time span of the sample measurement (2700 cycles or 45 min), resulting in a clear decay pattern. For each individual analysis, only the signals from 60 consecutive cycles at the beginning of the measurement were used to calculate an average concentration per compound. Is., Isolate; MS, ½ Murashige and Skoog medium; PDA, potato dextrose agar; Si, Serendipita indica; Suc, Sucrose; Sw, Serendipita williamsii.
Figure 8
Figure 8
Split-plate assay with Arabidopsis hormone-related mutants to explore the mechanisms underlying Serendipita VOC-mediated growth promotion. (A) Average shoot fresh weight of Arabidopsis wild‐type and mutant plants grown on ½ MS without sucrose after being exposed for 10 days to volatiles of isolate 30, S. indica and S. williamsii cultured on PDA, expressed relative to the corresponding untreated control. The bar color indicates the hormone type studied: white = wild type (Col-0 and Ws), yellow = abscisic acid (abi3), green = auxin (tir1-1 afb2-1 afb3-1), blue = cytokinin (ahk2 ahk3, ahk2 ahk4 and ahk3 ahk4), orange = ethylene (etr1 and ein2), purple = salicylic acid (sid2 and NahG). All lines are derived from the Col-0 ecotype, except for tir1-1 afb2-1 afb3-1, which has a mixed Col-0 (tir1-1)/Ws (afb2-1 afb3-1) background. Error bars represent standard errors on the mean of three biological replicates with each replicate consisting of five plants. For each of the three isolates tested, the magnitude of the growth response in the mutant lines was compared with that in the corresponding wild type by performing a Dunnett’s test; asterisks indicate statistically significant differences (** < 0.01, *** < 0.001). (B) Shoot and root growth in the Col-0 wild type and the two least responsive mutant lines after 10 days of co-cultivation with isolate 30, S. indica and S. williamsii. A complete overview showing the responses in all mutants is given in Supplementary Figure S18. Plates were sealed with Breathe-Easy strips.
Figure 9
Figure 9
CYCB1;1::GUS (A), DR5::GUS (B) and ARR5::GUS (C) expression in the shoots and roots of control and VOC-exposed Arabidopsis seedlings after 7 days of co-cultivation with Serendipita in split plates. Results are shown for Serendipita isolate 30; identical responses were recorded with S. indica and S. williamsii. The panels on the right display details on the GUS activity in lateral root tips (1 and 2) and in newly emerging lateral roots (3) or newly established lateral root primordia (4). Compared to the corresponding controls, GUS expression in the VOC-treated shoots was stronger and expanded only for ARR5::GUS, showing activity in the rosette leaves, aside from expression in the shoot apical meristem. With regard to the VOC-exposed root system, a higher and more extensive staining as compared to the control was observed in the root tips of all three reporter lines (see insets 1 and 2) and in the developing lateral roots/primordia of the CYCB1;1::GUS and DR5::GUS seedlings (see insets 3 and 4 in A, B). ARR5::GUS expression was weak or absent in lateral root initiation sites in treated (and non-treated) plants (see inset 3 in C), but large areas of the pericycle were activated in several parts of the root system upon VOC exposure (see inset 4 in C). Scale bars = 5 mm for the overview pictures on the left and 200 µm for the zooms on the right.
Figure 10
Figure 10
Effects of exposure to Serendipita VOCs compared to those caused by CO2 treatment (1500 ppm; see Figure 6) with respect to GUS activity. GUS expression patterns in the shoots and roots of the reporter lines CYCB1;1::GUS, DR5::GUS and ARR5::GUS, evaluated after 7 days of VOC/CO2 “fertilization,” are displayed. When we refer to “Control” without further specification, the images from the control vessel with air circulation are shown. Scale bars = 5 mm.
Figure 11
Figure 11
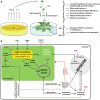
Overview of the responses observed in Arabidopsis seedlings exposed to Serendipita VOCs or 1500 ppm CO2 (A) and a tentative model explaining these observations (B). (A) Morphological and physiological changes in roots (supposedly the primary target of rhizofungal VOCs) and shoots upon VOC (purple color) and CO2 (blue) treatment. The illustration of the Arabidopsis plant is modified from figshare.com. (B) Model summarizing the biological processes that might be affected in VOC-exposed plants, based on our own observations combined with transcriptome/proteome data from other studies (especially García-Gómez et al., 2019). Serendipita VOCs stimulate the photosynthetic reactions (both the light-dependent reactions (e.g., effect on photosystem proteins) and the Calvin Cycle), interfere with hormone signaling pathways, and induce gene expression (see purple markings). The resulting elevated sugar levels, altered hormonal crosstalk, and modified proteome (see asterisks) contribute to plant growth modulation in a direct or indirect way. Augmentation of photosynthetic activity induced by Serendipita VOCs and respiratory CO2 is associated with a rise in the production of the Calvin cycle intermediate glyceraldehyde 3‐phosphate (GAP). The increase in GAP leads to higher sugar levels and stimulates the accumulation of plastidial MEP pathway-derived isoprenoid compounds, including hormones (e.g., CK, ABA), resulting in changes in the expression of genes involved in many different processes. The impact of elevated CO2 is especially linked to an enhanced photosynthetic CO2 fixation through maximization of the carboxylation rates of RuBP by Rubisco. At the same time, the non-productive oxygenation side-reaction in which Rubisco uses O2 as a substrate to oxygenate RuBP is competitively inhibited, preventing the formation of 2‐phosphoglycollate, which is recycled in the energy-demanding photorespiratory pathway instead of the Calvin cycle (Ainsworth and Rogers, 2007). Feedback inhibition of photosynthesis due to elevated carbohydrate levels via a hexokinase-dependent mechanism of glucose sensing (Rolland et al., 2006) does not occur in the VOC-exposed plants, possibly implicating the downregulation of ABA signal transduction (Zhang et al., 2008b) and increased cytokinin levels (Sánchez-López et al., 2016b). The increased sucrose and cytokinin levels due to volatile treatment induce the expression of anthocyanin biosynthesis genes through the activation of specific transcription factors of the MYB-bHLH-WD40 (MBW) regulatory complexes, exemplifying the intimate interplay between photosynthesis, carbohydrate-phytohormone metabolism/signaling and gene expression. CK, cytokinin; IAA, indole-3-acetic acid; GAP, glyceraldehyde 3‐phosphate; MEP, methylerythritol 4‐phosphate; ROS, reactive oxygen species; RuBP, ribulose-1,5-biphosphate.

Similar articles

Cited by

References

    1. Achatz B., von Rüden S., Andrade D., Neumann E., Pons-Kühnemann J., Kogel K. H., et al. (2010). Root colonization by Piriformospora indica enhances grain yield in barley under diverse nutrient regimes by accelerating plant development. Plant Soil 333, 59–70. 10.1007/s11104-010-03190 - DOI
    1. Ahmad M., Pataczek L., Hilger T. H., Zahir Z. A., Hussain A., Rasche F., et al. (2018). Perspectives of Microbial Inoculation for Sustainable Development and Environmental Management. Front. Microbiol. 9, 2992. 10.3389/fmicb.2018.02992 - DOI - PMC - PubMed
    1. Ainsworth E. A., Rogers A. (2007). The response of photosynthesis and stomatal conductance to rising [CO2]: mechanisms and environmental interactions. Plant Cell Environ. 30, 258–270. 10.1111/j.1365-3040.2007.01641.x - DOI - PubMed
    1. Alonso J. M., Stepanova A. N. (2004). The ethylene signaling pathway. Science 306, 1513–1515. 10.1126/science.1104812 - DOI - PubMed
    1. Ameztoy K., Baslam M., Sánchez-López Á.M., Muñoz F. J., Bahaji A., Almagro G., et al. (2019). Plant responses to fungal volatiles involve global posttranslational thiol redox proteome changes that affect photosynthesis. Plant Cell Environ. 42, 2627–2644. 10.1111/pce.13601 - DOI - PubMed