

Three Genes Predict Prognosis in Microenvironment of Ovarian Cancer
- PMID: 32983229
- PMCID: PMC7492617
- DOI: 10.3389/fgene.2020.00990
Three Genes Predict Prognosis in Microenvironment of Ovarian Cancer
Abstract
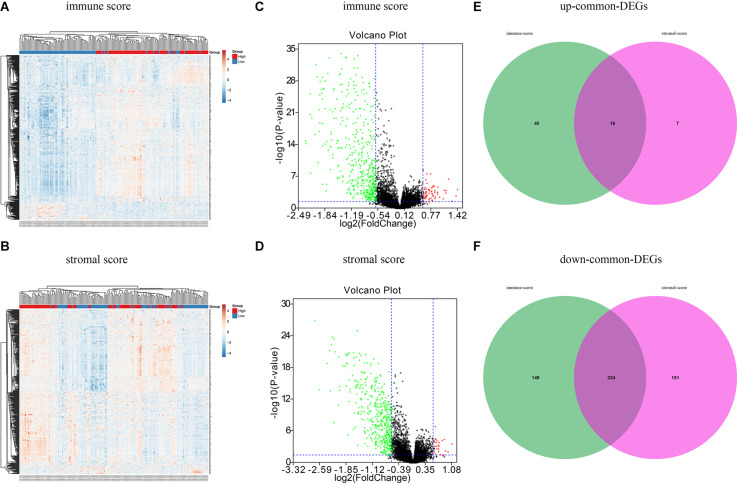
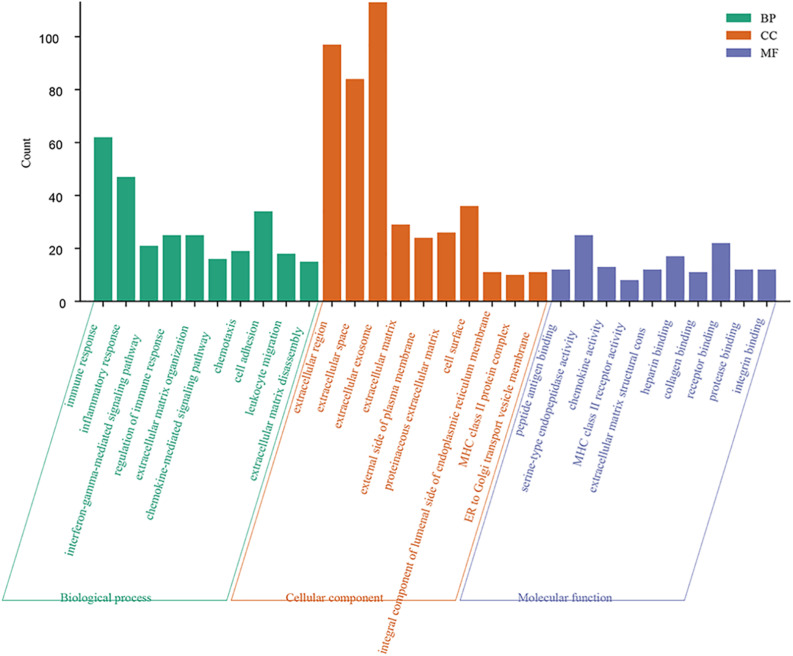
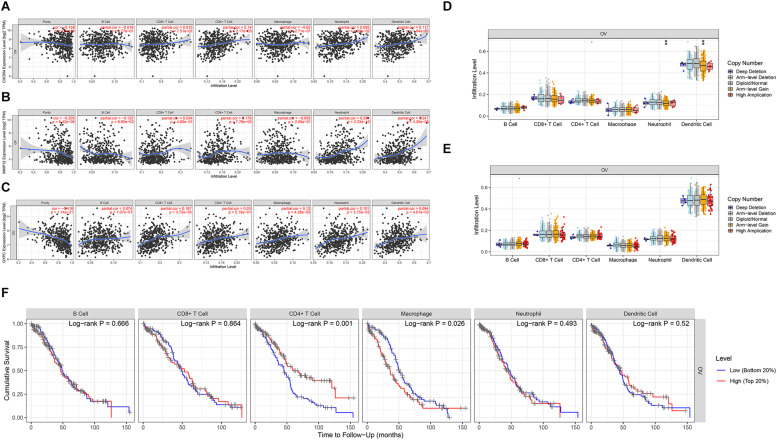
Ovarian cancer (OC) is the deadliest gynecological cancer in women. Immune cell infiltration has a critical role in regulating carcinogenesis and prognosis in OC. To identify prognostic genes relevant to the tumor microenvironment in OC, we investigated the association between OC and gene expression profiles. Results obtained with the ESTIMATE R tool showed that immune score and stromal score were correlated with lymphatic invasion, and high immune score predicted a favorable prognosis. A total of 342 common differentially expressed genes were identified according to the two scores; these genes were mainly involved in immune response, extracellular region, and serine-type endopeptidase activity. Three immune-related prognostic genes were selected by univariate and multivariate Cox regression analysis. We further established a prognostic model and validated the prognostic value of three hub genes in different databases; our results showed that this model could accurately predict survival and evaluate prognosis independent of clinical characteristics. Three hub genes have prognostic value in OC. TIMER analysis revealed that the three genes were correlated with different immune cells. Low levels of macrophage infiltration and high levels of CD4+ T cell infiltration were associated with favorable survival outcomes. Arm-level gain of GYPC was correlated with neutrophils and dendritic cells. These findings indicate that CXCR4, GYPC, and MMP12 modulate prognosis via effects on the infiltration of immune cells. Thus, these genes represent potential targets for immune therapy in OC.
Keywords: The Cancer Genome Atlas; immune score; ovarian cancer; overall survival; stromal score; tumor microenvironment.
Copyright © 2020 Guo, Wang, Su, Yang, Chen and Luo.
Figures


Similar articles
-
Immune and Stroma Related Genes in Breast Cancer: A Comprehensive Analysis of Tumor Microenvironment Based on the Cancer Genome Atlas (TCGA) Database.Front Med (Lausanne). 2020 Mar 5;7:64. doi: 10.3389/fmed.2020.00064. eCollection 2020. Front Med (Lausanne). 2020. PMID: 32195260 Free PMC article.
-
Integrated analysis of prognostic immune-related genes in the tumor microenvironment of ovarian cancer.Ann Transl Med. 2022 Jan;10(2):91. doi: 10.21037/atm-21-7014. Ann Transl Med. 2022. PMID: 35282097 Free PMC article.
-
Tumor Immune Microenvironment Related Gene-Based Model to Predict Prognosis and Response to Compounds in Ovarian Cancer.Front Oncol. 2021 Dec 13;11:807410. doi: 10.3389/fonc.2021.807410. eCollection 2021. Front Oncol. 2021. PMID: 34966691 Free PMC article.
-
Identification and validation of a 9-gene signature for the prognosis of ovarian cancer by integrated bioinformatical analysis.Ann Transl Med. 2022 Oct;10(19):1059. doi: 10.21037/atm-22-3752. Ann Transl Med. 2022. PMID: 36330389 Free PMC article.
-
Crosstalk of Immune Cells and Platelets in an Ovarian Cancer Microenvironment and Their Prognostic Significance.Int J Mol Sci. 2023 May 25;24(11):9279. doi: 10.3390/ijms24119279. Int J Mol Sci. 2023. PMID: 37298230 Free PMC article. Review.
Cited by
-
Integrative analyses of multi-omics data constructing tumor microenvironment and immune-related molecular prognosis model in human colorectal cancer.Heliyon. 2024 Jun 8;10(12):e32744. doi: 10.1016/j.heliyon.2024.e32744. eCollection 2024 Jun 30. Heliyon. 2024. PMID: 38975206 Free PMC article.
-
Identification of a glycolysis-related gene signature for survival prediction of ovarian cancer patients.Cancer Med. 2021 Nov;10(22):8222-8237. doi: 10.1002/cam4.4317. Epub 2021 Oct 5. Cancer Med. 2021. PMID: 34609082 Free PMC article.
-
The emerging double-edged sword role of Sirtuins in the gastric inflammation-carcinoma sequence revealed by bulk and single-cell transcriptomes.Front Oncol. 2022 Oct 17;12:1004726. doi: 10.3389/fonc.2022.1004726. eCollection 2022. Front Oncol. 2022. PMID: 36324577 Free PMC article.
-
Identification of a six-gene prognostic signature for bladder cancer associated macrophage.Front Immunol. 2022 Oct 6;13:930352. doi: 10.3389/fimmu.2022.930352. eCollection 2022. Front Immunol. 2022. PMID: 36275756 Free PMC article.
-
CXCR4 knockdown enhances sensitivity of paclitaxel via the PI3K/Akt/mTOR pathway in ovarian carcinoma.Aging (Albany NY). 2022 Jun 9;14(11):4673-4698. doi: 10.18632/aging.203241. Epub 2022 Jun 9. Aging (Albany NY). 2022. PMID: 35681259 Free PMC article.
References
LinkOut - more resources
Full Text Sources
Research Materials
Miscellaneous