

Association between categorization of emotionally-charged and neutral visual scenes and parameters of event-related potentials in carriers of different COMT, HTR2A, BDNF gene genotypes
- PMID: 32983417
- PMCID: PMC7495216
- DOI: 10.12688/f1000research.22503.2
Association between categorization of emotionally-charged and neutral visual scenes and parameters of event-related potentials in carriers of different COMT, HTR2A, BDNF gene genotypes
Abstract
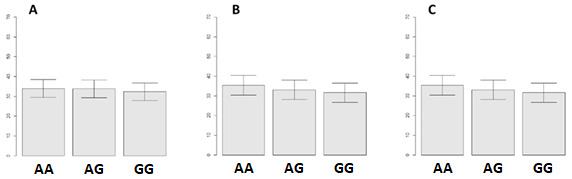
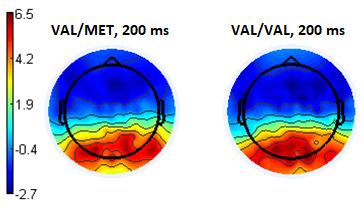
Background: This study aimed to discover the association between parameters of event-related potentials (ERPs) and categorization of images of visual scenes, both emotionally-charged and neutral, in carriers of different genotypes of the COMT, HTR2A, BDNF genes. Methods: Electroencephalogram (EEG) and ERPs were recorded at 128 leads, with two ear referents. Images of different visual scenes were presented to the study participants sequentially on a monitor screen. The participants' task was to examine these images and indicate what emotions (negative, neutral or positive) they elicit. Comparison of event-related potentials was carried out using unpaired Student t-test in EEGLAB toolbox. Results: COMT. A stronger reaction, as reflected in the amplitude of the ERPs, in participants with the recessive homozygous Met/Met genotype was observed on latency around 200 ms to the stimuli, assessed as positive. Carriers of dominant homozygous Val/Val genotype had higher amplitude of 200 ms peak when assessed scene images as either neutral or negative in comparison to other genotypes. Participant with the Val/Met heterozygous genotype had higher amplitude of ERP that Met/Met group on same latency when assessed stimuli as negative. HTR2A . Significant increase in negativity in the parietal-occipital regions revealed in the range of 350-420 ms in participants with the recessive homozygous A/A genotype when choosing any type of assessment, compared to carriers of the heterozygous genotype A/G and the dominant homozygous G/G genotype. BDNF. Participants with Val/Val genotype categorized the visual images more thoroughly, as reflected in greater activation of the parietal-occipital zones and higher amplitude on ERP peak on 190 ms (negative assessment) and 160 ms (neutral assessment) then Val/Met carriers. Conclusions: The COMT, HTR2A, BDNF gene different genotypes are associated with the process of categorizing emotionally charged and neutral visual scenes, and this relationship is reflected in the ERP parameters.
Keywords: BDNF genes polymorphisms.; COMT; Categorization of emotionally-charged and neutral visual scenes; HTR2A; parameters of event-related potentials.
Copyright: © 2020 Vorobyeva EV et al.
Conflict of interest statement
No competing interests were disclosed.
Figures


Similar articles
-
Recognition of Emotional and Neutral Visual Scenes in Carriers of the MAOA, COMT, DRD4, and 5HT2A Gene Polymorphisms.Psychol Russ. 2022 Dec 30;15(4):159-169. doi: 10.11621/pir.2022.0410. eCollection 2022. Psychol Russ. 2022. PMID: 36761718 Free PMC article.
-
Genetic influence of COMT and BDNF gene polymorphisms on resilience in healthy college students.Neuropsychobiology. 2013;68(3):174-80. doi: 10.1159/000353257. Epub 2013 Sep 30. Neuropsychobiology. 2013. PMID: 24107543
-
Different Roles of COMT and HTR2A Genotypes in Working Memory Subprocesses.PLoS One. 2015 May 14;10(5):e0126511. doi: 10.1371/journal.pone.0126511. eCollection 2015. PLoS One. 2015. PMID: 25974269 Free PMC article.
-
[Investigation of association of the brain-derived neurotrophic factor (BDNF) and a serotonin receptor 2A (5-HTR2A) genes with voluntary and involuntary attention in schizophrenia].Zh Nevrol Psikhiatr Im S S Korsakova. 2008;108(4):62-9. Zh Nevrol Psikhiatr Im S S Korsakova. 2008. PMID: 18454098 Russian.
-
Catechol-O-methyltransferase, dopamine, and sleep-wake regulation.Sleep Med Rev. 2015 Aug;22:47-53. doi: 10.1016/j.smrv.2014.10.006. Epub 2014 Oct 27. Sleep Med Rev. 2015. PMID: 25466290 Review.
Cited by
-
Emotional Intelligence in Carriers of Different СОМТ, BDNF, DRD2 and HTR2A Genotypes.Psychol Russ. 2022 Jun 30;15(2):83-96. doi: 10.11621/pir.2022.0206. eCollection 2022. Psychol Russ. 2022. PMID: 36699706 Free PMC article.
-
Recognition of Emotional and Neutral Visual Scenes in Carriers of the MAOA, COMT, DRD4, and 5HT2A Gene Polymorphisms.Psychol Russ. 2022 Dec 30;15(4):159-169. doi: 10.11621/pir.2022.0410. eCollection 2022. Psychol Russ. 2022. PMID: 36761718 Free PMC article.
References
-
- Alfimova MV, Golimbet VE, Barkhatova AN, et al. : [The role of genotype-environment interactions in the development of symptoms of anxiety and depression related to the disease burden for family]. Zh Nevrol Psikhiatr Im S S Korsakova. 2009;109(12):50–54. - PubMed
-
- Alfimova MV, Golimbet VE, Korovaitseva GI, et al. : The Role of the Interaction between the NMDA and Dopamine Receptor Genes in Impaired Recognition of Emotional Expression in Schizophrenia. Neuroscience and Behavioral Physiology. 2019;49(1):153–158. 10.1007/s11055-018-0709-y - DOI
-
- Chen ZY, Patel PD, Sant G, et al. : Variant Brain-Derived Neurotrophic Factor (BDNF) (Met66) Alters the Intracellular Trafficking and Activity-Dependent Secretion of Wild-Type BDNF in Neurosecretory Cells and Cortical Neurons. J Neurosci. 2004;24(18):4401–4411. 10.1523/JNEUROSCI.0348-04.2004 - DOI - PMC - PubMed
Publication types
MeSH terms
Substances
LinkOut - more resources
Full Text Sources
Miscellaneous