

doi: 10.1038/s41421-020-00209-2.
eCollection 2020.
Temporal antibody responses to SARS-CoV-2 in patients of coronavirus disease 2019
Affiliations
- PMID: 32983570
- PMCID: PMC7490261
- DOI: 10.1038/s41421-020-00209-2
Item in Clipboard
Temporal antibody responses to SARS-CoV-2 in patients of coronavirus disease 2019
Cell Discov.
.
No abstract available
Keywords: Autoimmunity; Immunology.
Conflict of interest statement
Conflict of interestThe authors declare that they have no conflict of interest.
Figures
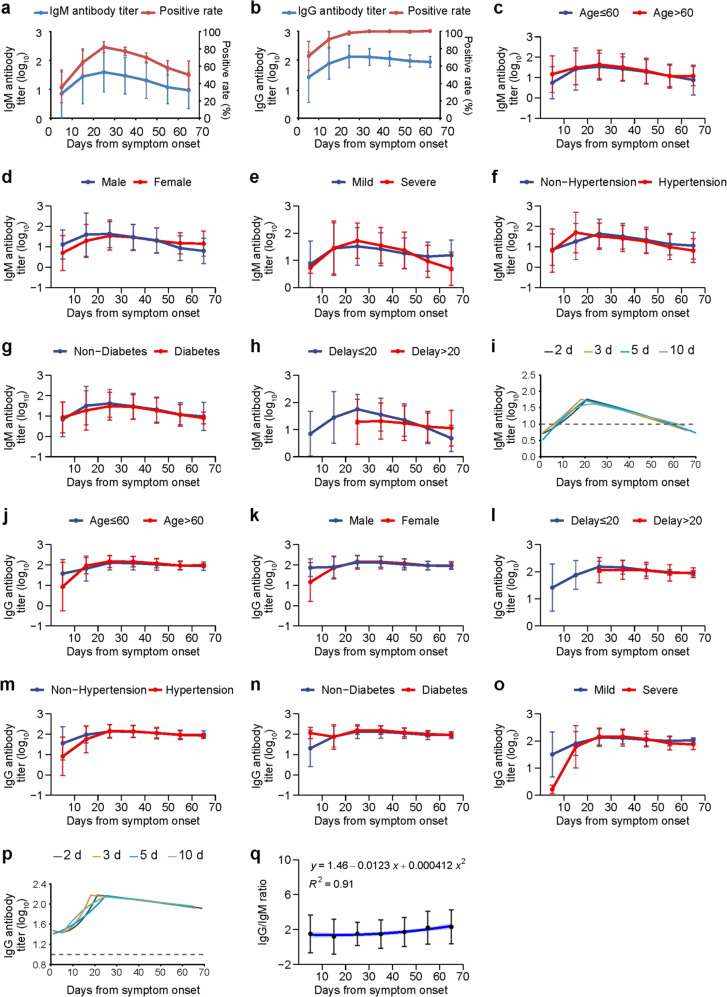
The IgM and IgG levels in the COVID-19 patient serum was determined with a chemiluminescence assay. A total of 366 RT-PCR confirmed patients were enrolled. a IgM antibody titer (blue) and positive rate (red); b IgG antibody titer (blue) and positive rate (red); c IgM level in patients with age ≤60-year or age >60-year old; d IgM level in 177 male and 189 female patients; e IgM level in patients with 222 mild and 144 severe symptoms; f IgM level in 136 patients with and 230 patients without hypertension; g IgM level in 65 patients with and 301 patients without diabetes; h IgM level in 212 patients with ≤20 days and 154 patients with >20 days delay from symptom onset to admission; i quadratic fitting curves of IgM titer calculated based on every two-day, three-day, five-day, and ten-day time points; j IgG level in patients with age ≤60-year or age >60-year old; k IgG level in the male or female patients; l IgG level in 212 patients with ≤20 days and 154 patients with >20 days delay from symptom onset to admission; m IgG level in 136 patients with and 230 patients without hypertension; n IgG level in 65 patients with or 301 patients without diabetes; o IgG level in patients with mild (222) or severe (144) symptoms; p quadratic fitting curve of IgG titer calculated based on every two-day, three-day, five-day, and ten-day time points; q IgG/IgM ratio was calculated as log10(1/IgG) divided by log10(1/IgM); the mean and standard deviation were presented for IgG/IgM ratio; the fitting curve for IgG/IgM ratio and 95% CI (light blue area) were plotted. The GMRT and standard deviation were presented for antibody titers. The positive rate and 95% CI were presented for IgM or IgG. The IgM and IgG antibody reciprocal titers were log-transformed to allow for comparisons of GMRT across groups by GEE (c–h and j–n). The quadratic fitting curves were performed for IgM (i) or IgG (p) antibody titers in the rising stage and falling stage. Calculation was performed based on every two-day, three-day, five-day, and ten-day points, of which the ten-day points results showed the highest R2 (0.99 for IgM and 0.93 for IgG) and was used for the analysis. The measurement was performed once with the coefficient of variation value of around 5%. CI confidence interval, GMRT geometric mean reciprocal titer, GEE generalized estimation equation.
References
-
- World Health Organization. Coronavirus disease (COVID-2019) situation reports (World Health Organization, 2020).
Publication types
LinkOut - more resources
Full Text Sources
Miscellaneous
