

Optimal Partial Pressure of Oxygen Affects Outcomes in Patients With Severe Traumatic Brain Injury
- PMID: 32983668
- PMCID: PMC7510506
- DOI: 10.7759/cureus.9964
Optimal Partial Pressure of Oxygen Affects Outcomes in Patients With Severe Traumatic Brain Injury
Abstract
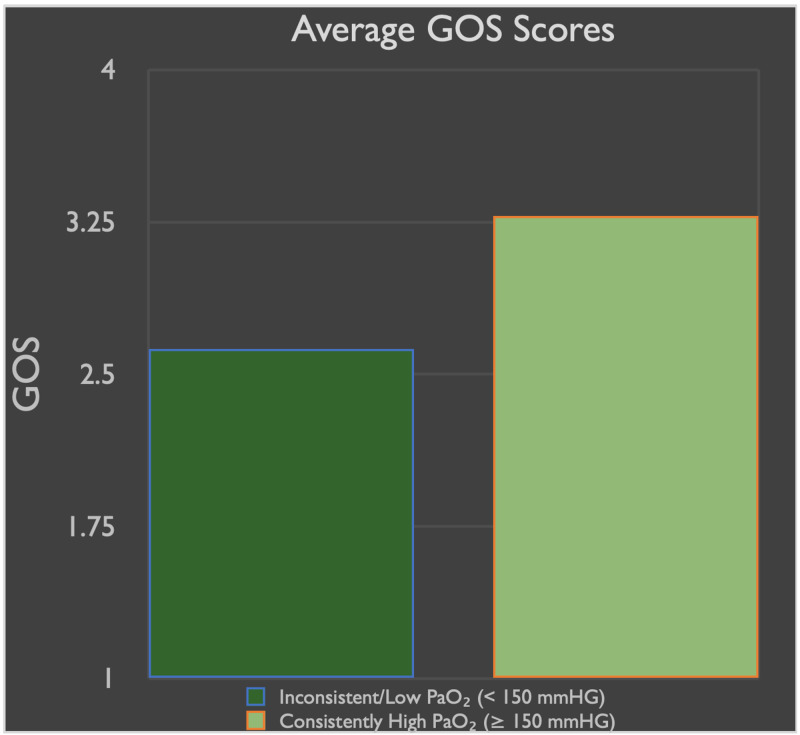
Introduction Severe traumatic brain injury (TBI) is a leading cause of death and disability. Not all neuronal damage occurs at the time of primary injury, but rather TBI initiates a cascade of events that leads to secondary brain injury. Oxygenation is one crucial factor in maintaining brain tissue homeostasis post-injury. We performed a retrospective review of patients admitted to a single trauma center after TBI. Statistical analysis was performed to ascertain if the measured partial pressure of oxygen (PaO₂) affected overall outcome at the time of discharge from the hospital. Materials and Methods Statistical analysis was performed retrospectively on patients admitted with a Glasgow Coma Scale (GCS) < 8 and a diagnosis of TBI. GCS and Glasgow Outcome Scale (GOS) were calculated from physical examination findings at the time of hospital discharge or death. Patient data were separated into two groups: those with consistently higher average PaO₂ scores (≥ 150 mmHg; n = 7) and those with lower average PaO₂ scores (< 150 mmHg; n = 8). The minimum requirement to be categorized in the consistently higher group was to have an average hospital day 1 through 5 PaO₂ value of ≥ 150 mmHg. Results Patients with consistent hospital Day 1 through 5 PaO₂ scores of ≥ 150 mmHg had statistically significant higher GCS scores at the end of intensive care unit (ICU)-level care or hospital discharge (mean = 12, p = 0.01), compared to those in group 2 with lower PaO₂ levels (mean = 7.9). There was no statistically significant difference in GOS when comparing the two groups (p = 0.055); however, the data did show a trend toward significance. Discussion and Conclusion In our study we analyzed patients diagnosed with TBI and stratified them into groups based on PaO₂ ≥ or < 150 mmHg. We demonstrate overall outcome improvement based on GCS with a trend toward improved GOS. The GCS showed statistical significance in patients with PaO₂ consistently ≥ 150 mmHg versus those in group 2 over the first five days of hospitalization.
Keywords: brain trauma; neurosurgery; pao2; partial pressure of oxygen; tbi; traumatic brain injury.
Copyright © 2020, Wiginton et al.
Conflict of interest statement
The authors have declared that no competing interests exist.
Figures


Similar articles
-
Increased Brain Tissue Oxygen Monitoring Threshold to Improve Hospital Course in Traumatic Brain Injury Patients.Cureus. 2020 Feb 27;12(2):e7115. doi: 10.7759/cureus.7115. Cureus. 2020. PMID: 32257661 Free PMC article.
-
Proper Partial Pressure of Arterial Oxygen for Patients with Traumatic Brain Injury.Med Sci Monit. 2021 Oct 19;27:e932318. doi: 10.12659/MSM.932318. Med Sci Monit. 2021. PMID: 34663780 Free PMC article.
-
Analysis of long-term (median 10.5 years) outcomes in children presenting with traumatic brain injury and an initial Glasgow Coma Scale score of 3 or 4.J Neurosurg Pediatr. 2015 Oct;16(4):410-9. doi: 10.3171/2015.3.PEDS14679. Epub 2015 Jul 3. J Neurosurg Pediatr. 2015. PMID: 26140392
-
Prognostic Significance of Magnetic Resonance Imaging in Detecting Diffuse Axonal Injuries: Analysis of Outcomes and Review of Literature.Neurol India. 2022 Nov-Dec;70(6):2371-2377. doi: 10.4103/0028-3886.364066. Neurol India. 2022. PMID: 36537418 Review.
-
Impact of Glasgow Coma Scale score and pupil parameters on mortality rate and outcome in pediatric and adult severe traumatic brain injury: a retrospective, multicenter cohort study.J Neurosurg. 2017 Mar;126(3):760-767. doi: 10.3171/2016.1.JNS152385. Epub 2016 Apr 1. J Neurosurg. 2017. PMID: 27035177
Cited by
-
Dose-dependent association of hyperoxia and decreased favorable outcomes in mechanically ventilated patients with traumatic brain injury, a retrospective cohort study.Eur J Trauma Emerg Surg. 2025 Jan 24;51(1):75. doi: 10.1007/s00068-024-02730-5. Eur J Trauma Emerg Surg. 2025. PMID: 39856357 Free PMC article.
References
-
- Epidemiology of severe traumatic brain injury. Iaccarino C, Carretta A, Nicolosi F, Morselli C. J Neurosurg Sci. 2018 - PubMed
-
- Surveillance for traumatic brain injury-related deaths--United States, 1997-2007. Coronado VG, Xu L, Basavaraju SV, et al. https://stacks.cdc.gov/view/cdc/6014 MMWR Surveill Summ. 2011;60:1–32. - PubMed
-
- Improvement in GOS and GOSE scores 6 and 12 months after severe traumatic brain injury. Corral L, Ventura JL, Herrero JI, et al. Brain Inj. 2007;21:1225–1231. - PubMed
-
- Early indicators of prognosis in 846 cases of severe traumatic brain injury. Jiang JY, Gao GY, Li WP, Yu MK, Zhu C. J Neurotrauma. 2002;19:869–874. - PubMed
LinkOut - more resources
Full Text Sources